Submitted Successfully!
To reward your contribution, here is a gift for you: A free trial for our video production service.
Thank you for your contribution! You can also upload a video entry or images related to this topic.
Version Summary Created by Modification Content Size Created at Operation
1 -- 2279 2023-10-24 09:02:31 |
2 Reference format revised. Meta information modification 2279 2023-10-24 09:25:44 |

Video Upload Options

Do you have a full video?

Confirm

Are you sure to Delete?
Cite
If you have any further questions, please contact Encyclopedia Editorial Office.
Nogueira, A.; Ferreira, A.; Figueiredo, M. DNA Microarrays. Encyclopedia. Available online: https://encyclopedia.pub/entry/50711 (accessed on 19 May 2024).
Nogueira A, Ferreira A, Figueiredo M. DNA Microarrays. Encyclopedia. Available at: https://encyclopedia.pub/entry/50711. Accessed May 19, 2024.
Nogueira, Adara, Artur Ferreira, Mário Figueiredo. "DNA Microarrays" Encyclopedia, https://encyclopedia.pub/entry/50711 (accessed May 19, 2024).
Nogueira, A., Ferreira, A., & Figueiredo, M. (2023, October 24). DNA Microarrays. In Encyclopedia. https://encyclopedia.pub/entry/50711
Nogueira, Adara, et al. "DNA Microarrays." Encyclopedia. Web. 24 October, 2023.
DNA Microarrays
Edit

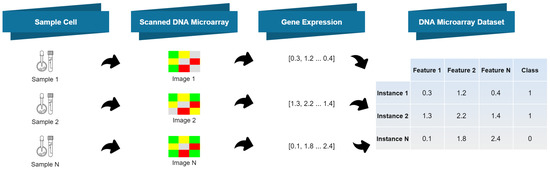
Early disease detection using microarray data is vital for prompt and efficient treatment. However, the intricate nature of these data and the ongoing need for more precise interpretation techniques make it a persistently active research field. Numerous gene expression datasets are publicly available, containing microarray data that reflect the activation status of thousands of genes in patients who may have a specific disease. ThesGene expression microarrays, also known as DNA microarrays, are laboratory tools used to measure the expression levels of thousands of genes simultaneously, thus providing a snapshot of the cellular function (for technical details.e datasets encompass a vast number of genes, resulting in high-dimensional feature vectors that present significant challenges for human analysis. 

microarray data cancer detection DNA microarrays

1. Introduction

A microarray dataset represents the expression levels of thousands of genes under specific conditions, often represented as a matrix, where each row represents a gene, each column represents a sample (such as a cell or tissue at a specific time), and each cell in the matrix represents the expression level of a gene in a specific sample. These data can be used to compare gene expression between different conditions (such as healthy and diseased cells), by identifying patterns of gene expression. Machine Learning (ML) tools and techniques play a decisive role in automating the use of microarray data, which has fostered the appearance of many publicly available gene expression datasets [1] (see http://csse.szu.edu.cn/staff/zhuzx/Datasets.html, accessed on 2 July 2023). These datasets are useful to learn models that are able to predict the presence of a given disease from the gene expression data of an individual. From a scientific perspective, it is also very important to identify the most relevant genes for a given disease classification/detection task.

2. DNA Microarrays

2.1. DNA Microarrays: Acquisition Technique and Resulting Data

Gene expression microarrays, also known as DNA microarrays, are laboratory tools used to measure the expression levels of thousands of genes simultaneously, thus providing a snapshot of the cellular function (for technical details, see learn.genetics.utah.edu/content/labs/microarray/, accessed on 2 July 2023). A DNA microarray has the following characteristics:
  • It is composed by a solid surface, arranged in columns and rows, containing thousands of spots;
  • Each spot refers to one single gene and contains multiple strands of the same DNA, yielding a unique DNA sequence;
  • Each spot location and its corresponding DNA sequence is recorded in a database.
The DNA microarray data acquisition process includes four stages, as depicted in Figure 1.
Figure 1. Overview of the DNA microarray technique data acquisition from samples [2].
1.
Extraction of ribonucleic acid (RNA) from the sample cells and drawing out the messenger RNA (mRNA) from the existing RNA, because only the mRNA develops gene expression.
2.
CDNA creation: a DNA copy is made from the mRNA using the reverse transcriptase enzyme, which generates the complementary DNA (CDNA). A label is added in the CDNA representing each cell sample (e.g., with fluorescent red and green for cancer and healthy cells, respectively). This step is necessary since DNA is more stable than RNA and this labeling allows identifying the genes.
3.
Hybridization: both CDNA types are added to the DNA microarray and each spot already has many unique CDNA. When mixed together, they will base-pair each other due to the DNA complementary base pairing property. Not all CDNA strands will bind to each other, since some may not hybridize being washed off.
4.
Analysis: the DNA microarray is analyzed with a scanner to find patterns of hybridization by detecting the fluorescent colors.
The following are possible outcomes of the analysis stage:
  • A few red CDNA molecules bound to a spot, if the gene is expressed only in the cancer (red) cells;
  • A few green CDNA molecules bound to another spot, if the gene is expressed only in the healthy (green) cells;
  • Some of both red and green CDNA molecules bound to a single spot on the microarray, yielding a yellow spot; in this case, the gene is expressed both in the cancer and healthy cells;
  • Finally, several spots of the microarray do not have a single red or green CDNA strand bound to them; this happens if the gene is not being expressed in either type of cell.
On the one hand, the red color flags the higher production of mRNA in the cancer cell as compared to the healthy cell. On the other hand, the green color states that people have a larger production of mRNA in the healthy cell, as compared to the cancer cell. However, a yellow spot suggests that the gene is expressed equally in both cells and therefore it is not related with the disease, because when the healthy cell becomes cancerous its activity does not change.
Figure 2 depicts the process of generating a dataset using the DNA microarray technique summarized in Figure 1.
Figure 2. Dataset generation with gene expression data from DNA microarray data acquisition [2].

2.2. Feature Discretization

DNA microarray datasets are composed of high dimensionality numeric feature vectors. These features contain a large amount of information regarding gene expressions, but they also contain irrelevant fluctuations (noise) [3], which may be harmful for the performance of ML algorithms. The use of FD techniques, which convert continuous (numeric) features into discrete ones, may yield compact and adequate representations of the microarray data, with less noise [4][5]. In other words, FD aims at finding a representation of each feature that contains enough information for the learning task at hand, while ignoring minor fluctuations that may be irrelevant for the task at hand. FD methods can be supervised or unsupervised, depending on whether label information is used or not, respectively [4].
The Equal Frequency Binning (EFB) method [6], which is unsupervised, discretizes continuous features into a given number of intervals (bins), which contain approximately the same number of instances. The Unsupervised Linde-Buzo-Gray 1 (U-LBG1) method discretizes each feature into a specified number of intervals, by minimizing the Mean Squared Error (MSE) between the original and the discretized feature. The number of intervals may be decided by demanding that the MSE be lower than some threshold (Δ) or by specifying the maximum number of bits per feature (q).
The supervised Minimum Description Length Principle (MDLP) method recursively divides the feature values into multiple intervals, using an information gain minimization heuristic (entropy). Please refer to [7] for a formal description of this method and to [6][8] for additional insights on other FD approaches.

2.3. Feature Selection

In the presence of high-dimensional data, dimensionality reduction techniques [9][10] are often essential to obtain adequate representations of the data and to improve the ML models results, effectively addressing the “curse of dimensionality”. One type of dimensionality reduction technique that has been successful with microarray data is FS [9][10]. FS techniques select a subset of features from the original set by following some selection criterion. One way to perform FS is to rank the features according to their relevance, assessed by a given function, which can also be supervised (if it uses label information) or not. For microarray data, the use of FS techniques is also known as Gene Selection (GS). Some well-known methods that have been used for microarray data are the following:
  • Unsupervised methods—Laplacian Score (LS) [11], spectral (also known as SPEC) [12], and term-variance [13];
  • Supervised methods—Fisher Ratio (FiR) [14], Fast Correlation-Based Filter (FCBF) [15], Maximum Relevance Minimum Redundancy (MRMR) [16], ReliefF [17], and Relevance-Redundancy Feature Selection (RRFS) [18].
The RRFS method can also work in unsupervised mode using the mean-median (MM) relevance metric, defined, for the i-th feature, as

MM i = | X ¯ i median ( X i ) | ,

with X ¯ i denoting the mean of the i-th feature. In supervised mode, RRFS uses as relevance measure the Fisher ratio [14], also known as Fisher score, defined as (for the i-th feature) 

FiR i = X ¯ i ( 1 ) X ¯ i ( 1 ) var ( X i ) ( 1 ) + var ( X i ) ( 1 ) ,

where X ¯ i ( 1 ) , X ¯ i ( 1 ) , and var ( X i ) ( 1 ) are the sample means and variances of feature X i , for the patterns of each of the two classes (denoted as 1 and 1). This ratio measures how well each feature alone separates the two classes [14], and has been found to serve well as a relevance criterion for FS tasks. For more than two classes, FiR for feature X i is generalized [19][20] as 

FiR i = j = 1 c n j X i ¯ ( j ) X i ¯ 2 j = 1 c n j var X i ( j ) ,

where c is the number of classes, n j is the number of samples in class j, and X i ¯ ( j ) denotes the sample mean of X i considering only samples in class j; finally, X i ¯ . Among many other applications, the Fisher ratio has been used successfully with microarray data, as reported by Furey et al. [21]. When using the Fisher ratio for FS, we simply keep the top-rank features.

2.4. Classifiers

2.4.1. SVM

SMVs [22][23][24][25] follow a discriminative approach to learn a linear classifier. As is well-known, a non-linear SVM classifier can be obtained by the use of a kernel, via the so-called kernel trick [22]: since the SVM learning algorithm only uses inner products between feature vectors, these inner products can be replaced by kernel computations, which are equivalent to mapping those feature vectors into a high-dimensional (maybe non-linear) feature space. With a separable dataset, a SVM is learned by looking for the maximum-margin hyperplane (a linear model) that separates the instances according to their labels. In the non-separable case, this criterion is relaxed via the use of slack variables, which allow for the (penalized) violation of the margin constraint; for details, see [24][25]. SVMs are well suited for high-dimensional problems. Although the original SVM formulation is inherently two-class (binary), different techniques have been proposed to generalize SVM to the multi-class case, such as one-vs-rest (or “one-versus-all”) and one-vs-one [26][27].

2.4.2. DT

DT classifiers [22] also adopt a discriminative approach. A DT is a hierarchical model, in which each local region of the data is classified by a sequence of recursive splits, using a small number of partitions. The DT learning algorithm analyzes each (discrete or numeric) feature for all possible partitions and choose the one that maximizes one of the so-called impurity measures. The tree construction proceeds recursively and simultaneously for all branches that are not yet pure enough. The tree is complete when all the branches are considered pure enough, that is, when performing more splits does not improve the purity, or when the purity exceeds some threshold. There are several algorithms to learn a DT. The most popular are the Classification and Regression Trees (CART) [28], the ID3 algorithm [29] and its extension, the well-known C4.5 [30][31] algorithm. A survey of methods for constructing DT classifiers can be found in [32], which proposes a unified algorithmic framework for DT learning and describes different splitting criteria and tree pruning methods. DT are able to effectively handle high-dimensional and multi-class data.

2.5. Related Approaches

Many unsupervised and supervised FD and FS techniques have been employed on microarray data classification for cancer diagnosis [1][33][34]. Since microarray datasets are typically labeled, the use of supervised techniques is preferred, as supervised methods normally outperform unsupervised ones.
Some unsupervised FD techniques perform well when combined with some classifiers. For instance, the Equal Frequency Binning (EFB) technique followed by a Naïve Bayes (NB) classifier produces very good results [35]. It has also been reported that applying Equal Interval Binning (EIB) and EFB with microarray data, followed by SVM classifiers, yields good results [36]. It has also been shown that FS significantly improves the classification accuracy of multi-class SVM classifiers and other classification algorithms [37].
An FS filter (i.e., a FS method that is agnostic to the choice of classifier that will be subsequently used) for microarray data, based on the information-theoretic criterion named Double Input Symmetrical Relevance (DISR) was proposed by [36]. The DISR criterion is found to be competitive with existing unsupervised FS filters.
The work in [38] explores FS techniques, such as backward elimination of features, together with classification using Random Forest (RF) [39]. The authors concluded that RF has better performance than other classification methods, such as Diagonal Linear Discriminant Analysis (DLDA), K-Nearest Neighbors (KNN), and SVM. They also showed that their FS technique led to a smaller subset of features than alternative techniques, namely Nearest Shrunken Centroids (NSC) and a combination of filter and nearest neighbor classifier.
The work in [40] introduced the use of Large-scale Linear Support Vector Machine (LLSVM) and Recursive Feature Elimination with Variable Step Size (RFEVSS), improving the Recursive Feature Elimination (SVMRFE) technique. The improvement upgrades RFE with a variable step size, to reduce the number of iterations (in the initial stages in which non-relevant features are discarded, the step size is larger). The standard SVM is upgraded to a large-scale linear SVM, thus accelerating the method of assigning weights. The authors assess their approach to FS with SVM, RF, NB, KNN, and Logistic Regression (LR) classifiers. They conclude that their approach achieves comparable levels of accuracy, showing that SVM and LR outperform the other classifiers.
Recently, in the context of cancer explainability, the work in [41] considered the problem of finding a small subset of features to distinguish among six classes. The goal was to devise a set of rules based on the most relevant features that can distinguish classes based on their gene expressions. The proposed method combines a FS-based Genetic Algorithm (GA) with a fuzzy rule-based system to perform classification on a dataset with 21 instances, more than 45,000 features, and six classes. The proposed method generates ten rules, with each one addressing some specific features, making them crucial in explaining the classification results of ovarian cancer detection.
A survey of common classification techniques and related methods to increase their accuracy for microarray analysis can be found in [1][33]. The experimental evaluation is carried out in publicly available datasets. The work in [42] surveys the use of FS techniques for microarray data. For other related surveys, please see [40][43][44][45].

References

  1. Alonso-Betanzos, A.; Bolón-Canedo, V.; Morán-Fernández, L.; Sánchez-Marono, N. A Review of Microarray Datasets: Where to Find Them and Specific Characteristics. Methods Mol. Biol. 2019, 1986, 65–85.
  2. Nogueira, A.; Ferreira, A.; Figueiredo, M. A Step Towards the Explainability of Microarray Data for Cancer Diagnosis with Machine Learning Techniques. In Proceedings of the International Conference on Pattern Recognition Applications and Methods (ICPRAM), Online, 3–5 February 2022; pp. 362–369.
  3. Simon, R.; Korn, E.; McShane, L.; Radmacher, M.; Wright, G.; Zhao, Y. Design and Analysis of DNA Microarray Investigations; Springer: New York, NY, USA, 2003.
  4. Ferreira, A.; Figueiredo, M. Exploiting the bin-class histograms for feature selection on discrete data. In Proceedings of the Iberian Conference on Pattern Recognition and Image Analysis, Santiago de Compostela, Spain, 17–19 June 2015; Springer: Cham, Switzerland, 2015; pp. 345–353.
  5. Belkin, M.; Niyogi, P. Laplacian eigenmaps for dimensionality reduction and data representation. Neural Comput. 2003, 15, 1373–1396.
  6. Dougherty, J.; Kohavi, R.; Sahami, M. Supervised and unsupervised discretization of continuous features. In Machine Learning Proceedings 1995; Elsevier: Amsterdam, The Netherlands, 1995; pp. 194–202.
  7. Fayyad, U.; Irani, K. Multi-interval discretization of continuous-valued attributes for classification learning. In Proceedings of the International Joint Conference on Uncertainty in AI, Washington, DC, USA, 9–11 July 1993; pp. 1022–1027.
  8. Garcia, S.; Luengo, J.; Saez, J.; Lopez, V.; Herrera, F. A survey of discretization techniques: Taxonomy and empirical analysis in supervised learning. IEEE Trans. Knowl. Data Eng. 2013, 25, 734–750.
  9. Guyon, I.; Gunn, S.; Nikravesh, M.; Zadeh, L. Feature Extraction: Foundations and Applications; Springer: Berlin/Heidelberg, Germany, 2006.
  10. Alpaydin, E. Introduction to Machine Learning, 3rd ed.; The MIT Press: Cambridge, MA, USA, 2014.
  11. He, X.; Cai, D.; Niyogi, P. Laplacian score for feature selection. In Proceedings of the Advances in Neural Information Processing Systems, Vancouver, BC, Canada, 5–8 December 2005; MIT Press: Cambridge, MA, USA; Volume 18, pp. 507–514.
  12. Zhao, Z.; Liu, H. Spectral feature selection for supervised and unsupervised learning. In Proceedings of the 24th International Conference on Machine Learning, Corvallis, OR, USA, 20–24 June 2007; pp. 1151–1157.
  13. Liu, L.; Kang, J.; Yu, J.; Wang, Z. A comparative study on unsupervised feature selection methods for text clustering. In Proceedings of the 2005 International Conference on Natural Language Processing and Knowledge Engineering, Wuhan, China, 30 October–1 November 2005; IEEE: Piscataway, NJ, USA, 2005; pp. 597–601.
  14. Fisher, R. The use of multiple measurements in taxonomic problems. Ann. Eugen. 1936, 7, 179–188.
  15. Yu, L.; Liu, H. Feature selection for high-dimensional data: A fast correlation-based filter solution. In Proceedings of the International Conference on Machine Learning (ICML), Washington, DC, USA, 21–24 August 2003; pp. 856–863.
  16. Peng, H.; Long, F.; Ding, C. Feature selection based on mutual information: Criteria of max-dependency, max-relevance, and min-redundancy. IEEE Trans. Pattern Anal. Mach. Intell. (PAMI) 2005, 27, 1226–1238.
  17. Kononenko, I. Estimating attributes: Analysis and extensions of RELIEF. In Proceedings of the European Conference on Machine Learning, Catania, Italy, 6–8 April 1994; Springer: Berlin/Heidelberg, Germany, 1994; pp. 171–182.
  18. Ferreira, A.; Figueiredo, M. Efficient feature selection filters for high-dimensional data. Pattern Recognit. Lett. 2012, 33, 1794–1804.
  19. Duda, R.; Hart, P.; Stork, D. Pattern Classification, 2nd ed.; John Wiley & Sons: Hoboken, NJ, USA, 2001.
  20. Zhao, Z.; Morstatter, F.; Sharma, S.; Alelyani, S.; Anand, A.; Liu, H. Advancing Feature Selection Research—ASU Feature Selection Repository; Technical Report; Computer Science & Engineering, Arizona State University: Tempe, AZ, USA, 2010.
  21. Furey, T.; Cristianini, N.; Duffy, N.; Bednarski, D.; Schummer, M.; Haussler, D. Support vector machine classification and validation of cancer tissue samples using microarray expression data. Bioinformatics 2000, 16, 906–914.
  22. Alpaydin, E. Introduction to Machine Learning, 2nd ed.; The MIT Press: Cambridge, MA, USA, 2010.
  23. Boser, B.; Guyon, I.; Vapnik, V. A training algorithm for optimal margin classifiers. In Proceedings of the Annual ACM Workshop on Computational Learning Theory, Pittsburgh, PA, USA, 27–29 July 1992; ACM Press: New York, NY, USA, 1992; pp. 144–152.
  24. Burges, C. A tutorial on support vector machines for pattern recognition. Data Min. Knowl. Discov. 1998, 2, 121–167.
  25. Vapnik, V. The Nature of Statistical Learning Theory; Springe: New York, NY, USA, 1999.
  26. Hsu, C.; Lin, C. A comparison of methods for multi-class support vector machines. IEEE Trans. Neural Netw. 2002, 13, 415–425.
  27. Weston, J.; Watkins, C. Multi-Class Support Vector Machines; Technical Report; Department of Computer Science, Royal Holloway, University of London: London, UK, 1998.
  28. Breiman, L. Classification and Regression Trees, 1st ed.; Chapman & Hall/CRC: Boca Raton, FL, USA, 1984.
  29. Quinlan, J. Induction of decision trees. Mach. Learn. 1986, 1, 81–106.
  30. Quinlan, J. C4.5: Programs for Machine Learning; Morgan Kaufmann: San Mateo, CA, USA, 1993.
  31. Quinlan, J. Bagging, boosting, and C4.5. In Proceedings of the National Conference on Artificial Intelligence, Portland, OR, USA, 4–8 August 1996; AAAI Press: Washington, DA, USA, 1996; pp. 725–730.
  32. Rokach, L.; Maimon, O. Top-down induction of decision trees classifiers—A survey. IEEE Trans. Syst. Man, Cybern. Part C Appl. Rev. 2005, 35, 476–487.
  33. Yip, W.; Amin, S.; Li, C. A Survey of Classification Techniques for Microarray Data Analysis. In Handbook of Statistical Bioinformatics; Springer: Berlin/Heidelberg, Germany, 2011; pp. 193–223.
  34. Statnikov, A.; Tsamardinos, I.; Dosbayev, Y.; Aliferis, C. GEMS: A system for automated cancer diagnosis and biomarker discovery from microarray gene expression data. Int. J. Med. Inform. 2005, 74, 491–503.
  35. Witten, I.; Frank, E.; Hall, M.; Pal, C. Data Mining: Practical Machine Learning Tools and Techniques, 4th ed.; Morgan Kauffmann: Mateo, CA, USA, 2016.
  36. Meyer, P.; Schretter, C.; Bontempi, G. Information-theoretic feature selection in microarray data using variable complementarity. IEEE J. Sel. Top. Signal Process. 2008, 2, 261–274.
  37. Statnikov, A.; Aliferis, C.; Tsamardinos, I.; Hardin, D.; Levy, S. A comprehensive evaluation of multicategory classification methods for microarray gene expression cancer diagnosis. Bioinformatics 2005, 21, 631–643.
  38. Diaz-Uriarte, R.; Andres, S. Gene selection and classification of microarray data using random forest. BMC Bioinform. 2006, 7, 3.
  39. Breiman, L. Random forests. Mach. Learn. 2001, 45, 5–32.
  40. Li, Z.; Xie, W.; Liu, T. Efficient feature selection and classification for microarray data. PLoS ONE 2018, 13, 0202167.
  41. Consiglio, A.; Casalino, G.; Castellano, G.; Grillo, G.; Perlino, E.; Vessio, G.; Licciulli, F. Explaining Ovarian Cancer Gene Expression Profiles with Fuzzy Rules and Genetic Algorithms. Electronics 2021, 10, 375.
  42. Saeys, Y.; Inza, I.; naga, P.L. A review of feature selection techniques in bioinformatics. Bioinformatics 2007, 23, 2507–2517.
  43. AbdElNabi, M.L.R.; Wajeeh Jasim, M.; El-Bakry, H.M.; Hamed, N.; Taha, M.; Khalifa, N.E.M. Breast and Colon Cancer Classification from Gene Expression Profiles Using Data Mining Techniques. Symmetry 2020, 12, 408.
  44. Alonso-González, C.J.; Moro-Sancho, Q.I.; Simon-Hurtado, A.; Varela-Arrabal, R. Microarray gene expression classification with few genes: Criteria to combine attribute selection and classification methods. Expert Syst. Appl. 2012, 39, 7270–7280.
  45. Jirapech-Umpai, T.; Aitken, S. Feature selection and classification for microarray data analysis: Evolutionary methods for identifying predictive genes. BMC Bioinform. 2005, 6, 148.
More
Information
Contributors MDPI registered users' name will be linked to their SciProfiles pages. To register with us, please refer to https://encyclopedia.pub/register : , ,
View Times: 280
Revisions: 2 times (View History)
Update Date: 24 Oct 2023
1000/1000