Russia and the EU represent two economic blocs with high-value bilateral trade, especially in several specific sectors. The Russia–Ukraine war has facilitated the escalation of protectionism against Russia, and the EU and Western partners have introduced a set of sanctions on the import of goods from Russia, but also on EU exports to Russia. Russia is a resource-rich country whose exports are mainly based on resources and resource-related products. Therefore, forward participation in global value chains dominates, being 4.5 times higher than backward participation. In the EU and its member states, backward participation dominates, implying a high level of dependence of the production process in the EU on import of intermediates from abroad.
1. Introduction
The development of global value chains (GVCs) was facilitated by the process of trade liberalization, higher level of openness to foreign investment and the widening of MNC activities and businesses. The process seemed to be endless until the 2010s when internationalization faced stagnation with a slowdown and oscillation in global trade and investment growth. The setback was aggravated by the COVID-19 pandemic in 2020 and 2021, followed by the Russia–Ukraine war (beginning in 2022)
[1][2][3][4][5][6][7][8].
In normal circumstances, the production process that depends on foreign inputs and/or produces intermediates for foreign partners is well established and takes place without any difficulties or delays. The COVID-19 pandemic temporarily closed borders and prevented the transport of goods between (and even within) countries. GVC activities slowed down, and the new challenges brought to light some new solutions for their future development. The nearshoring strategy, resilience and management of GVCs have been the most important issues in the last few years.
The situation was further complicated by the war between Russia and Ukraine which disrupted GVCs between the EU and those countries. Several key points need to be considered and discussed. The EU and its Western partners have imposed trade restrictions on imports from Russia to prevent it from continuing the aggression (by reducing its earnings). This includes 10 packages that cover a large scope of products. These new protectionist measures are numerous and cover most of the trade. On the other hand, the EU is heavily dependent on energy imports from Russia. The EU imports over a third of its gas from Russia, making it the largest single supplier of gas. Russia and the EU also have close ties in oil trading, with Russia supplying crude oil to several EU countries. The energy relationship between the EU and Russia has been impacted by political tensions in recent years, and the EU has been trying to diversify its energy sources by reducing its dependence on Russia. By imposing trade bans, the EU planned to reduce its reliance on Russian gas by two-thirds by the end of 2022 as well as becoming independent of Russian fossil fuels by 2030 (
European Council 2023).
After the escalation of protectionist measures, trade between the EU and Russia has changed in size and pattern. The value of imports from Russia fell by 82% from February 2022 to March 2023 (
Eurostat 2023). The Russian share in the EU’s extra-EU imports fell from 9.5 to 4.3% (between February and December 2023) and the Russian share in the EU’s extra-EU exports dropped from 4 to 2%.
The aim of this research is to analyse Russian involvement in the GVCs and the importance of the EU for production chains in Russia, and the importance of Russia for production chains in the EU.
The area that remains uncovered or underexplored in published research is the EU–Russia interdependence in terms of participation in global value chains, i.e., the relevance of inputs from Russia for the production process in the EU and vice versa.
2. Trade Relations between the EU and Russia
Russia was EU’s fifth-largest trade partner for extra-EU exports and third for extra-EU imports. However, the situation has significantly changed since February 2022. i.e., Russia’s share in extra-EU exports fell from 4.0% in February 2022 to 1.8% in March 2023 and the share of extra-EU imports from Russia fell from 9.5% to 1.9%. EU had a deficit in trade with Russia (Figure 1) during the decade of 2013–2022, being at its lowest in 2020 (EUR 16 bn) and increasing in 2022 (EUR 148 bn) due to the sharp energy-price increase.
Russia was one of the EU’s most important suppliers of coal, gas and especially oil, i.e., almost half of the EU fuel imports and three-quarters of its crude oil imports came from Russia in 2020
[4]. In 2021, the EU imported energy from Russia at a value of EUR 99 bn (representing 62% of EU imports from Russia), but this had a decreasing trend (i.e., in 2012, imports were EUR 157 bn)
[5]. In the first quarter of 2023, in comparison with the same period of 2021, the share of Russia in imports of specific products sharply declined—the highest drop was recorded for coal, from 45% in 2022 to almost zero in 2023; there were also drops for petroleum oil (−25 percentage points, pp), fertilizers (−23 pp), nickel (−20 pp), natural gas (−16 pp) and iron & steel (−8 pp)
[3].
The trade policy between the EU and Russia was determined by the Partnership and Cooperation Agreement between the EU and Russia that was in force from 2012. The economic relations between Russia and the EU were hindered by the restrictions from 2014 (Russian annexation of Crimea), worsening after the Russia–Ukraine war started in 2022.
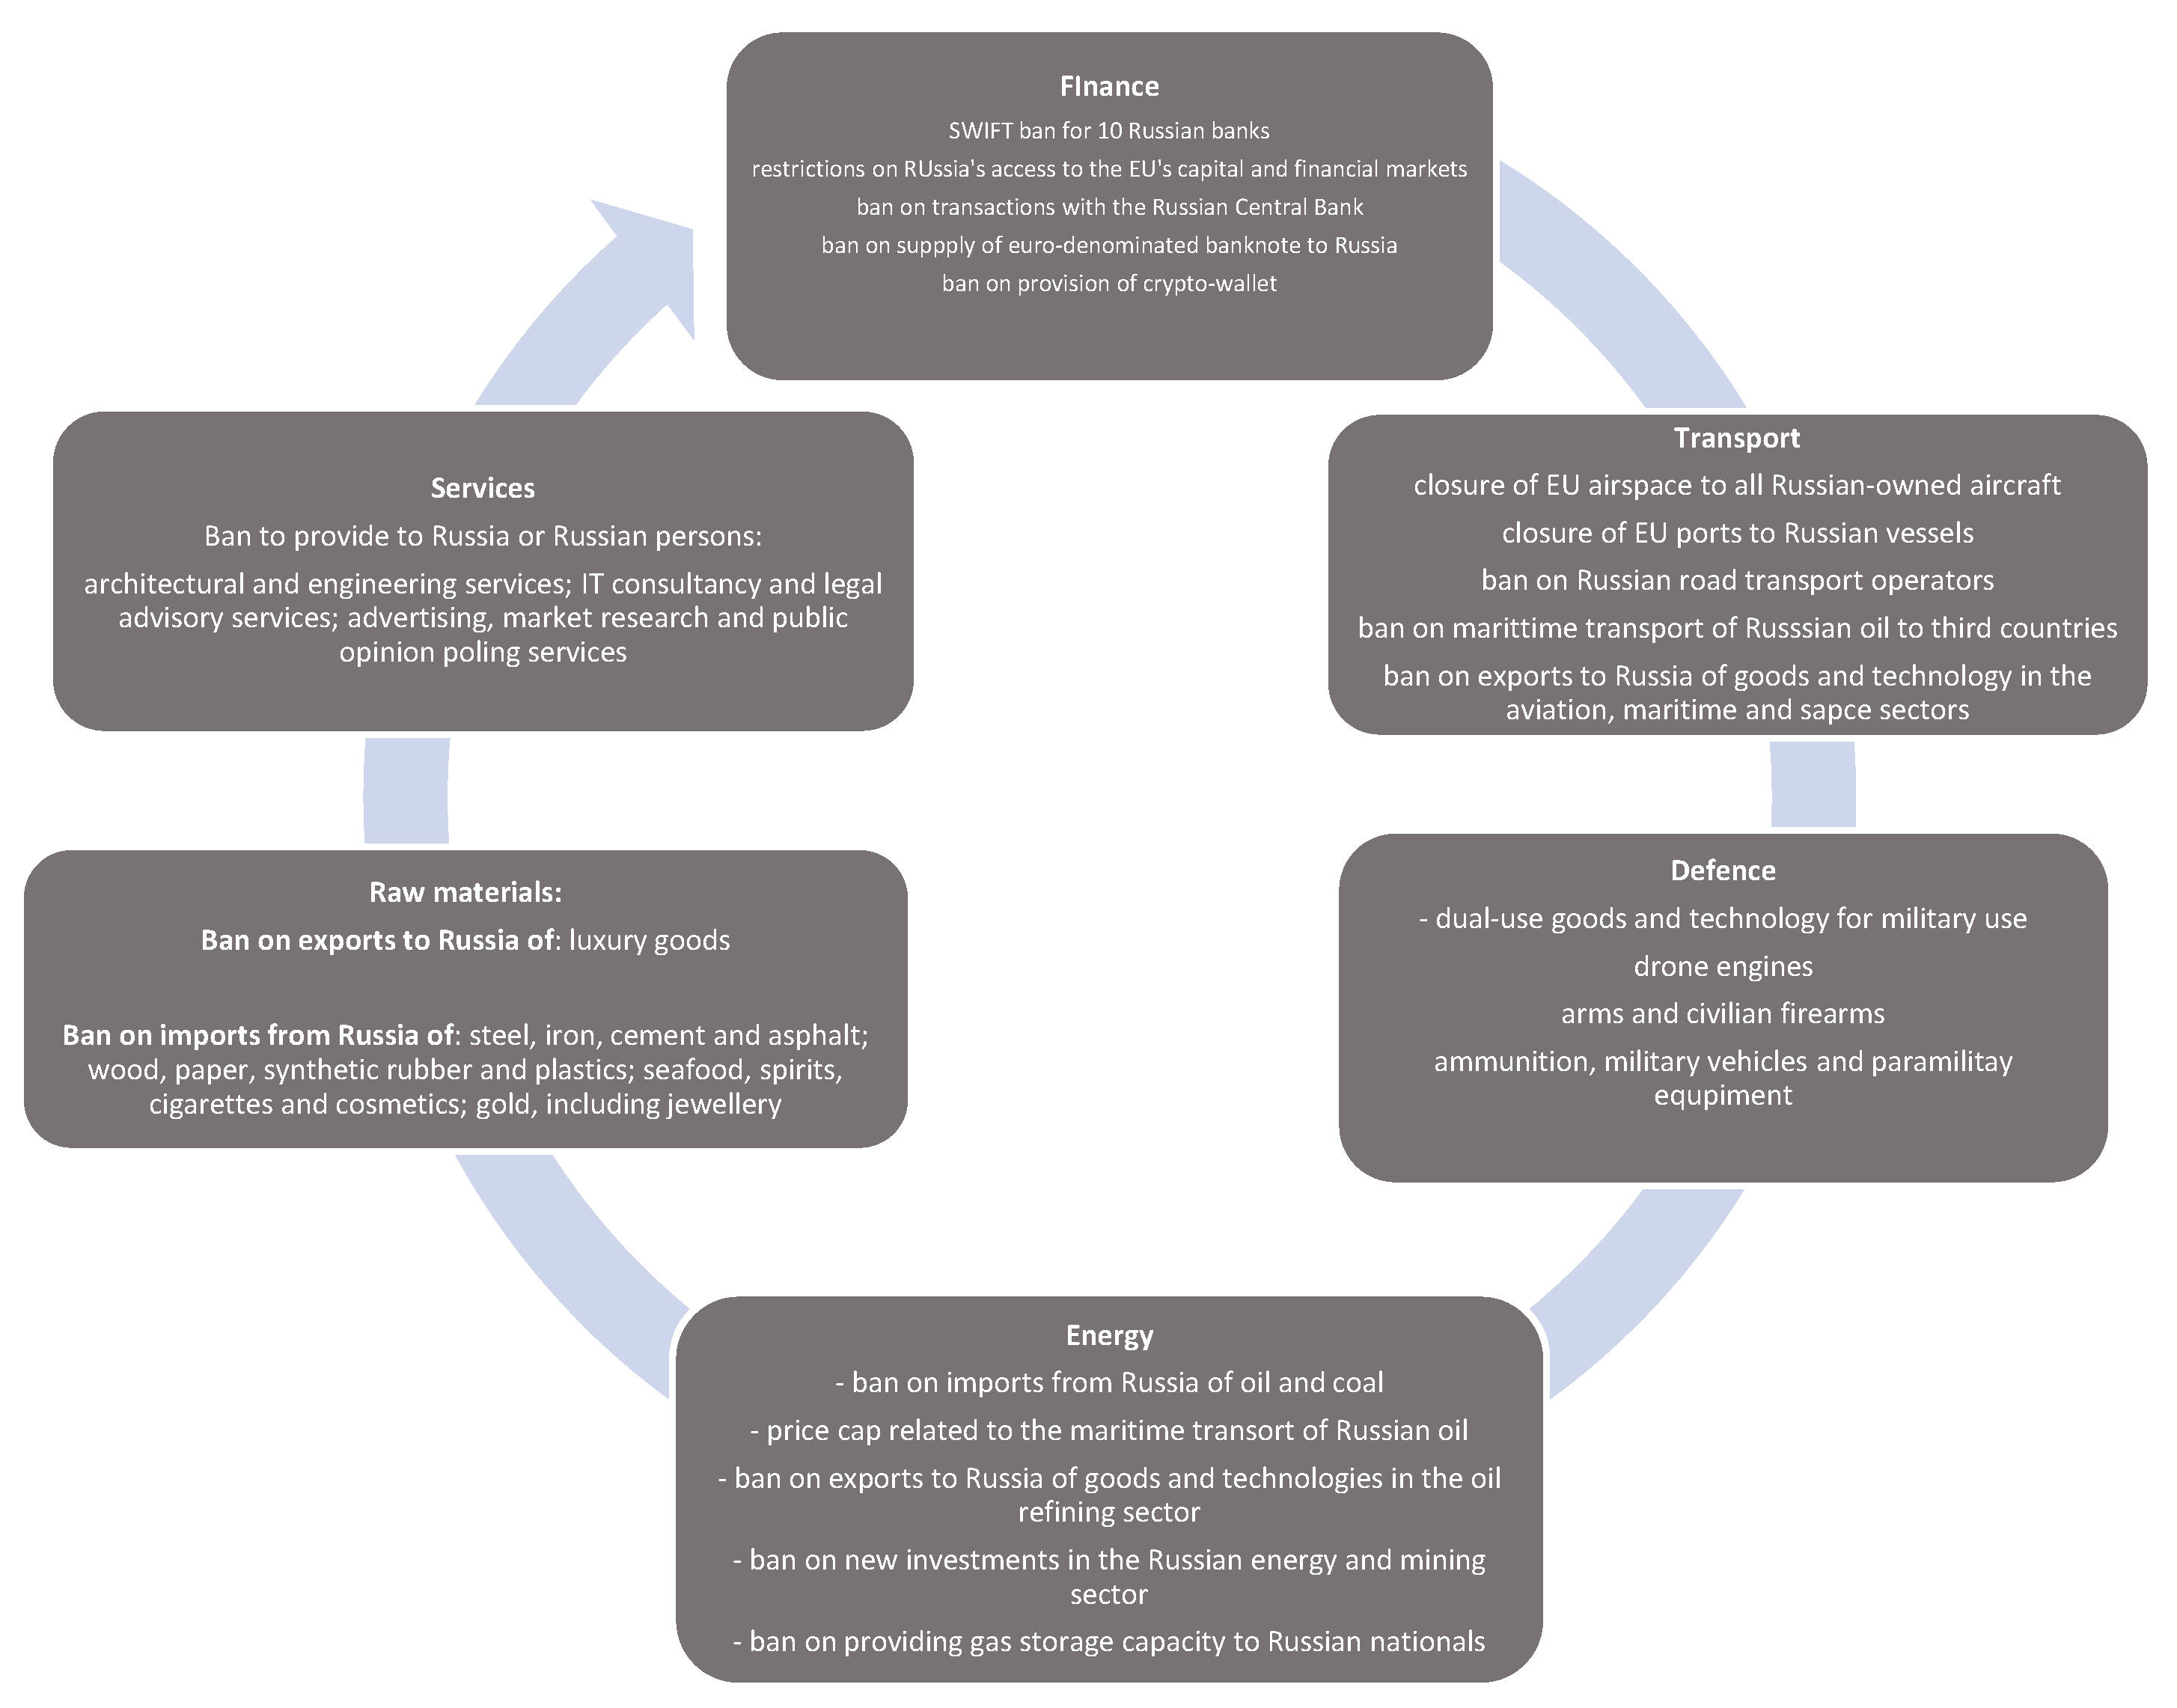
Since the beginning of the Russian invasion on Ukraine (February 2022), the European Commission has applied trade restriction measures in the form of import and export bans on two countries (Russia and Belarus) under the common foreign and security policy (Figure 2). In September 2022, Russia cut off most of the natural gas flows to Europe, Russia’s largest customer. On the other hand, the EU imposed a ban on most Russian oil imports, as well as a price cap on Russian oil.
Figure 2. EU’s economic sanctions against Russia, February 2022–June 2023. Source:
European Council (
2023).
A detailed list of implemented measures within a time framework is provided by the
European Council (
2023) and in
Table 1.
Table 1. EU sanctions against Russia—values and coverage (after the 10th package of sanctions).
Euronews (
2023) warns that key Russian products such as gas, uranium and diamonds have remained intact. The latest measures (early 2023) included the price cap for petroleum products: traded at a discount to crude oil, it is set at USD 45 per barrel; traded at a premium to crude, it is set at USD 100 per barrel (
European Council 2023).
3. Research
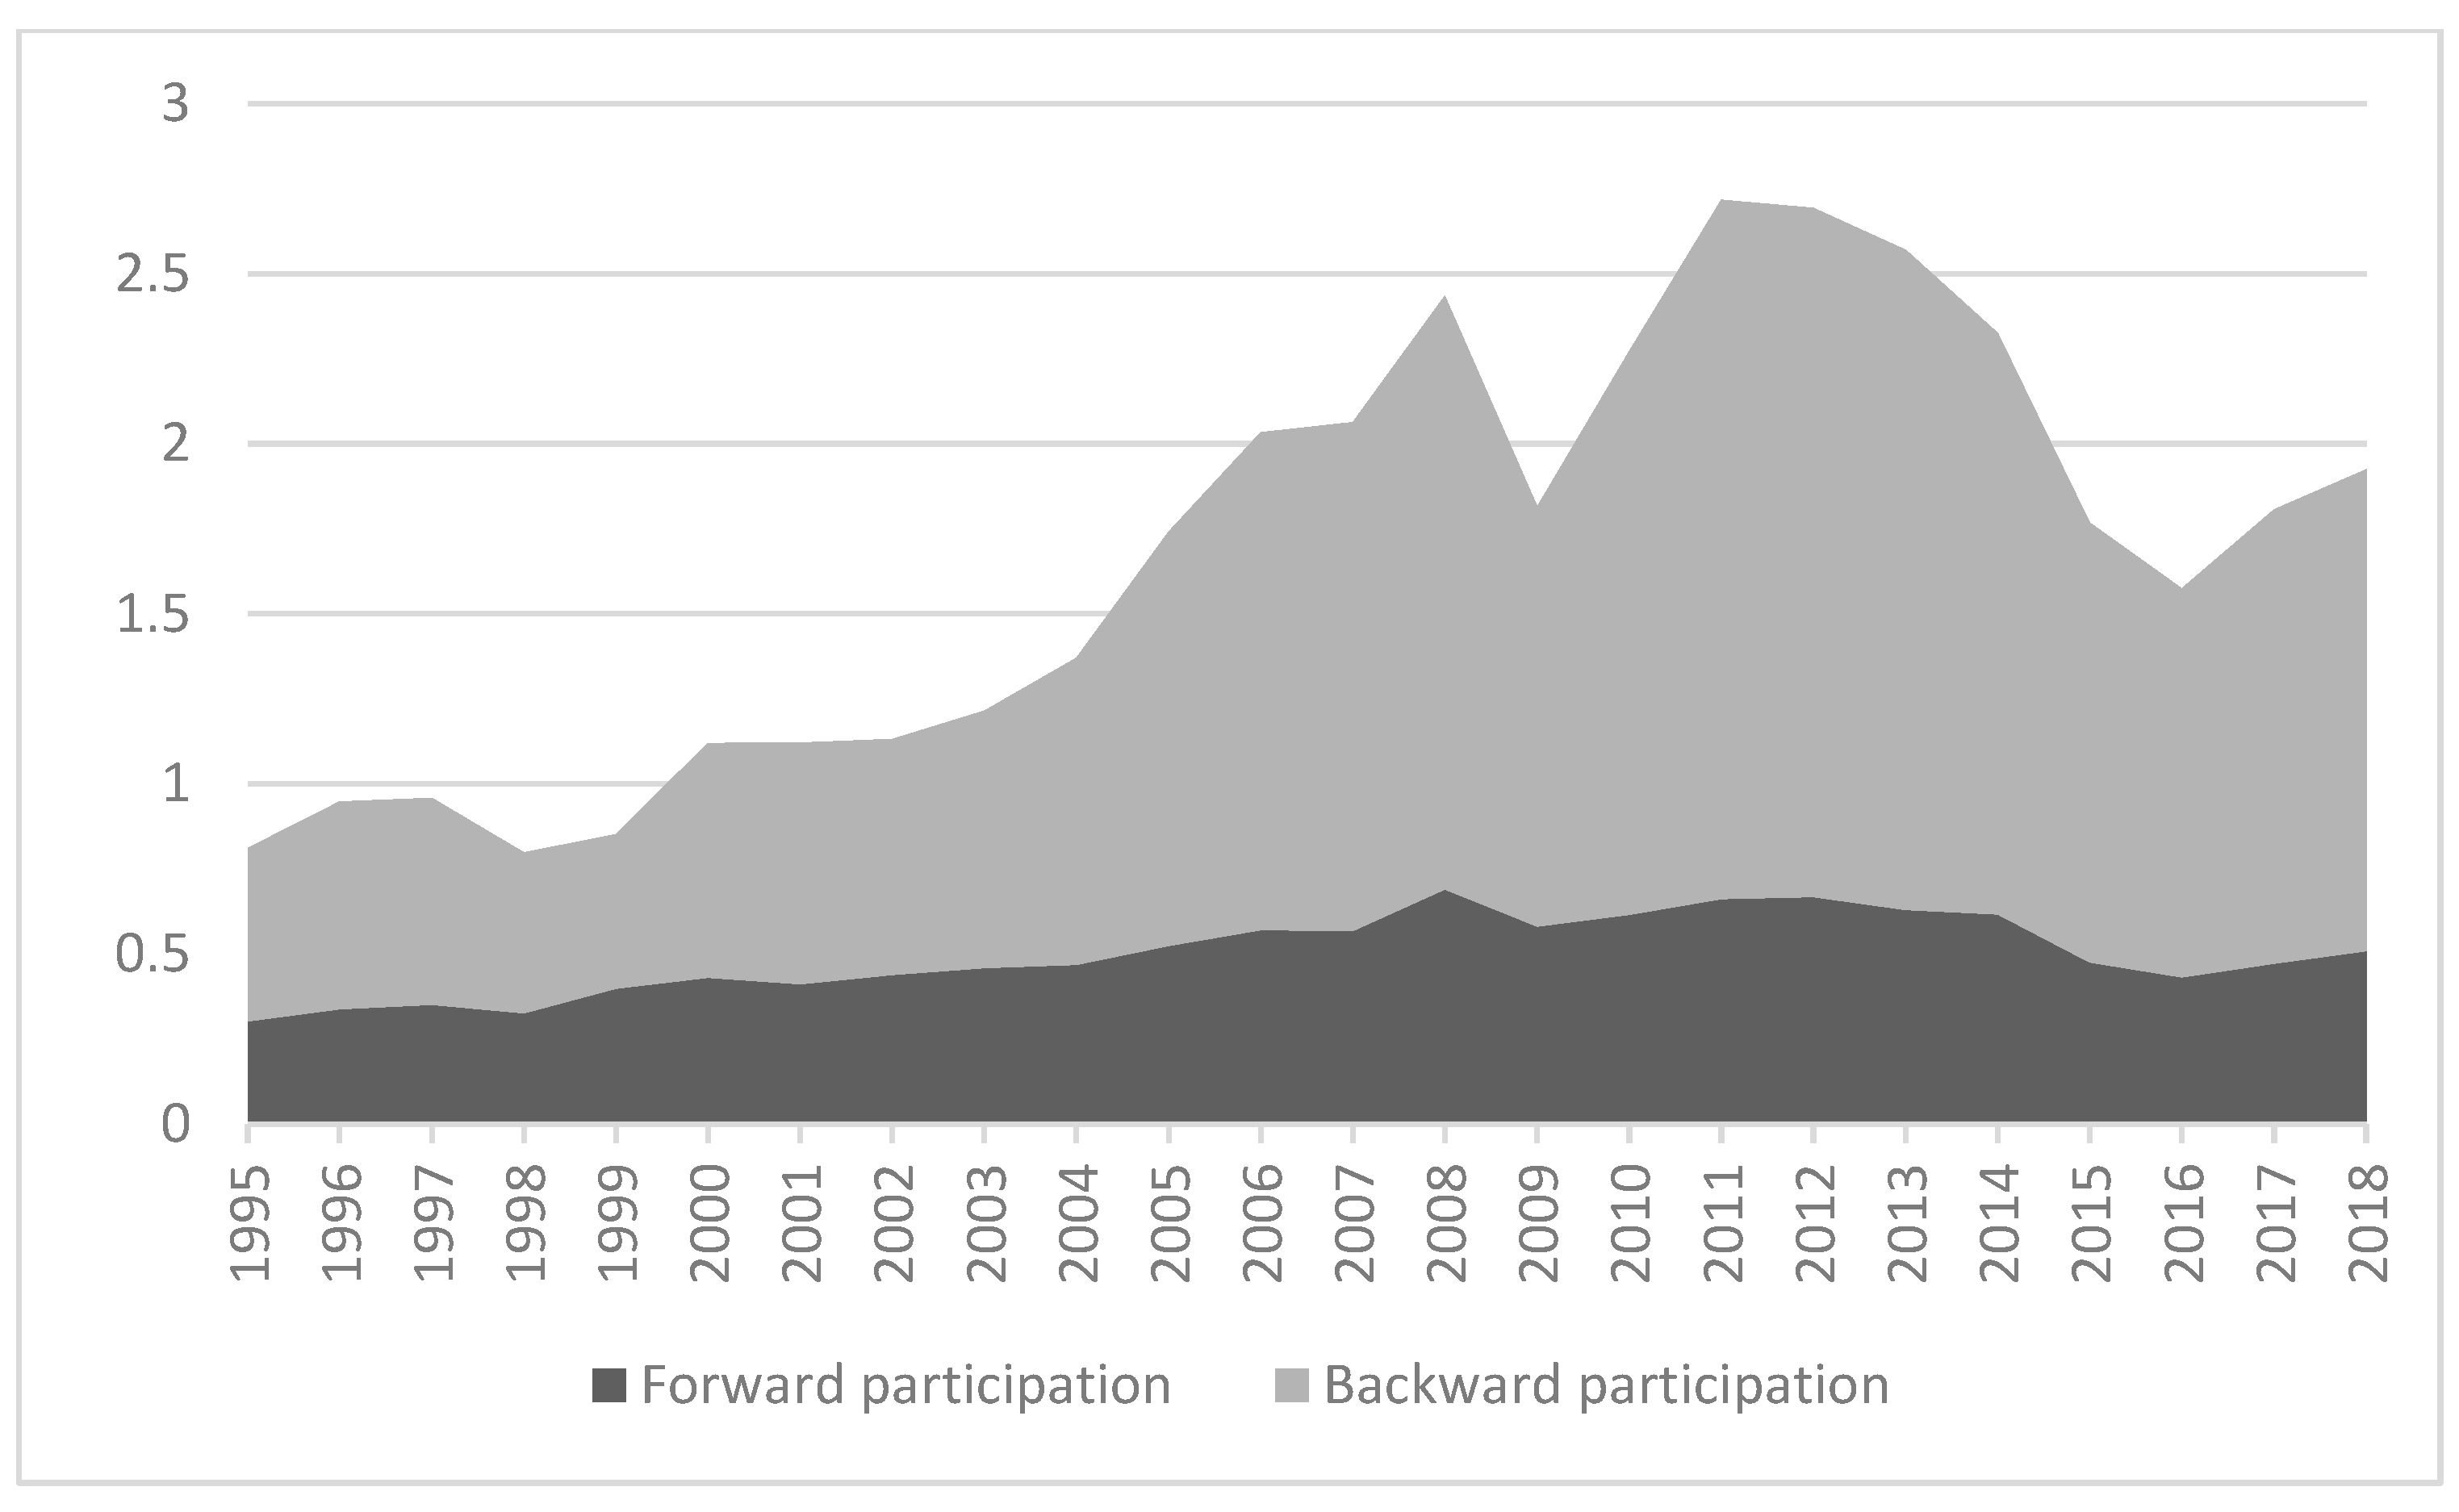
To evaluate the countries’/sectors’ participation in GVCs, it is necessary to distinguish between domestic value added, contained in the export of a particular country/sector, and the foreign value added (FVA) share of the export. GVC participation is measured by backward (share of foreign value added in exports) and forward linkages (the share of domestic value added in foreign exports). The sum of backward and forward participations equals the participation of a country/sector in the GVC (Koopman et al. 2010)
According to Figure 3, forward participation dominated in Russia: it increased from 24% to 37% (in 2007), after which it varied from 32.6 to 37.1%. Forward participation for the EU27 is at the level of 15%. Since the EU27 covers only non-EU trade, it is important to provide a detailed analysis of the participation of EU member states in GVCs.
Figure 3. Forward participation in GVCs from 1995 to 2018 (partner–world). Source:
OECD (
2021).
If the researchers focus the analysis on GVC linkages only between the EU and Russia, the results can be shown in Figures 4 and 5.
Figure 4. GVC participation of the EU—partner Russia. Source:
OECD (
2021).
Figure 5. GVC participation of Russia - partner EU27. Source:
OECD (
2021).
4. Conclusion
The comparison of GVC participation of the EU and Russia highlighted the differences between them, which have arisen from the specificities of their economic structures. Russia is a resource-rich country whose exports are mainly based on resources and resource-related products. Therefore, forward participation in global value chains dominates. In the EU and its member states, backward participation dominates, implying a high dependence of the production process in the EU on import of intermediates (i.e., production inputs) from abroad. In last 20 years, the EU has increased (almost doubled) its backward participation in GVCs while its forward participation stagnated by around 15%. At the same time, Russia has slightly decreased its backward participation but significantly increased its forward participation. The sectoral analysis indicates a high share of value added from Russia in the sector “mining and quarrying, energy producing products” in the EU final demand. The opposite is true for the sectors “electricity, gas, steam and air conditioning supply” and “transport equipment”. There are also sectors in Russia, such as electrical equipment, pharmaceuticals, chemical products and construction, that depend on a high share of EU value added. It is certainly important to highlight the process of green transition in the EU. Russia is only partially isolated and the impact of sanctions on its economy and trade will be partial because it has successfully turned to co-operation with countries that did not impose sanctions, primarily China, so it is expected that this will intensify trade with partner countries and also create value chains with producers from those countries.
 +1 credit