Russia and the EU represent two economic blocs with high-value bilateral trade, especially in several specific sectors. The Russia–Ukraine war has facilitated the escalation of protectionism against Russia, and the EU and Western partners have introduced a set of sanctions on the import of goods from Russia, but also on EU exports to Russia. Russia is a resource-rich country whose exports are mainly based on resources and resource-related products. Therefore, forward participation in global value chains dominates, being 4.5 times higher than backward participation. In the EU and its member states, backward participation dominates, implying a high level of dependence of the production process in the EU on import of intermediates from abroad.
- global value chains
- trade
- EU
- Russia
[1][2]1. Introduction
production chains in the EU.
2. Trade Relations between the EU and Russia
Russia was EU’s fifth-largest trade partner for extra-EU exports and third for extra-EU imports. However, the situation has significantly changed since February 2022. i.e., Russia’s share in extra-EU exports fell from 4.0% in February 2022 to 1.8% in March 2023 and the share of extra-EU imports from Russia fell from 9.5% to 1.9%. EU had a deficit in trade with Russia (Figure 1) during the decade of 2013–2022, being at its lowest in 2020 (EUR 16 bn) and increasing in 2022 (EUR 148 bn) due to the sharp energy-price increase.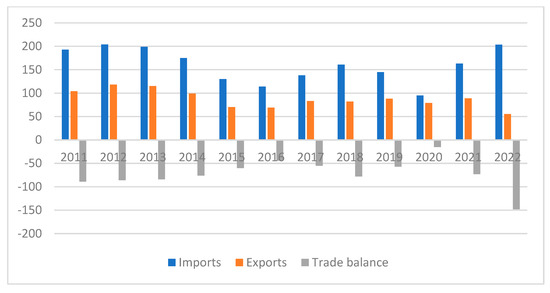
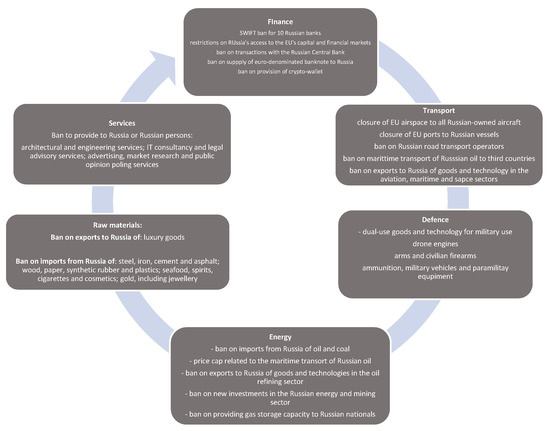
| Bans on Import from Russia | Bans on Export to Russia | |
|---|---|---|
| Value in EUR bn | 91.2 | 43.9 |
| Share of total (%) | 58 | 49 |
| Products | Oil, coal, gold, steel, cement, rubber, vodka and caviar | Microchips, drones, trucks, chemicals, radio systems and banknotes |
| Prohibition of export of luxury products worth more than EUR 300 each |
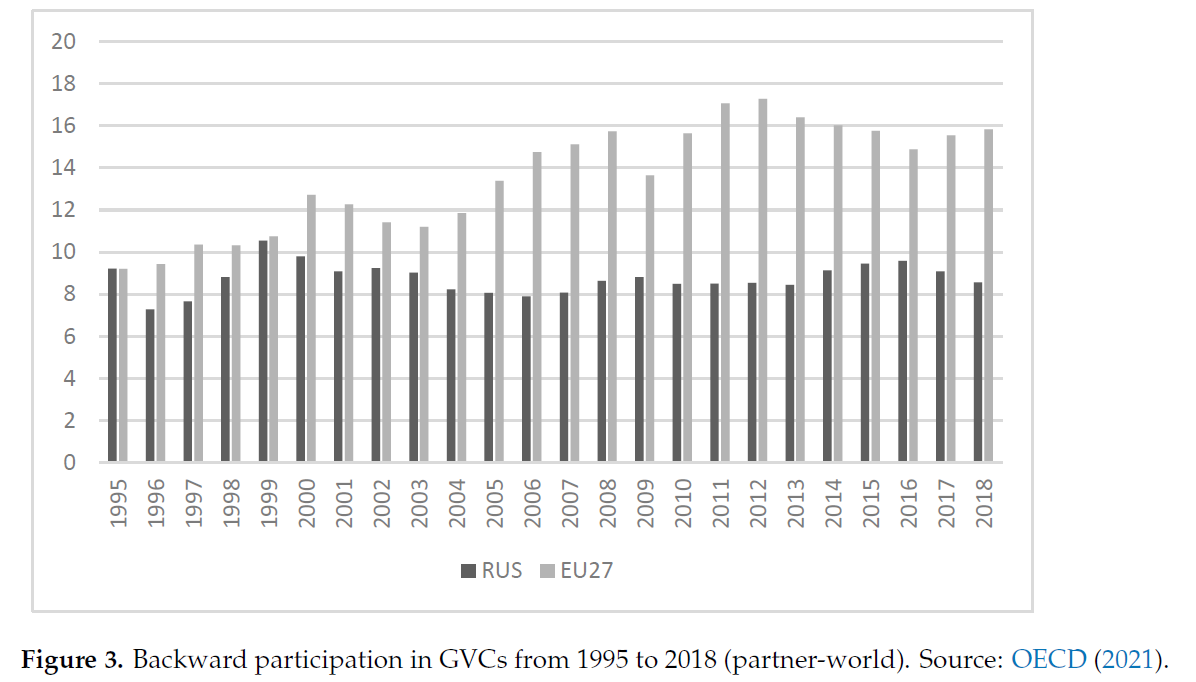
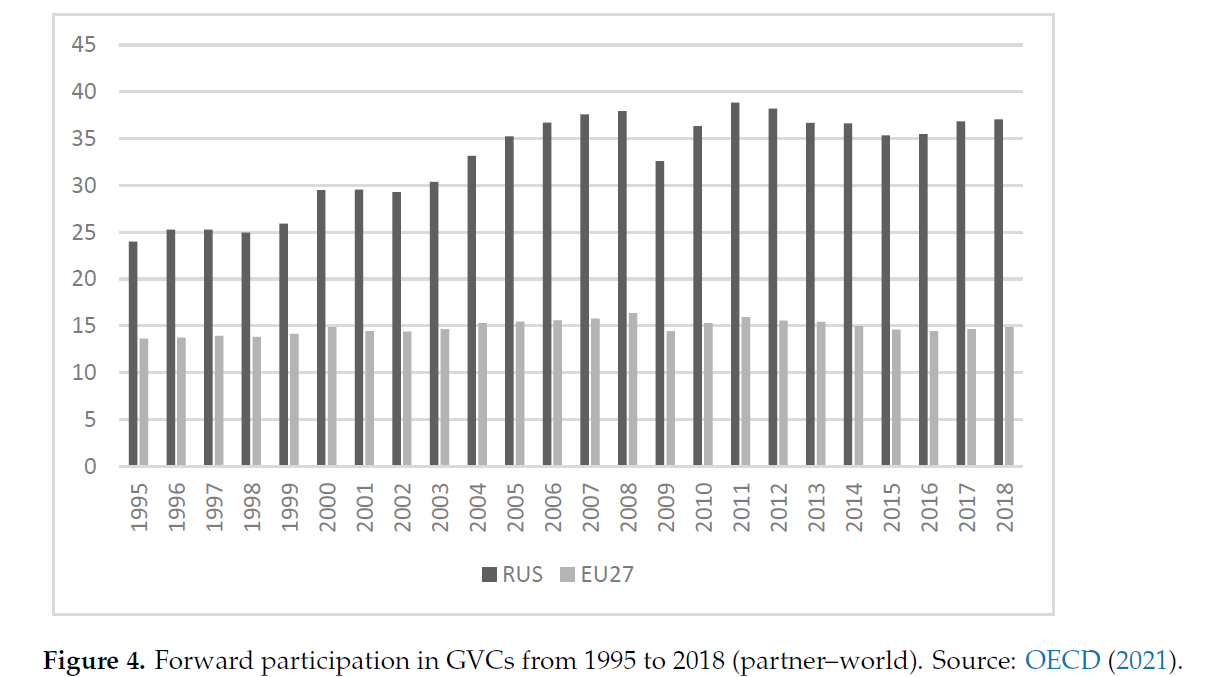
between domestic value added, contained in the export of a particular country/sector,
and the foreign value added (FVA) share of the export. GVC participation is measured
by backward (share of foreign value added in exports) and forward linkages (the share of
domestic value added in foreign exports). The sum of backward and forward participations
equals the participation of a country/sector in the GVC (Koopman et al. 2010) According to Figure 3Figure 4, forward participation dominated in Russia: it increased from
24% to 37% (in 2007), after which it varied from 32.6 to 37.1%. Forward participation for
the EU27 is at the level of 15%. Since the EU27 covers only non-EU trade, it is important to
provide a detailed analysis of the participation of EU member states in GVCs.

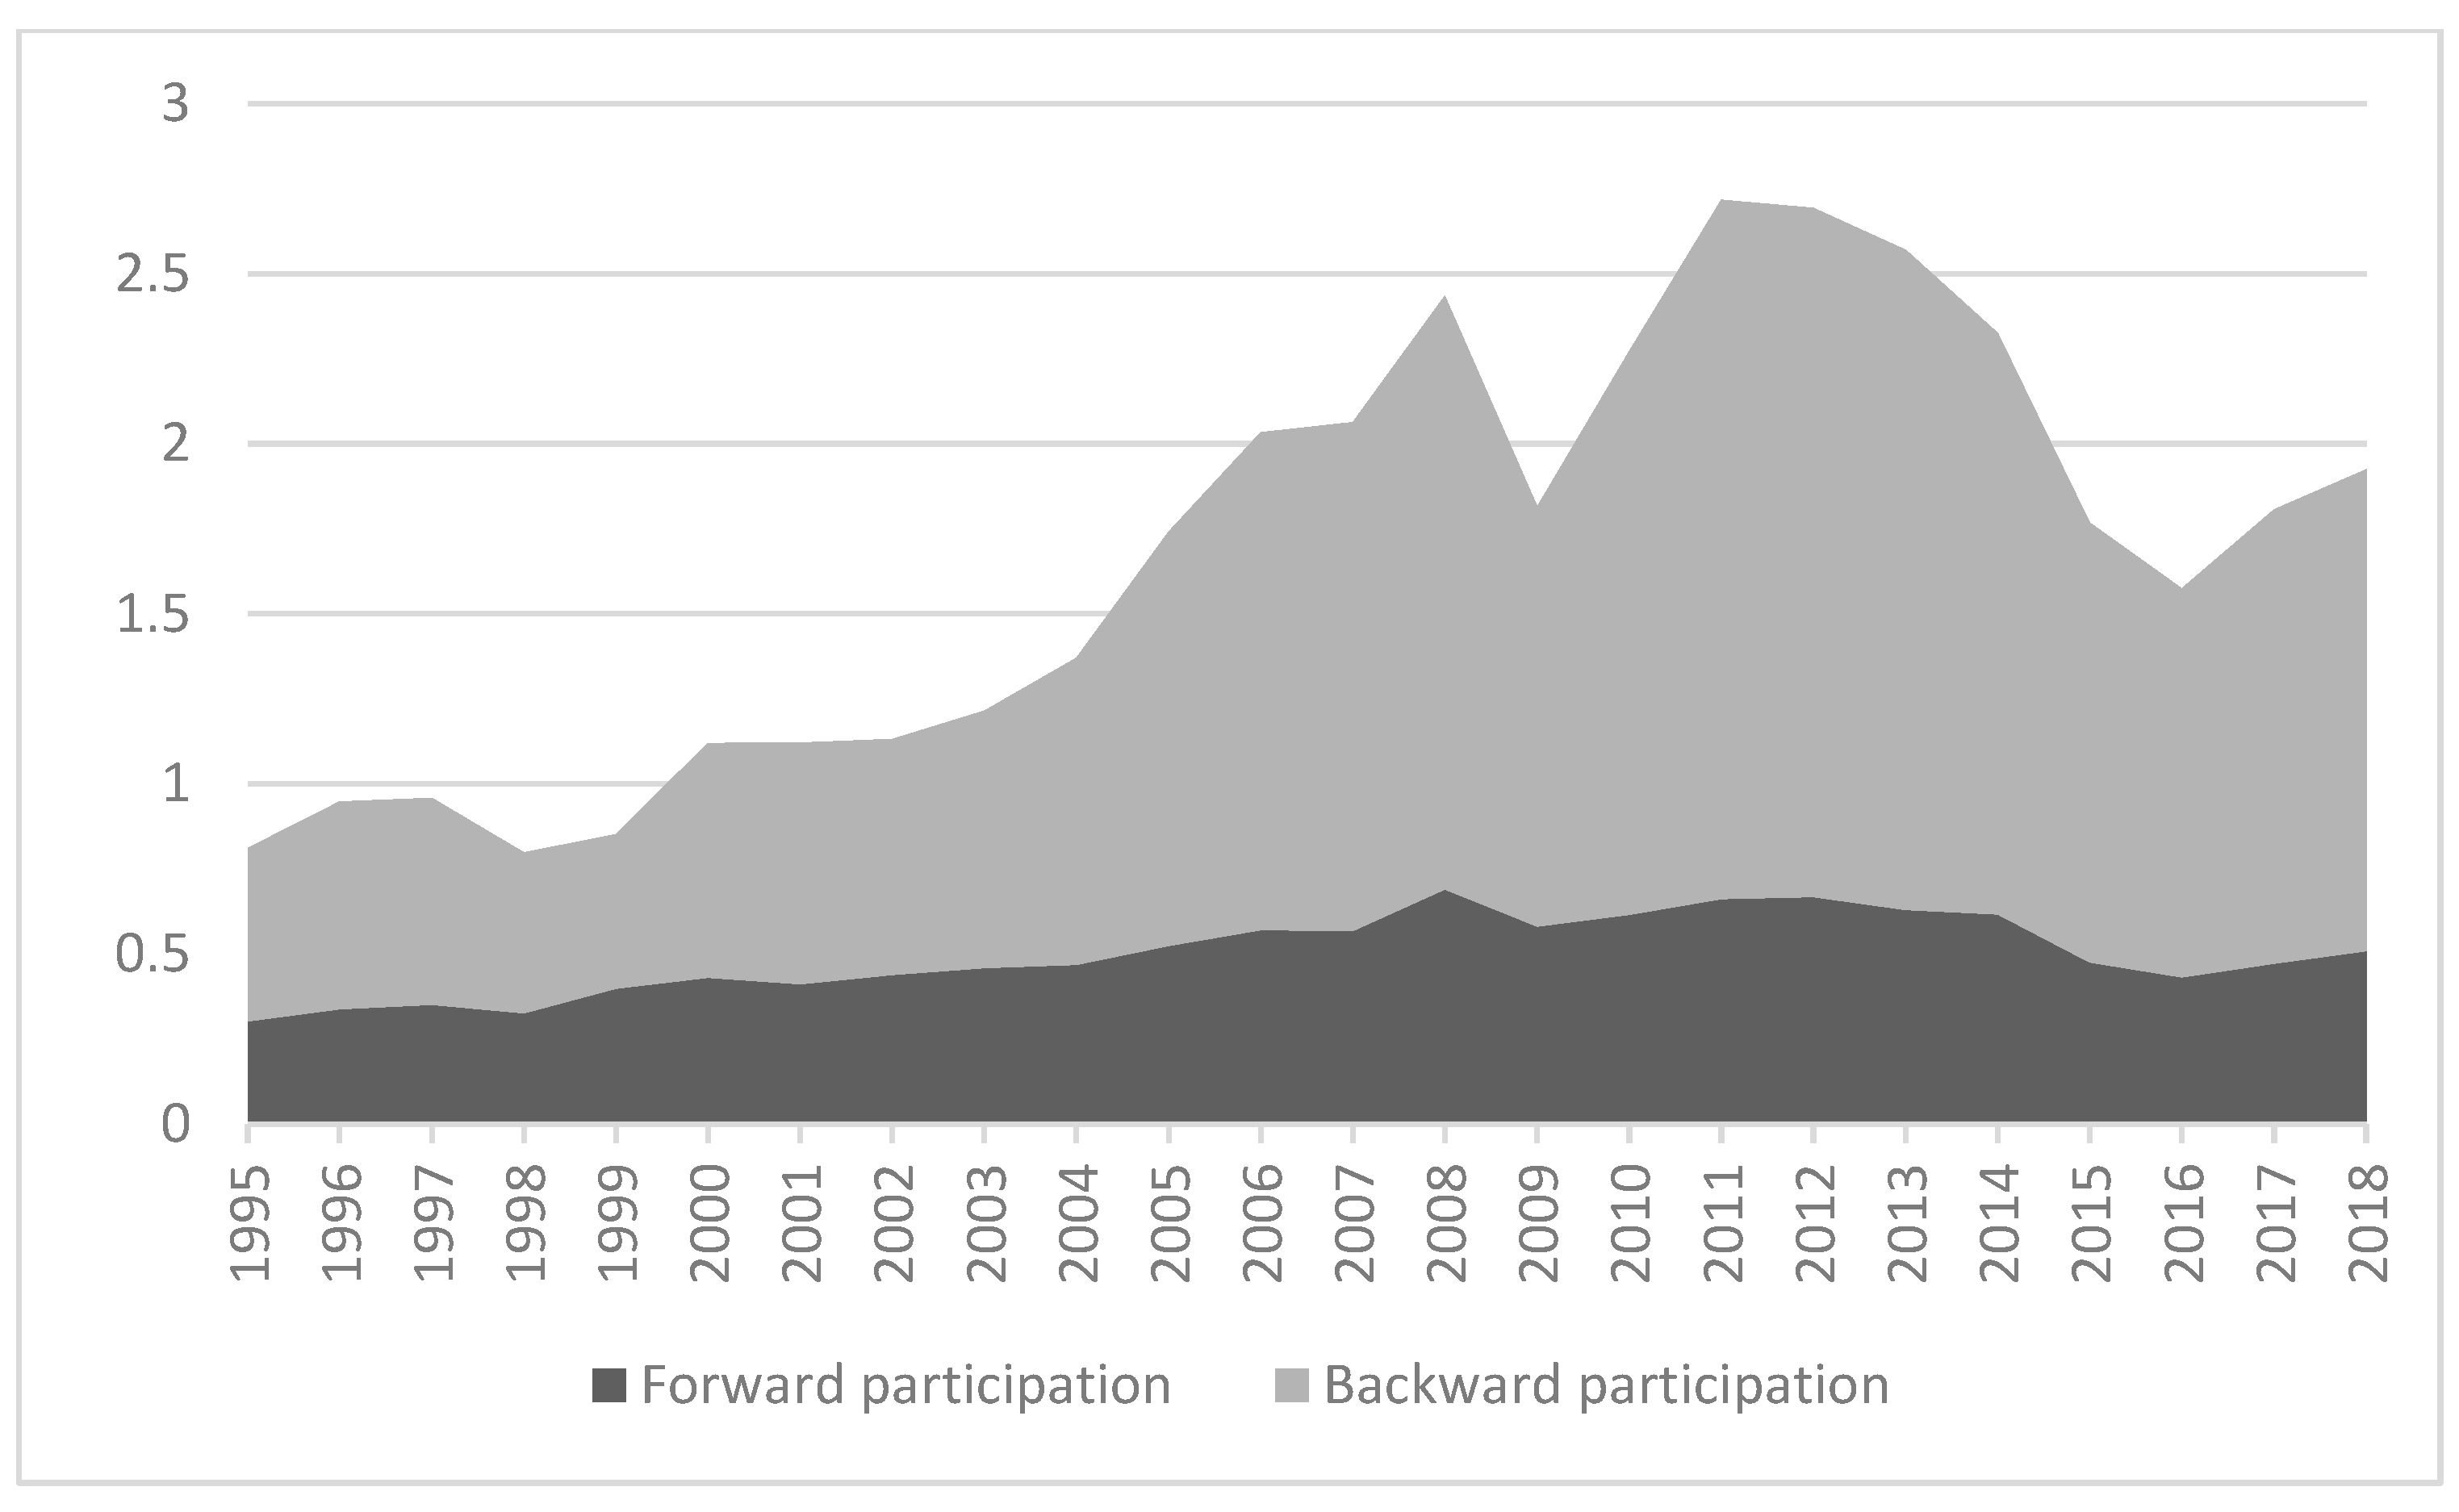
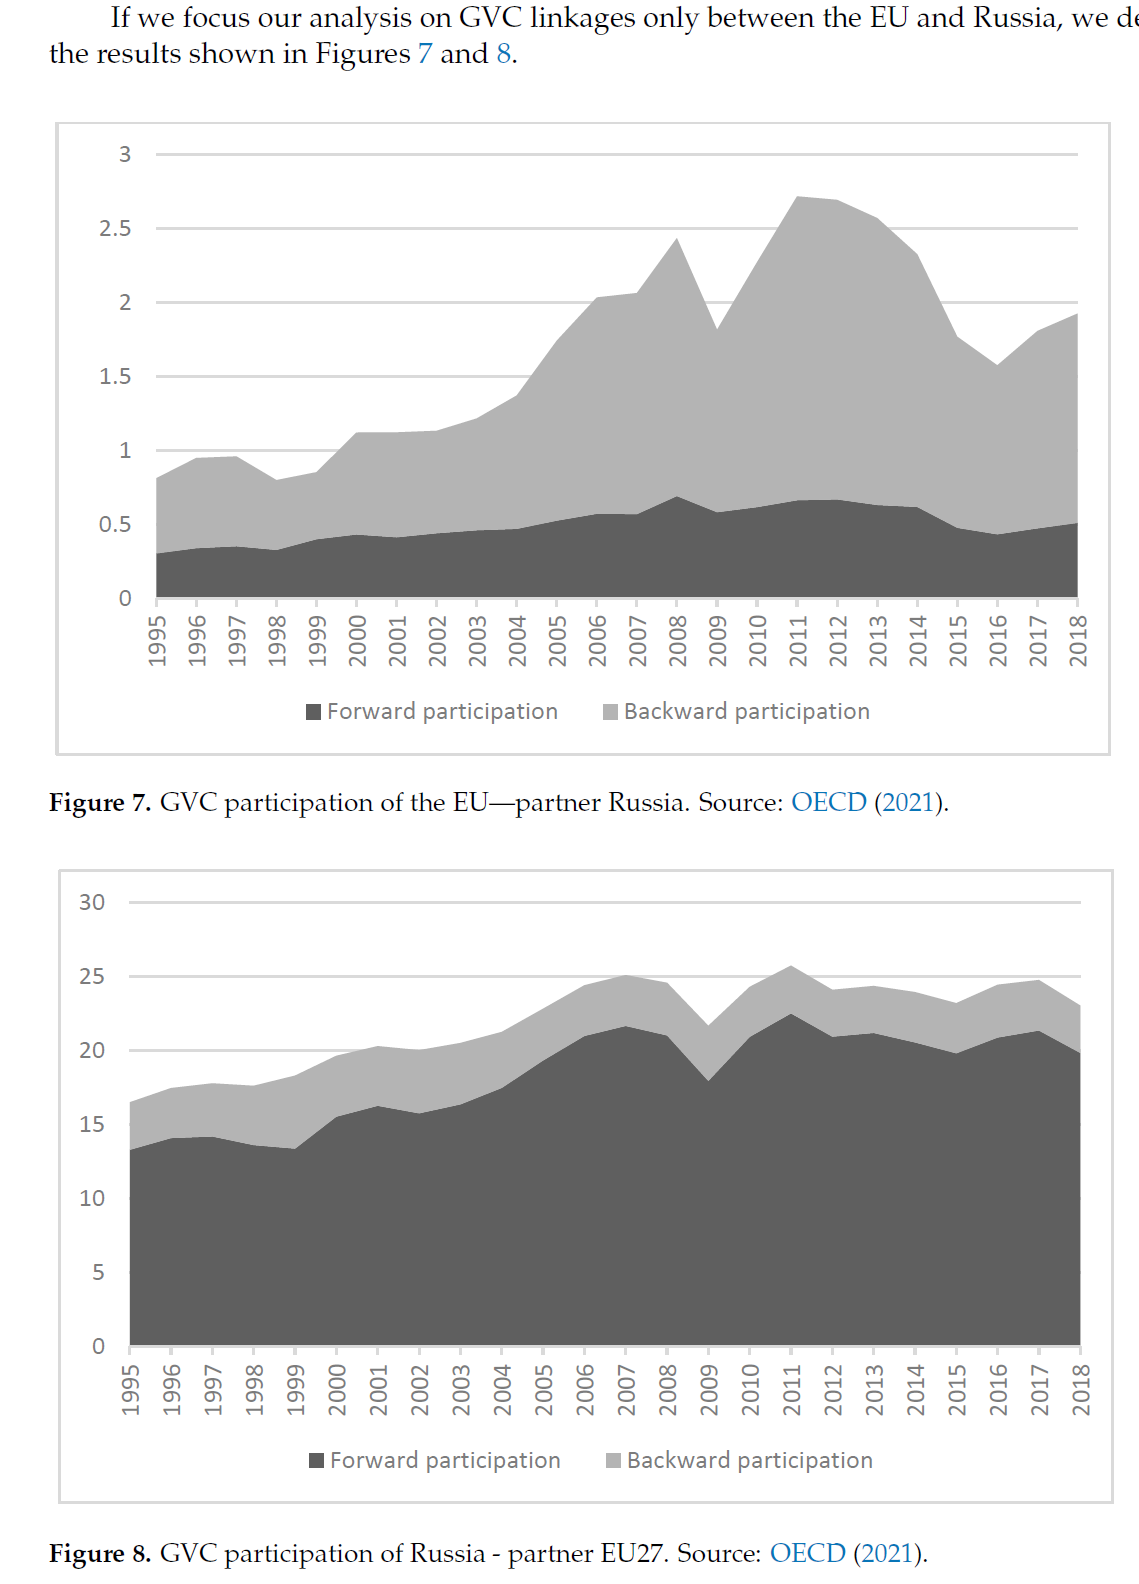 If thwe researchers focus theour analysis on GVC linkages only between the EU and Russia, we derive the results can be shown in Figures 4Figures 7 and 58.

4. Conclusion
The comparison of GVC participation of the EU and Russia highlighted the differences between them, which have arisen from the specificities of their economic structures. Russia is a resource-rich country whose exports are mainly based on resources and resource-related products. Therefore, forward participation in global value chainsdominates. In the EU and its member states, backward participation dominates, implying a high dependence of the production process in the EU on import of intermediates (i.e., production inputs) from abroad. In last 20 years, the EU has increased (almost doubled) its backward participation in GVCs while its forward participation stagnated by around 15%. At the same time, Russia has slightly decreased its backward participation but significantly increased its forward participation. The sectoral analysis indicates a high share of value added from Russia in the sector “mining and quarrying, energy producing products” in the EU final demand. The opposite is true for the sectors “electricity, gas, steam and air conditioning supply” and “transport equipment”. There are also sectors in Russia, such as electrical equipment, pharmaceuticals, chemical products and construction, that depend on a high share of EU value added. It is certainly important to highlight the process of green transition in the EU. Russia is only partially isolated and the impact of sanctions on its economy and trade will be partial because it has successfully turned to co-operation with countries that did not impose sanctions, primarily China, so it is expected that this will intensify trade with partner countries and also create value chains with producers from those countries.
References
- OECD. 2021. Trade in Value Added. Available online: https://stats.oecd.org/Index.aspx?DataSetCode=TIVA_2021_C1 (accessed on 7January 2023).
- Koopman, Robert,William Powers, ZhiWang, and Shang-JinWei. 2010. Give Credit Where Credit Is Due: Tracing Value Added inGlobal Production Chains’. NBER Working Paper, No. 16426. Available online: http://www.nber.org/papers/w16426 (accessedon 7 January 2023).
- Eurostat. 2022. Energy Represented 62% of EU Imports from Russia. Available online: https://ec.europa.eu/eurostat/en/web/products-eurostat-news/-/ddn-20220307-1 (accessed on 7 February 2023).
- European Parliamentary Research Service. 2022. Russia’s war on Ukraine: EU Trade Policy. Available online: https://epthinktank.eu/2022/05/16/russias-war-on-ukraine-eu-trade-policy (accessed on 7 February 2023).
- WEF. 2022. How Much Energy Does the EU Import from Russia? Available online: https://www.weforum.org/agenda/2022/03/eu-energy-russia-oil-gas-import (accessed on 7 February 2023).
- Euronews. 2023. After 10 Rounds of Sanctions, How Much EU-Russia Trade Is Banned? Available online: https://www.youtube.com/watch?v=FDyNqWzDs1w (accessed on 7 February 2023).
- OECD. 2021. Trade in Value Added. Available online: https://stats.oecd.org/Index.aspx?DataSetCode=TIVA_2021_C1 (accessed on 7January 2023).
- Koopman, Robert,William Powers, ZhiWang, and Shang-JinWei. 2010. Give Credit Where Credit Is Due: Tracing Value Added inGlobal Production Chains’. NBER Working Paper, No. 16426. Available online: http://www.nber.org/papers/w16426 (accessedon 7 January 2023).