Submitted Successfully!
To reward your contribution, here is a gift for you: A free trial for our video production service.
Thank you for your contribution! You can also upload a video entry or images related to this topic.
Version Summary Created by Modification Content Size Created at Operation
1 -- 3772 2023-06-21 22:13:23 |
2 format correction -156 word(s) 3616 2023-06-25 04:26:14 | |
3 format correction + 4 word(s) 3620 2023-06-28 09:47:52 |

Video Upload Options

Do you have a full video?

Confirm

Are you sure to Delete?
Cite
If you have any further questions, please contact Encyclopedia Editorial Office.
Kavaz, E.; Puig, A.; Rodríguez, I. Chatbot-Based Natural Language Interfaces for Data Visualisation. Encyclopedia. Available online: https://encyclopedia.pub/entry/45954 (accessed on 17 May 2024).
Kavaz E, Puig A, Rodríguez I. Chatbot-Based Natural Language Interfaces for Data Visualisation. Encyclopedia. Available at: https://encyclopedia.pub/entry/45954. Accessed May 17, 2024.
Kavaz, Ecem, Anna Puig, Inmaculada Rodríguez. "Chatbot-Based Natural Language Interfaces for Data Visualisation" Encyclopedia, https://encyclopedia.pub/entry/45954 (accessed May 17, 2024).
Kavaz, E., Puig, A., & Rodríguez, I. (2023, June 21). Chatbot-Based Natural Language Interfaces for Data Visualisation. In Encyclopedia. https://encyclopedia.pub/entry/45954
Kavaz, Ecem, et al. "Chatbot-Based Natural Language Interfaces for Data Visualisation." Encyclopedia. Web. 21 June, 2023.
Chatbot-Based Natural Language Interfaces for Data Visualisation
Edit

Reality (AR) or Virtual Reality (VR), particularly for advanced visualisations, expanding guidance strategies beyond current limitations, adopting intelligent visual mapping techniques, and incorporating more sophisticated interaction methods. 

data visualisation natural language interface chatbot

1. Introduction

Visualisation-oriented Natural Language Interfaces (V-NLIs) are interactive systems designed to facilitate the users’ visual analytic tasks. Despite V-NLI being a relatively new field, several survey papers have already addressed this topic. These works have focused on reviewing Visualisation-oriented Natural Language Interfaces that were mainly conceived as form-based question-answering systems, where the users ask the system questions using UI (User Interface) widgets, and the system’s answer takes the form of text, a filtered visualisation and/or a new visualisation. Nevertheless, recent advances in Natural Language Processing have facilitated a double enhancement of these systems, both in its inner workings (NLU—Natural Language Understanding and NLG—Natural Language Generation) and in its interface. The interface is now a chatbot (embodied or not) that engages in conversation with the users to facilitate their interaction with visualisations. 

2. Data Visualisation
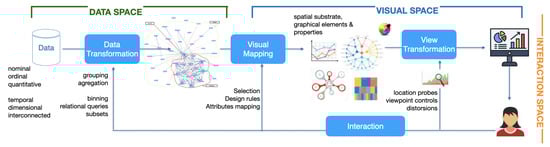
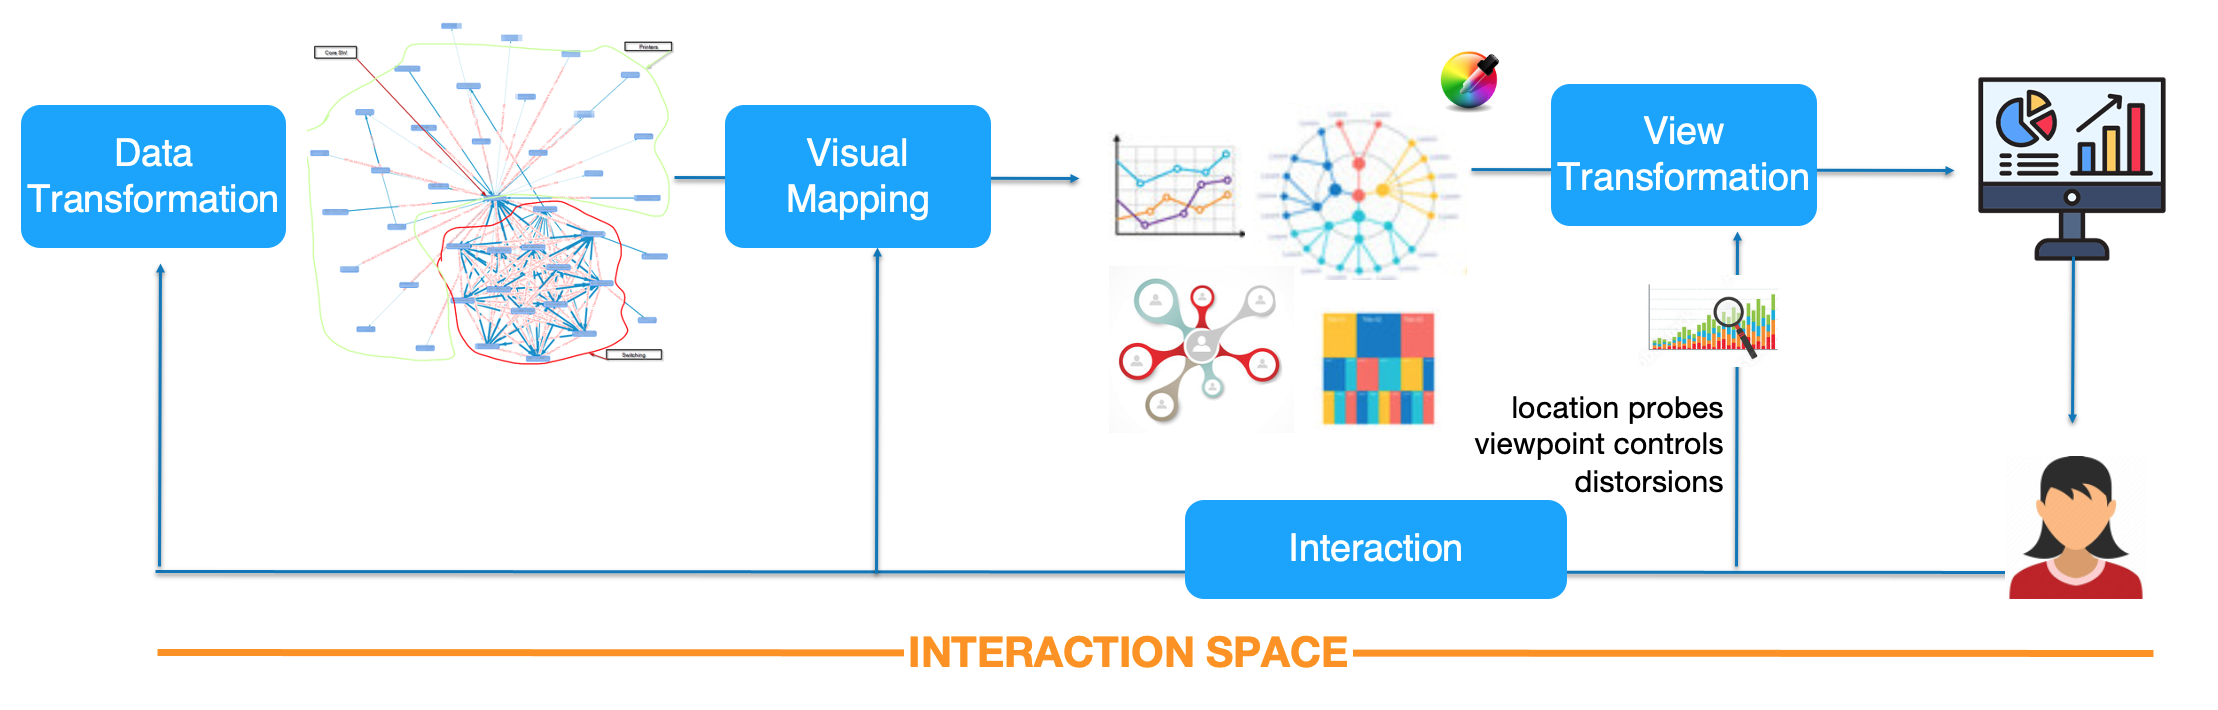
A common data visualisation process consists of several steps [1][2]. Figure 1 details the data flow through these steps constructing the visual structures and how the end-user can interact with the data involved in each step (from right to left, see the arrows in the lower part of the figure), filtering regions (View Transformation), changing visual parameters (Visual Mapping), and making more complex requests on the data (Data Transformation). Starting from the three spaces in which the visualisation takes place—Data Space, Visual Space and Interaction Space—researchers present the most relevant characteristics that will serve as a basis for describing the works under study in this scoping review.
Figure 1. Overview of the Data Visualisation pipeline adapted from [1].

2.1. Data Space

The Data Space (shown in green in the upper-left part of Figure 1) covers the space in which the data are directly processed. When the input data are in a tabular format, the Data Transformation stage usually offers a set of operations to filter, cluster and aggregate data, among other functions, which can help to provide some data insights.  Actually, these data categories help to identify the Data Transformation (see the first blue square in Figure 1), which is decisive for discovering insights in the data. Classical data transformations such as grouping, aggregation, enclosure and binning temporal items are widely associated with specific data categories in the visualisation community [3]. For instance, while aggregation functions such as mean and sum are suitable for quantitative data, grouping is better suited to nominal and ordinal data, and binning intervals is the right transformation in the case of temporal samples [1]. In addition, recent works have proposed more complex transformations of multidimensional datasets to extract meaningful subsets using relational queries [4][5][6]. In the case of connected structures, the topology can play an important role in the transformations, and also in the next stage of Visual Mapping [7]. For instance, extracting the largest path is a common transformation in elongated trees, and obtaining the widest level is a more typical transformation in compact hierarchies. Therefore, regarding the data types and their different transformations, researchers categorised data as: (1) tabular data, i.e., data with individual and non-connected items, where classical data transformations are enough, and (2) complex data, i.e., high-dimensional, temporal and interconnected data, which require more complex transformations. Moreover, both categories of data not only involve different transformations but also different strategies in the successive steps of the pipeline. Researchers summarise in Figure 2 the main trends working on the Data Space. The figure also details the kind of data attributes each V-NLI supports (nominal, numerical, temporal, spatial).
 
Figure 2. Data Space overview and the main characteristics of the data involved in the visualisation pipeline.
In general, research works cover a wide range of real-life applications (movies, sports, coronavirus, finance and others). Most of them used multidimensional tabular data [8][9][10][11][12][13][14][15][16][17][18][19][20][21] while few of them also included spatial data [8][20][19][22]. Moreover, it seems that the exploration of complex data is still an emerging field in this type of natural language interactions. For instance, Ref. [23] has data related to software bundles and services such as OSGi bundles, and [24] uses network data displaying the relationships between football players. Furthermore, the ConVisQa system [25] has hierarchical data that is collected from online conversations and [22] works with flow data such as hurricanes. Finally, Ref. [26] has sequential temporal data (e.g., sleep time during each night), and [27] has transient data which is a data type that is relevant to a time period; in this case, it is the quality of software services over time.

2.2 Visual Space

The second space involved in the data visualisation process is the Visual Space (shown in blue in the upper-middle part of Figure 1), which refers to how to map the data in visual structures (the Visual Mapping Step) and how to display them in a viewport (the View Transformation Step).
The Visual Mapping Step involves the definition of the next three aspects:
  • The spatial substrate—i.e., the space and the layout used to map the data;
  • The graphical elements—i.e., marks such as points, lines, images, glyphs, lines, etc.;
  • The graphical properties—also called retinal properties, i.e., size, colour, orientation, etc. [2].
In the spatial substrate, a wide variety of layouts for displaying data have been proposed, from the simplest, such as those based on coordinate axes, to the more complex, such as those representing networks [28][29]. In fact, the more basic and simple they are, the more they are exploited in different applications. Researchers classify these layouts as basic and advanced. Basic layouts refer to chart-based layouts, which have x and y axes (e.g., bar, line, scatter plot), table-based layouts and map-based layouts (such as a bubble map). Researchers consider advanced layouts to be those that deal with higher dimensionalities (e.g., parallel coordinates) and with connections (e.g., radial tree, circle packing, network graph, sunburst diagram, chord diagram). Most of the articles employed explicitly basic visualisations [11][8][9][10][12][13][14][15][16][18][19][20][21]. The most common methods are bar charts, line charts and scatter plots. 
 
Figure 3. View Space overview and the main characteristics of the Visual Mapping and the View Transformation steps.
Researchers consider advanced layouts to be those that deal with higher dimensionalities (e.g., parallel coordinates) and with connections (e.g., radial tree, circle packing, network graph, sunburst diagram, chord diagram). Only a small percentage of these studies used advanced visualisation methods. For example, Bieliauskas and Schreiber [23] and Orko [24] implemented network visualisations as their main visualisation. In addition, Orko includes additional basic visualisation methods such as a bar chart to support its main visualisation. On the other hand, Tansvis [27]  uses a line graph as the main visualisation for analysing transient data (quality of the software system over time), though it has a network graph for displaying the overview of the software system, where users can select a part to explore transient behaviours. ConVisQA [25] created a novel design to show the hierarchical structure of conversations using stacked bar charts with indentations to show the hierarchy. ConVisQA also displays the conversations on the right-hand side of the screen. InChorus [17] supports popular basic visualisations such as bar, line and scatter, and they also included one complex option, parallel plots. FlowNL [22] used flow visualisation to show flows occurring on the earth (e.g., hurricanes). FlowNL also included basic visualisation methods for giving additional information such as a bar chart displaying the velocity of the hurricanes.
To analyse the reviewed papers in terms of the visual mapping identification, i.e., to choose layouts and graphical elements and properties, researchers use the following categories: fixed, user-defined, rule-based (researchers refer to basic rule-based methods as those that follow a set of heuristics and make decisions based on them), and intelligent methods (intelligent methods involve the use of machine learning, artificial intelligence or other computational techniques to enable systems to learn from data, adapt and make decisions in a more flexible and adaptive manner). Researchers examined the Visual Mapping Identification in the previous works and found that most of them only have fixed visual mapping [25][26][24][27][23][14][21][22][16]. Meanwhile, only few of them support user-defined mapping [11][18], while some use the rule-based visual mapping [9][15][10][12] method. Finally, there are V-NLIs that support a combination of two visual mappings [17][20][13][8].
Once the visual mapping is performed, the View Transformation stage allows users to change the viewpoint (e.g., zooming and panning), perform location probes (to measure values in samples), and create some distortions in the image (i.e., change the projection type) [1]. Additionally, view transformation allows users to take into account multiple views simultaneously, as well as animations and others. Some view transformations emphasise data with importance-driven strategies to enhance values and regions of interest, among other factors. Focus+Context [30] highlights the important data (focus) while the rest of the data provide additional information on the background (context), which allows users to see the details as well as the entire perspective. Researchers will describe the reviewed works in terms of the number of views that they use simultaneously (Single/Multiple) and the strategy used to emphasise regions or parts of the view (zoom, panning, focus+context, level of detail, multiresolution and others). Related to View Transformation, most of the explored works use a single view to visualise data [23][11][25][14][22][15][16][17][18][20][24][21]. There are nine V-NLIs that have multiple views. Boomerang [12] displays multiple recommended visualisations simultaneously, while Talk2Data [10] generates multiple visualisations with annotations in a visualisation narrative style. In the case of MIVA [19], there are three fixed visualisations (bar, line, map), which are simultaneously updated to answer users’ queries. Similarly, Evizeon [8] supports synchronised multiple views. Moreover, in Data@hand [26] and TransVis [27], multiple visualisations can be observed. Chat2Vis [13] demonstrates visualisation outputs using three views that use different LLM models to compare their performance. Finally, Orko [24] and FlowNL [22] have complementary visualisations in addition to primary ones.

2.3 Interaction Space
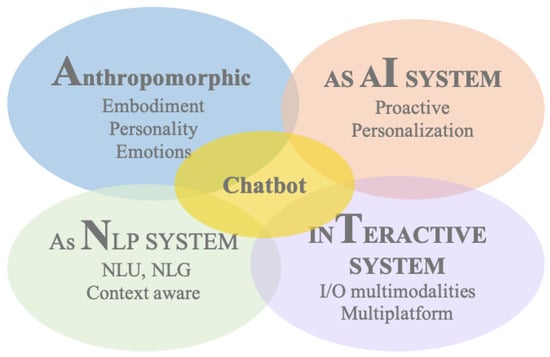
Last but not least is the Interaction Space (shown in blue in the upper-right part of Figure 1), where the users interact with all the previous steps defined above. There have been many attempts to categorise different interactions [31][32]. Yi et al. [33] proposed seven interaction methods based on the user’s intents: select, explore, reconfigure, encode, abstract/elaborate, filter and connect. All those interactions can be done by users throughout the different stages of the visualisation pipeline (see Figure 4). Notice that users can utilise all these methods through different interaction styles. Researchers consider a coarse two-labelled categorisation: Basic and Advanced. Basic styles refer to the WIMP (Windows, Icons, Mice, Pointer), while Advanced styles involve techniques such as Virtual Reality (VR), Augmented Reality (AR) and Natural Language. These categories will help researchers to explore the value that a visualisation-oriented chatbot can add to these interaction styles. In the literature, the use of different interaction styles varies. Most V-NLIs use both Basic (WIMP) and, naturally, Advanced (NL) interactions [25][26][14][8][15][17][19][24][9][20][21][22][27], while some of them use only Advanced (NL) interactions [23][11][12][18][10][16][13].
Figure 4. Interaction Space affects all the steps of the visualisation pipeline.
Regarding the bibliography, the most used interaction techniques are select and filter. V-NLIs such as [12][27][26][23] use NL to interact with visualisations selecting (marking a data point) and filtering (showing something conditionally) data according to user queries. Similarly, Refs. [16][21] use NL to update visualisations using filtering at the data transformation stage, while Chat2Vis [13] does this to generate visualisations. Others, such as [25][17][19][20], use both direct manipulation and NL to filter visualisations at the visual mapping stage. Refs. [8][9] use both basic and advanced interaction techniques at the visual mapping stage to filter visualisation and [8] uses advanced interaction while using the select method. Orko [24] and Databreeze [14] use both NL and direct manipulation to filter and select data on visualisations. The next most used method is Encode [14][23][9][17][20][27][21][18][26][13]. For example, a lot of works [14][13][9][17][20] allow users to colour and size data points and add/remove attributes by using Basic (WIMP) and Advanced (NL) interactions at the visual mapping stage. The reconfigure method is supported by four V-NLIs [14][17][8][21], which are used to change the visual perspective of the data in the visual mapping. For instance, Valetto [21] uses gestures (a basic interaction) to flip the axis in the visualisation mapping stage.
Furthermore, the explore method, which is considered to be zooming and panning in the View Transformation stage, is used in four V-NLIs [23][17][9][27], all with basic interactions. The abstract/elaborate method is used in four V-NLIs [26][17][27][9] to drill down to show more details. For example, Ref. [26] transforms data to show average hours of sleep over various months, and users can choose the visual mapping to see each month separately in more detail using NL. Similarly, Ref. [9] uses NL to do drill downs, while, on the other hand, TransVis [27] uses direct manipulation. InChorus [17] uses both modalities. Finally, the connect method is only used by two V-NLIs [23][24]. Both of these V-NLIs have network visualisation and use the connect method to highlight the relationships between links using Advanced interactions (i.e., using Focus+Context visualisations). While [34]performs this at the data transformation stage, Ref. [24] does this at the visual mapping stage.

3. Chatbot

Chatbots are software systems able to engage in conversations with users [35], thereby representing a natural interface for them. In Figure 5, researchers propose a general characterisation of chatbots using four dimensions, named AINT, depending on how researchers view them. First, chatbots may have Anthropomorphic (A) properties such as appearance [36] and gender and also may be endowed with personality and emotions [37]. Second, as an Intelligent system (I), task-based chatbots can proactively make data-driven decisions to give support to users’ activities, and social chatbots maintain meaningful and engaging conversations with their users. In any case, chatbots can also be enhanced through a variety of AI methods and techniques, for example predicting users’ necessities and behaviours and thereby personalising the UX (User eXperience) [38]. Third, as a Natural language processing system (N), chatbots usually consist of an NLU (Natural Language Understanding) part [39], which understands the intentions (goals) of the users (i.e., the inputs), maintaining the visual context of the conversation, but they must also provide a textual, visual, auditive answer to them, based on that context. Those answer types (i.e., the outputs) can be either predefined or automatically generated. In the specific case of text, they are usually created by an NLG (Natural Language Generation) system [40]. Finally, as an interactive system (T), chatbots can be integrated with different interaction styles (WIMP, VR, XR) and be equipped with a multimodal interface through voice, text and gestures.
Figure 5. AINT—General characterisation of a Chatbot based on four dimensions: A—Anthropomorphic, I—Intelligence, N—Natural Language Processing, and T—inTeractivity.

3.1 Interaction

Visualisation-oriented Natural Language Interfaces (V-NLIs) are interactive systems (AINT) designed to facilitate the users’ visual analytic tasks. They can be designed using two different user interfaces (UI): a form-based interface and a chatbot-based interface. On one hand, a form-based V-NLI [9][41] is usually composed of a text box that allows the users to introduce the visualisation query using natural language, though it also has other widgets, for example, to refine (filter) the resultant visualisation. The most know approaches are Form-based V-NLIs [26][14][22][17][8][9][10][25][24][19]. On the other hand, a chatbot-based interface [63 ] is distinguished by a named entity (also known as an agent), with gender and appearance, as well as with the ability to recognise and express emotions, while having personality traits (i.e., empathetic, fun, neutral). Among the existing works, some integrated Chatbot-based V-NLIs [11][12][18][15][16][21][23][27][13][20]. These V-NLIs have a chat window in which users can engage in conversations with a bot to analyse data visualisations. In some tools, the chat window is separated from the main visualisation dashboard [23][16][20][27][21] , and in others, the visualisations are displayed in the chat windows [11][18][15][12][13]. For instance, both Iris [18] and Ava [11] were developed to help users perform complex data science tasks such as statistical analysis. While [18] displays visualisations in a single chat window, Ref. [11] has two windows, one containing the chatbot and the other showing the actions the chatbot performs, such as displaying visualisations.

3.2 Input

The types of inputs (analytical questions) that a V-NLI system deals with are low- and high-level queries. In Low-level queries, the users explicitly describe their intent, for example, “Show me action films that won an award in the past 10 years”. Therefore, these queries can be interpreted easily. When researchers explored different Query Types, researchers found that most of the previous research presented V-NLIs that support only low-level queries [24][18][23][11][25][15][27][21][12][26][14][22][8][16][17][9][20][19]. For instance, in works such as [25][14][17][9][26][20][19][23][22][12][21], users can ask direct queries and receive answers such as filtered or highlighted data points on visualisations or new visualisations. Moreover, there are V-NLIs that have more specific datasets and the chatbot is designed to ask users questions or give prompts to perform the analysis [15][16][27][11][18]. In contrast, High-level open-ended queries are naturally broader and their interpretation can be more complex [42][32]. There are two V-NLIs support both low and high level queries, Talk2Data, which is form-based [10] and Chat2Vis, which is chatbot-based [13].

Moreover, queries can be One-turn or Follow-up. In One-turn queries, the users ask the system in a single shot.  On the other hand, the users usually perform Follow-up queries, which are a series of interconnected questions [34]. There are only four V-NLIs that support follow-up queries [8][9][14][24] and all of them support only low-level queries. After each query, Ref. [9] recommends follow-up queries on a list. On [24][14][8], users can refer to entities using determiners and pronouns.
The challenges of both understandability and discoverability require an interactive conversational system to guide the users on how to effectively communicate their goals (also referred to as intentions). Well-known Conversational Guidance strategies are based on help—the chatbot gives the users hints on what to ask; intent auto-complete functions—the system makes suggestions of possible intents while the users are writing the intent [43][22][25][44]; and intent recommendations [9]—after giving a response, the system suggests, based on data or on the previous turns of the analytical conversation, possible next intents to the users. Additionally, the understandability problem of NLIs is mainly derived from the biggest challenge that NL poses, which is ambiguity. One solution is to ask the users what they meant or to use disambiguity widgets [43][44]Some existing tools do not provide [23][19][14][17][12][15][18][13] the user with any conversational guidance, while the rest of the tools recommend tasks or queries [9][11][24][10][26], help users [20][11][9][27][21], or auto-complete queries [25][16][8][22] designed to increase the discoverability of the NLI, helping users to understand what the NLI is capable of doing. Moreover, an interesting case of co-reference arises when natural language interfaces coexist with other interaction styles (Multimodality) such as menu selection (WIMP—Window Icon Mouse Pointer) and direct manipulation (XR—Virtual or Augmented Reality) [45]. Some reviewed V-NLIs have additional Multimodality to Natural Language(NL). For example, Refs. [8][23] have ambiguity widgets with which users can interact. Moreover, with V-NLIs [26][24][14][17], users can interact with the user interface using touch. Users can also select filters and interact with data without using NL.

 3.3 Output 

In addition to the requested visualisation, a V-NLI can consider Complementary Output such as Feedback, either text or visual: (i) to inform about the query’s success or failure, (ii) to justify relevant decisions taken by the system, (iii) to provide the users with additional explanations to better interpret the resulting visualisation (textual, oral, graphs, or statistics) and annotations, and (iv) to display changes in the User Interface (highlighting menus, buttons). 

All of the works explored give the users textual feedback and some of them give visual feedback as well. The only exception is Chat2Vis [13], which, probably due to its recentness, is not yet integrated into a visualisation platform. Basically, textual feedback is used to inform or justify chatbot decisions to the users. Works such as [23][24][9][19] inform users about the success or failure of their queries. Moreover, Refs. [11][15][18][16][27] provide the users with informative feedback, additional explanations and follow-up questions to users to carry on the analysis. Furthermore, researchers explored related work that provided users with additional visual feedback, such as supplementary graphs with main visualisation or changes on filters on the UI that have been applied by the chatbot. V-NLIs such as [17][9][19][20][14][21][26][27] have visual feedback on the UI. 

4. Contrasting V-NLI: Queries, Transformations, Multimodality.

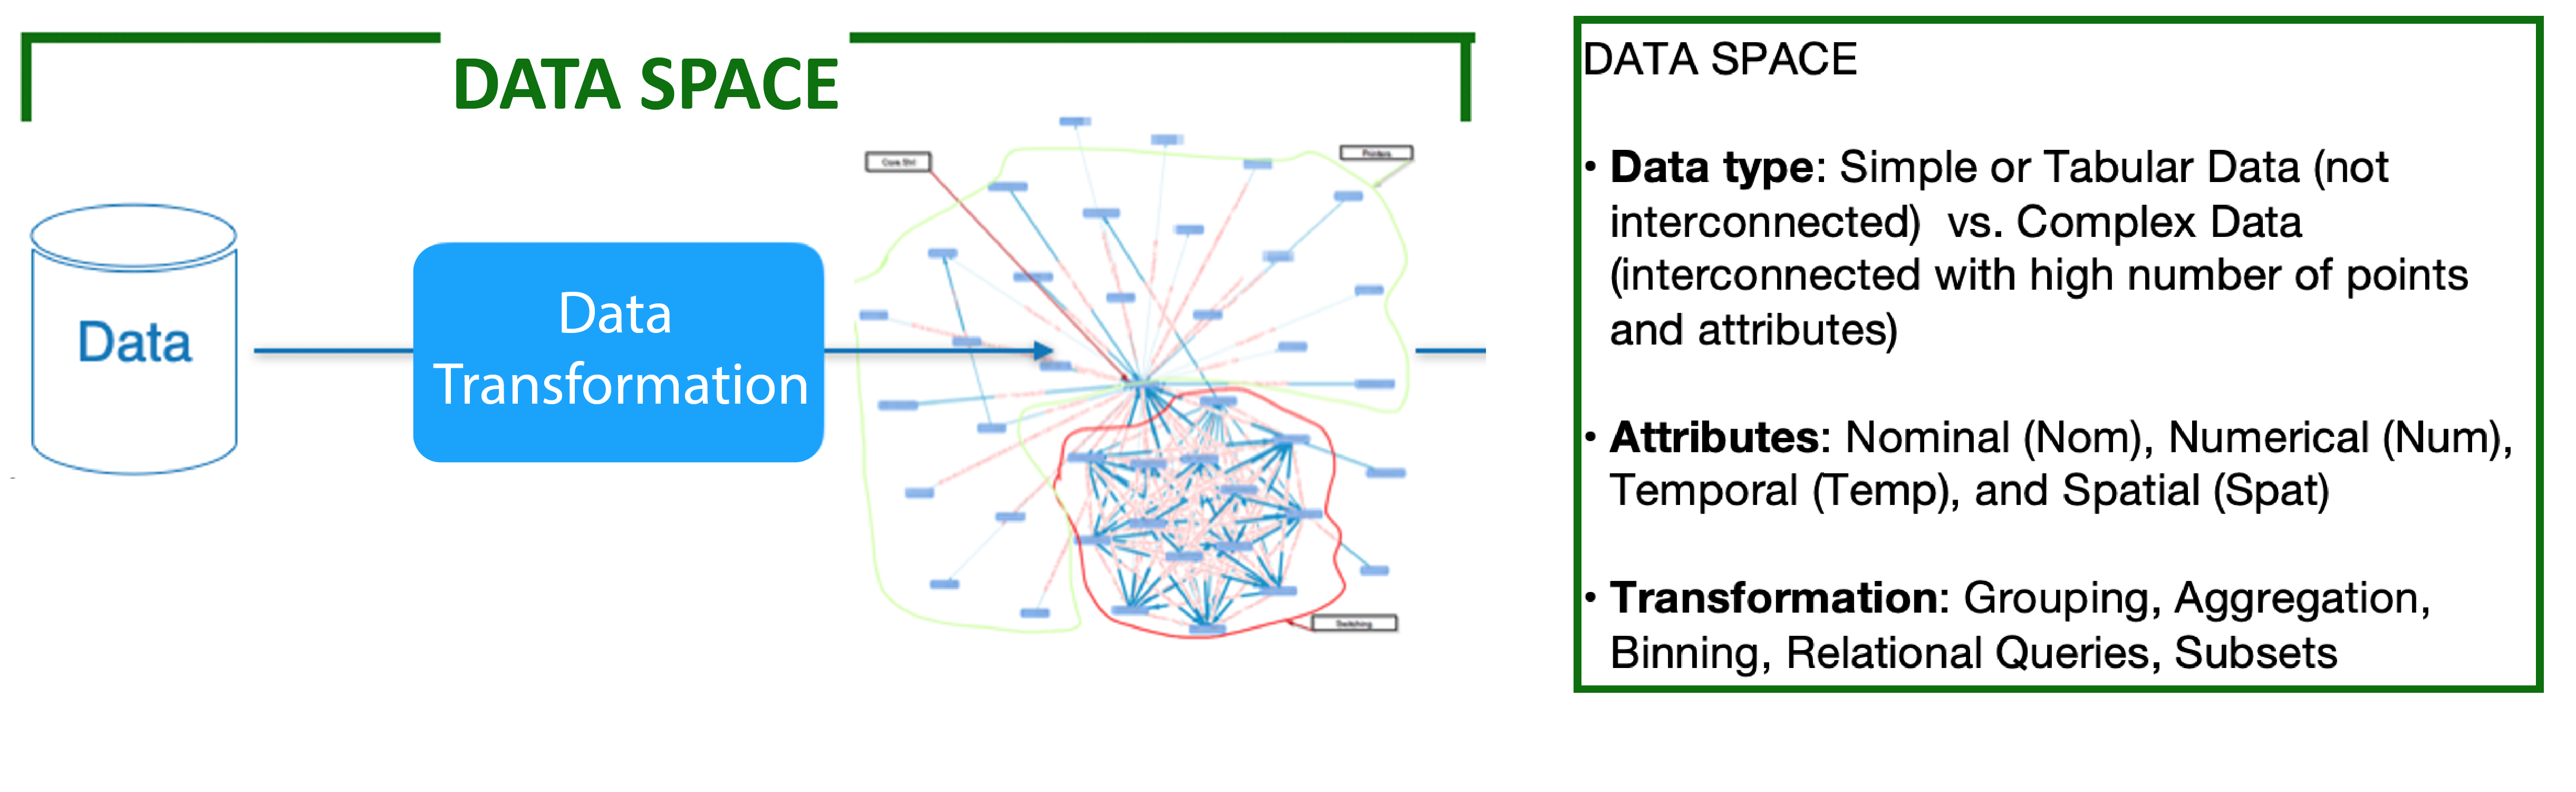
Figure 6 shows the contrasted the results of the input characteristics of V-NLIs with how these systems deal with the data space stage in the visualisation pipeline. Researchers found that most of the works allow the users to express only low-level queries, and those that consider high-level queries do so with simple data types (see Figure 6, signal a and b) and attributes, i.e., tabular data with numerical and nominal attributes. Moreover, independently of the user’s intents (low or high queries), all the examined V-NLIs contemplate simple data transformations (i.e., simple aggregations and statistical analysis such as correlations and logistic regressions). Note also that those simple data transformations have normally been incorporated into V-NLI systems that consider followup queries [8][9]. Few works provide users with help or recommendations based on the data type, which is currently mainly tabular data [9][10][11][26]. Regarding multimodality, most systems allow user–chatbot interaction combined with WIMP, but few of them allow touching [26][17][14][24] and only one work uses gestures [21].


Figure 6. Spider chart displaying the relationship between data types and input V-NLI characteristics.

Figure 7 shows the scope of advanced and basic visualisations in both V-NLI and visualisation dimensions; see the borders in purple and green colour, respectively. As researchers can appreciate in the magenta- and blue-coloured polygons, V-NLIs that consider basic layouts embrace these dimensions in greater measure than those considering advanced layouts. Furthermore, the empty space of the spider reveals that there is a lot of room for research on different aspects of both basic and advanced visualisations in V-NLIs.

Figure 7. Spider chart displaying the relationship between Visual Space and V-NLI characteristics of analysed works.

Figure 8, both chatbot-based and form-based approaches cover a similar, short range of interactive methods—Filtering and Selecting being the most covered—including some values near zero, especially with chatbot-based approaches (see the complex interactions Abstract/Elaborate [27], Connect [23][24], Reconfigure [22], Explore [27] in yellow dots).

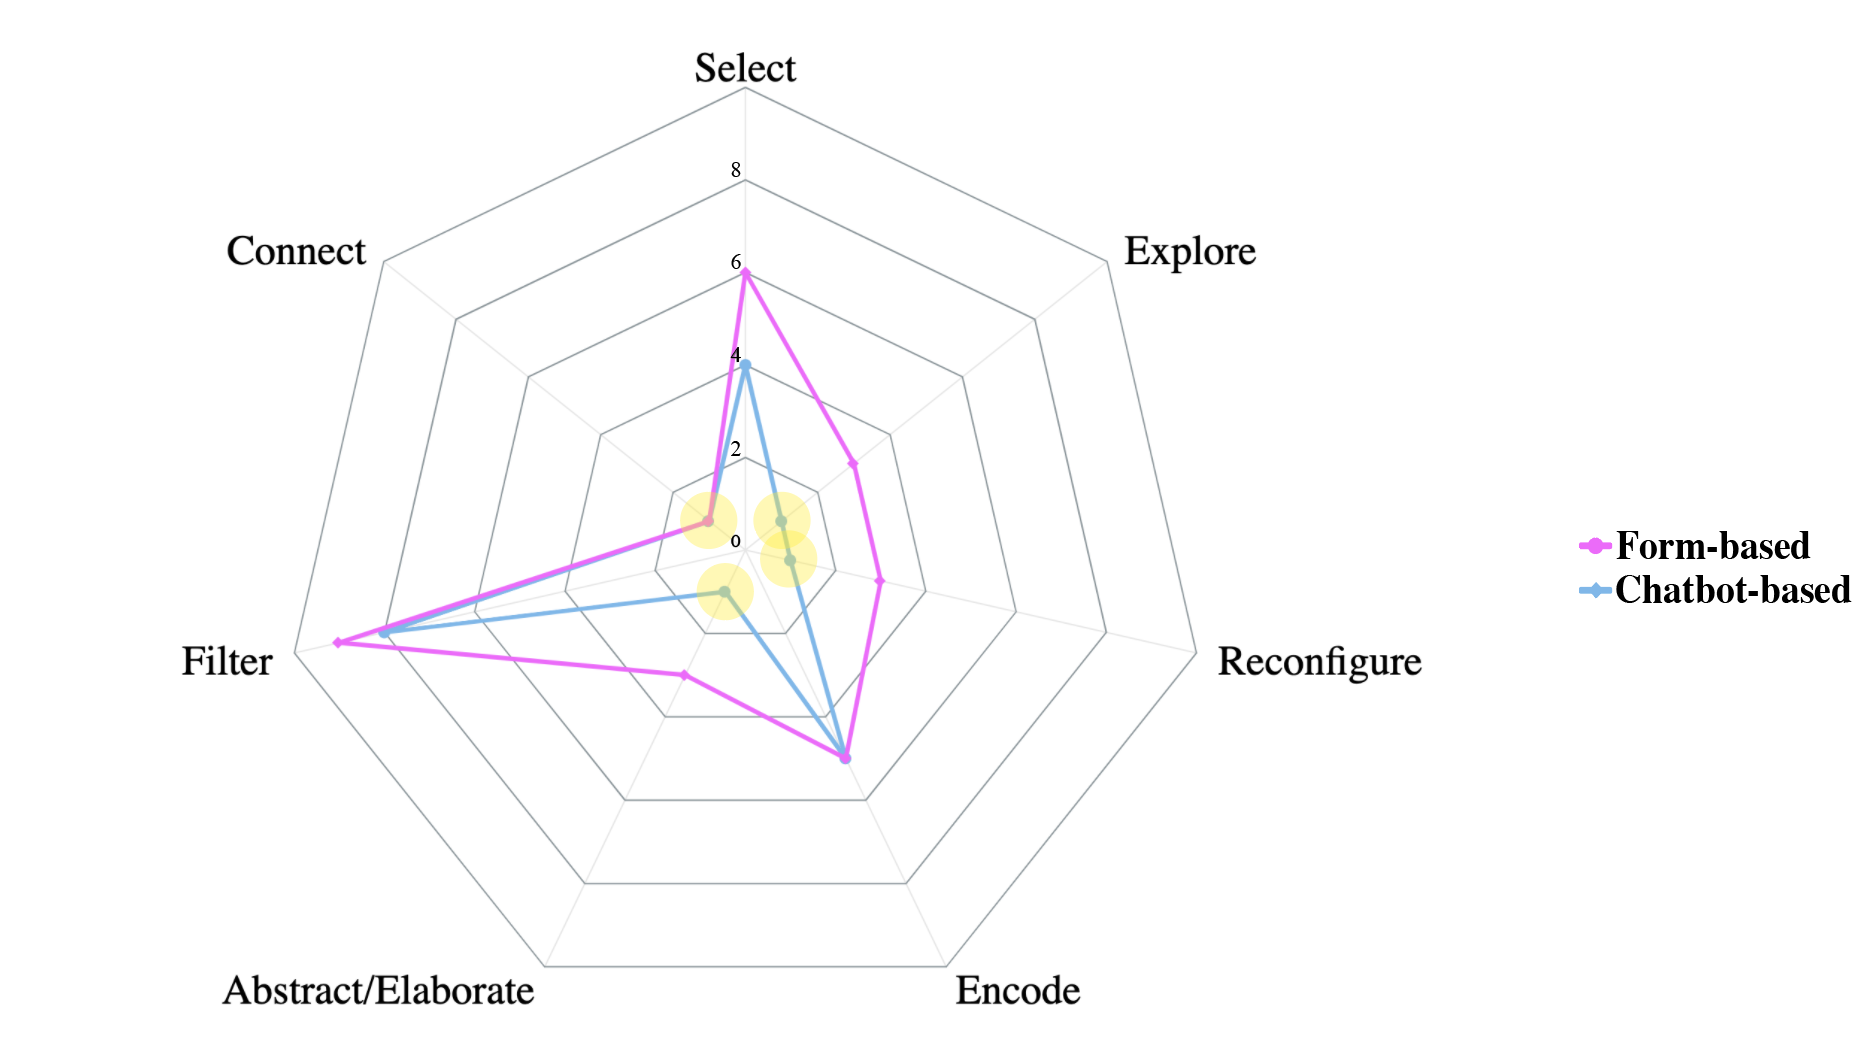
Figure 8. Spider chart displaying the relationship between the type of V-NLIs and interaction methods.

References

  1. Shen, L.; Shen, E.; Luo, Y.; Yang, X.; Hu, X.; Zhang, X.; Tai, Z.; Wang, J. Towards natural language interfaces for data visualization:
  2. Card, M. Readings in Information Visualization: Using Vision to Think; Morgan Kaufmann: San Francisco, CA, USA, 1999.
  3. Qin, X.; Luo, Y.; Tang, N.; Li, G. Making data visualization more efficient and effective: A survey. VLDB J. 2020, 29, 93–117
  4. Hanrahan, P. Vizql: A language for query, analysis and visualization. In Proceedings of the 2006 ACM SIGMOD International Conference on Management of Data, Chicago, IL, USA, 27-29 June 2006; pp. 721–721.
  5. Luo, Y.; Tang, N.; Li, G.; Tang, J.; Chai, C.; Qin, X. Natural Language to visualization by neural machine translation. IEEE Trans.Vis. Comput. Graph. 2021, 28, 217–226.
  6. Satyanarayan, A.; Russell, R.; Hoffswell, J.; Heer, J. Reactive vega: A streaming dataflow architecture for declarative interactive visualization. IEEE Trans. Vis. Comput. Graph. 2015, 22, 659–668.
  7. Kavaz, E.; Puig, A.; Rodríguez, I.; Chacón, R.; De-La-Paz, D.; Torralba, A.; Nofre, M.; Taule, M. Visualisation of hierarchical multivariate data: Categorisation and case study on hate speech. Inf. Vis. 2022, 22, 31–51.
  8. Hoque, E.; Setlur, V.; Tory, M.; Dykeman, I. Applying pragmatics principles for interaction with visual analytics. IEEE Trans. Vis.Comput. Graph. 2017, 24, 309–318.
  9. Srinivasan, A.; Setlur, V. Snowy: Recommending Utterances for Conversational Visual Analysis. In Proceedings of the The 34th Annual ACM Symposium on User Interface Software and Technology, Virtual Event, USA, 10-14 October 2021; pp. 864–880
  10. Shi, D.; Guo, Y.; Guo, M.; Wu, Y.; Chen, Q.; Cao, N. Talk2Data: High-Level Question Decomposition for Data-Oriented Question and Answering. arXiv 2021, arXiv:2107.14420.
  11. John, R.J.L.; Potti, N.; Patel, J.M. Ava: From Data to Insights through Conversations. In Proceedings of the CIDR, Chaminade, CA, USA; 8-11 January 2017.
  12. Lee, D.J.L.; Quamar, A.; Kandogan, E.; Özcan, F. Boomerang: Proactive insight-based recommendations for guiding conversational data analysis. In Proceedings of the 2021 International Conference on Management of Data, Virtual Event, China; 20-25 June 2021; pp. 2750–2754.
  13. Maddigan, P.; Susnjak, T. Chat2vis: Generating data visualisations via natural language using chatgpt, codex and gpt-3 large language models. arXiv 2023, arXiv:2302.02094.
  14. Srinivasan, A.; Lee, B.; Stasko, J. Interweaving multimodal interaction with flexible unit visualizations for data exploration. IEEE Trans. Vis. Comput. Graph. 2020, 27, 3519–3533.
  15. Zhi, Q.; Metoyer, R. Gamebot: A visualization-augmented chatbot for sports game. In Proceedings of the Extended Abstracts of the 2020 CHI Conference on Human Factors in Computing Systems, Honolulu, HI, USA; 25-30 April 2020; pp. 1–7.
  16. Crovari, P.; Pidò, S.; Pinoli, P.; Bernasconi, A.; Canakoglu, A.; Garzotto, F.; Ceri, S. GeCoAgent: A conversational agent for empowering genomic data extraction and analysis. ACM Trans. Comput. Healthc. (HEALTH) 2021, 3, 1–29.
  17. Srinivasan, A.; Lee, B.; Henry Riche, N.; Drucker, S.M.; Hinckley, K. InChorus: Designing consistent multimodal interactions for data visualization on tablet devices. In Proceedings of the 2020 CHI conference on Human Factors in Computing Systems, Honolulu, Hawaii, USA; 25-30 April 2020; pp. 1–13.
  18. Fast, E.; Chen, B.; Mendelsohn, J.; Bassen, J.; Bernstein, M.S. Iris: A conversational agent for complex tasks. In Proceedings of the 2018 CHI Conference on Human Factors in Computing Systems, Montreal, QC, Canada ;21-26 April 2018; pp. 1–12.
  19. Chowdhury, I.; Moeid, A.; Hoque, E.; Kabir, M.A.; Hossain, M.S.; Islam, M.M. MIVA: Multimodal interactions for facilitating visual analysis with multiple coordinated views. In Proceedings of the 2020 24th International Conference Information Visualisation (IV), Melbourne, Australia; 7-11 September 2020; pp. 714–717.
  20. Ruoff, M.; Myers, B.A.; Maedche, A. ONYX-User Interfaces for Assisting in Interactive Task Learning for Natural Language Interfaces of Data Visualization Tools. In Proceedings of the CHI Conference on Human Factors in Computing Systems Extended Abstracts, New Orleans, LA, USA; 29 April-5 May 2022; pp. 1–7.
  21. Kassel, J.F.; Rohs, M. Valletto: A multimodal interface for ubiquitous visual analytics. In Proceedings of the Extended Abstracts of the 2018 CHI Conference on Human Factors in Computing Systems, Montreal, QC, Canada; 21-26 April 2018; pp. 1–6.
  22. Huang, J.; Xi, Y.; Hu, J.; Tao, J. FlowNL: Asking the Flow Data in Natural Languages. IEEE Trans. Vis. Comput. Graph. 2022, 29, 1200–1210.
  23. Bieliauskas, S.; Schreiber, A. A conversational user interface for software visualization. In Proceedings of the 2017 IEEE Working Conference on Software Visualization (Vissoft), Shanghai, China; 18-19 September 2017; pp. 139–143
  24. Srinivasan, A.; Stasko, J. Orko: Facilitating multimodal interaction for visual exploration and analysis of networks. IEEE Trans. Vis. Comput. Graph. 2017, 24, 511–521
  25. Siddiqui, N.; Hoque, E. ConVisQA: A Natural Language Interface for Visually Exploring Online Conversations. In Proceedings of the 2020 24th International Conference Information Visualisation (IV), Melbourne, Australia; 7-11 September 2020; pp. 440–447.
  26. Kim, Y.H.; Lee, B.; Srinivasan, A.; Choe, E.K. Data@ hand: Fostering visual exploration of personal data on smartphones leveraging speech and touch interaction. In Proceedings of the 2021 CHI Conference on Human Factors in Computing Systems, Yokohama, Japan; 8-13 May 2021; pp. 1–17
  27. Beck, S.; Frank, S.; Hakamian, A.; Merino, L.; van Hoorn, A. TransVis: Using Visualizations and Chatbots for Supporting Transient Behavior in Microservice Systems. In Proceedings of the 2021 Working Conference on Software Visualization (VISSOFT), Luxembourg City, Luxembourg, 27-28 September 2021; pp. 65–75.
  28. Börner, K.; Bueckle, A.; Ginda, M. Data visualization literacy: Definitions, conceptual frameworks, exercises, and assessments. Proc. Natl. Acad. Sci. USA 2019, 116, 1857–1864.
  29. Khan, M.; Khan, S.S. Data and information visualization methods, and interactive mechanisms: A survey. Int. J. Comput. Appl. 2011, 34, 1–14.
  30. Stasko, J.; Zhang, E. Focus+ context display and navigation techniques for enhancing radial, space-filling hierarchy visualizations. In Proceedings of the IEEE Symposium on Information Visualization 2000, INFOVIS 2000 Proceedings, Salt Lake City, UT, USA, 9–10 October 2000; pp. 57–65.
  31. Dimara, E.; Perin, C. What is interaction for data visualization? IEEE Trans. Vis. Comput. Graph. 2019, 26, 119–129.
  32. Amar, R.; Eagan, J.; Stasko, J. Low-level components of analytic activity in information visualization. In Proceedings of the IEEE Symposium on Information Visualization, 2005—INFOVIS 2005, Minneapolis, MN, USA, 23–25 October 2005; pp. 111–117.
  33. Yi, J.S.; ah Kang, Y.; Stasko, J.; Jacko, J.A. Toward a deeper understanding of the role of interaction in information visualization. IEEE Trans. Vis. Comput. Graph. 2007, 13, 1224–1231.
  34. Steinmetz, N.; Senthil-Kumar, B.; Sattler, K.U. Conversational Question Answering Using a Shift of Context. In Proceedings of the EDBT/ICDT Workshops, Nicosia, Cyprus; 23-26 March 2021.
  35. Adamopoulou, E.; Moussiades, L. Chatbots: History, technology, and applications. Mach. Learn. Appl. 2020, 2, 100006.
  36. Adamopoulou, E.; Moussiades, L. Chatbots: History, technology, and applications. Mach. Learn. Appl. 2020, 2, 100006
  37. Cassell, J. Embodied conversational interface agents. Commun. ACM 2000, 43, 70–78.
  38. Tellols, D.; Lopez-Sanchez, M.; Rodríguez, I.; Almajano, P.; Puig, A. Enhancing sentient embodied conversational agents with machine learning. Pattern Recognit. Lett. 2020, 129, 317–323
  39. Khurana, D.; Koli, A.; Khatter, K.; Singh, S. Natural language processing: State of the art, current trends and challenges. Multimed. Tools Appl. 2022, 82, 3713–3744.
  40. Gatt, A.; Krahmer, E. Survey of the state of the art in natural language generation: Core tasks, applications and evaluation. J. Artif. Intell. Res. 2018, 61, 65–170.
  41. Gao, T.; Dontcheva, M.; Adar, E.; Liu, Z.; Karahalios, K.G. Datatone: Managing ambiguity in natural language interfaces for data visualization. In Proceedings of the 28th Annual ACM Symposium on User Interface Software & Technology, Charlotte, NC, USA; 11-15 November 2015; pp. 489–500.
  42. Stasko, J.; Zhang, E. Focus+ context display and navigation techniques for enhancing radial, space-filling hierarchy visualizations. In Proceedings of the IEEE Symposium on Information Visualization 2000, INFOVIS 2000 Proceedings, Salt Lake City, UT, USA, 9–10 October 2000; pp. 57–65.
  43. Gao, T.; Dontcheva, M.; Adar, E.; Liu, Z.; Karahalios, K.G. Datatone: Managing ambiguity in natural language interfaces for data visualization. In Proceedings of the 28th Annual ACM Symposium on User Interface Software & Technology, Charlotte, NC, USA, 11–15 November 2015; pp. 489–500.
  44. Setlur, V.; Battersby, S.E.; Tory, M.; Gossweiler, R.; Chang, A.X. Eviza: A natural language interface for visual analysis. In Proceedings of the 29th Annual Symposium on User Interface Software and Technology, Tokyo, Japan, 16–19 October 2016; pp. 365–377.
  45. Huang, Y.; Wang, Y.; Tam, Y.C. Uniter-based situated coreference resolution with rich multimodal input. arXiv 2021,arXiv:2112.03521.
More
Information
Contributors MDPI registered users' name will be linked to their SciProfiles pages. To register with us, please refer to https://encyclopedia.pub/register : , ,
View Times: 438
Revisions: 3 times (View History)
Update Date: 28 Jun 2023
1000/1000