Your browser does not fully support modern features. Please upgrade for a smoother experience.
Submitted Successfully!
 +1 credit
Thank you for your contribution! You can also upload a video entry or images related to this topic.
For video creation, please contact our Academic Video Service.
| Version | Summary | Created by | Modification | Content Size | Created at | Operation |
|---|---|---|---|---|---|---|
| 1 | Daniel A. Segovia-Cardozo | -- | 2254 | 2023-06-19 12:36:00 | | | |
| 2 | Dean Liu | Meta information modification | 2254 | 2023-06-20 03:43:41 | | | | |
| 3 | Dean Liu | -13 word(s) | 2241 | 2023-06-20 03:46:52 | | |
Video Upload Options
We provide professional Academic Video Service to translate complex research into visually appealing presentations. Would you like to try it?
Cite
If you have any further questions, please contact Encyclopedia Editorial Office.
Segovia-Cardozo, D.A.; Bernal-Basurco, C.; Rodríguez-Sinobas, L. Tipping Bucket Rain Gauges. Encyclopedia. Available online: https://encyclopedia.pub/entry/45791 (accessed on 11 June 2026).
Segovia-Cardozo DA, Bernal-Basurco C, Rodríguez-Sinobas L. Tipping Bucket Rain Gauges. Encyclopedia. Available at: https://encyclopedia.pub/entry/45791. Accessed June 11, 2026.
Segovia-Cardozo, Daniel A., Carlota Bernal-Basurco, Leonor Rodríguez-Sinobas. "Tipping Bucket Rain Gauges" Encyclopedia, https://encyclopedia.pub/entry/45791 (accessed June 11, 2026).
Segovia-Cardozo, D.A., Bernal-Basurco, C., & Rodríguez-Sinobas, L. (2023, June 19). Tipping Bucket Rain Gauges. In Encyclopedia. https://encyclopedia.pub/entry/45791
Segovia-Cardozo, Daniel A., et al. "Tipping Bucket Rain Gauges." Encyclopedia. Web. 19 June, 2023.
Copy Citation
Tipping bucket rain gauges (TBRs) continue to be one of the most widely used pieces of equipment for rainfall monitoring; they are frequently used for the calibration, validation, and downscaling of radar and remote sensing data, due to their major advantages—low cost, simplicity and low-energy consumption.
precipitation monitoring
rainfall measurement biases
rain gauge
1. Introduction
Rainfall is a phenomenon that has attracted the interest of human beings since ancient times; researchers have tried to measure it and to understand all the processes linked to it. The earliest reference to a rain gauge was in India, by Kautilya, in the fourth century B.C.; however, references regarding its use in Europe started in the 17th century in Italy, where Benedetto Castelli developed isolated experiments with a non-recording rain gauge in around 1639 and Sir Christopher Wren developed the earliest recording instrument [1]. Since then, this interest has grown, and nowadays, rainfall monitoring, research, and forecasting (calibration/validation) are of general interest to better understand the hydrological cycle and subjects that depend on water and precipitation, such as irrigation, hydrological research, water resource management, flood risk, flood alert, flood and weather forecast, hydraulic structure design, urban planning, industry, and a large number of human interest activities [2][3][4][5][6][7][8][9][10]. Human interest in precipitation monitoring has grown with technological development and the increase in human population, which demands increasingly more resources, generating stress on natural hydrological systems. Thus, hydrological research is gaining interest not only in the scientific community, but also in governmental institutions, with unprecedented support [11]. However, hydrologic systems are complex and to better address hydrological research, modeling, and forecasting, accurate data, and if possible, data obtained with a high space–time frequency are needed to understand and explain the nature of dynamical hydrologic systems and to help with decision making aimed at mitigating flood risk, among other branches of hydrological research [11][12][13][14][15][16].
Moreover, the goals of the current International Hydrologic Scientific Decade 2013–2022 highlight these challenges, and call for the development of new and innovative monitoring techniques to improve hydrologic monitoring platforms, networks, and databases in order to obtain more reliable data [12][15].
Among the different hydrological variables, rainfall monitoring is one of the most important factors in hydrological research and flood risk management [11][17]. Monitoring rainfall in time and space, together with the availability of accurate rainfall data, is a key issue for managing water resources and forecasting, such as water budget studies, flood frequency analysis, sewer drainage design, surface water hydrology, and flood risk [16][18].
Accurate rainfall data are needed to understand the complexity of hydrological systems for water management and rainfall flood forecast, and to better understand extreme events, which can cause severe damage; these are scarcely documented and lead to difficulties in flood modeling [19][20]. Since precipitation (depth and intensity) is usually estimated by means of temporal averages and spatial interpolations that often do not represent their variability, accurate and reliable results can be achieved if good-quality hydrologic data are provided from a well-designed and well-implemented data collection program [11][21].
Measuring rainfall is not only about instrument accuracy; it is also about the capacity of the data to represent the reality of the hydrological system. Since the rainfall phenomenon is characterized as being dynamic, not only in time but also in space, a proper frequency of data measurement and its spatial representativeness must be considered to achieve better results. As [22] commented, the starting point in gaining a good hydrological understanding is accurate rainfall measurement and forecasting with useful lead times. Nonetheless, instrument accuracy is a main factor to be considered, since most of the instruments used to measure rainfall are subject to measurement biases that can be reduced with proper equipment management [2].
2. Tipping Bucket Rain Gauges and Their Measurement Uncertainties
Among all the different rainfall measurement sensors, TBRs are the most widely used worldwide due to their simple manufacturing structure, which is based on an electric pulse, a magnetic reed switch mechanism, and a counter [2]. TBRs include a receiver (a funnel) that collects rainwater into a bucket, which is one-half of a two-bucket receptacle, pivoted on a cylindrical axis, that tips once the upper bucket fills up to a specified water amount (tipping volume, Vt) and raises the lower bucket into a position under the waterfall line, where it will begin to fill at the same time as the other bucket empties. In this movement, a magnet located in the tipping bucket mechanism generates an output signal through a magnetic reed switch to a recorder, and each pulse is set as a nominal amount of rainfall according to a fixed Vt, which can be set by two calibration stop screws (one for each bucket; Figure 1) [2][23][24].
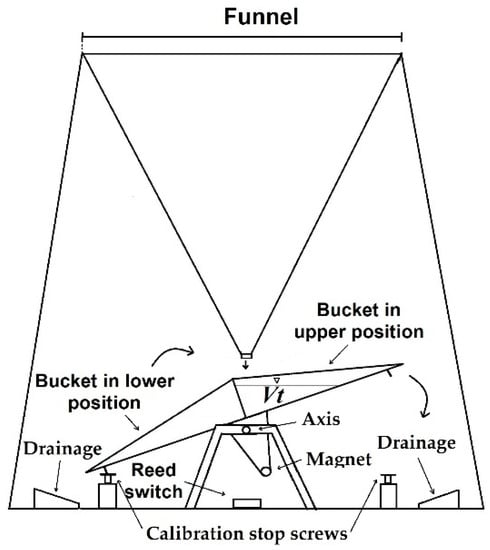
Figure 1. Tipping bucket rain gauge.
TBRs have become one of the most extensive rain gauges, due to their simple manufacturing structure, low cost of production, and energy-saving capacity (a key element for the manufacturing of most weather instruments), being commonly used by National Meteorological Services, airports, industries, farmers, and private individuals to measure the rain depth and intensity [2][23][25]. In hydrological research, they are the most common gauges used to measure precipitation, which is one of the main variables for runoff models, calibration of distributed precipitation measurements [3][4][26], downscaling of remote sensing precipitation models [6][27], radar calibration [7][28][29], basin water balance, flood models [30], structure design, and profitability in different projects (hydroelectrical generation, dams, irrigation, city planning, etc.) [2][9].
Despite the advantages of TBRs, their main drawbacks are due to measurement errors and uncertainties originating in the operation of the equipment itself, as well as by external agents, which impacts on measurement reliability. Numerous studies in recent years have focused on explaining the nature of these measurement biases and have proposed different calibration methodologies and strategies to reduce the measurement uncertainty in TBRs, and some book chapters have addressed this topic [31][32]. However, there are no review articles on TBR measurement uncertainties, calibration, or error reduction strategies. This is the main objective, with the purpose of gathering the knowledge developed in the area and making it more accessible.
According to [32], all instruments have biases and uncertainties, but in precipitation, their quantification and adjustment are more complex than for other environmental variables due to the variability of hydrometeors. However, this aspect is often forgotten by managers of operational monitoring networks and data users; consequently, biases are forwarded through applications or modeling, resulting in a lack of reliability [26][33][34]. These biases are usually considered by correction models that modify the measured precipitation, adding biases generated by wind, wetting, evaporation, and mechanical biases [35].
TBR rain measurements are affected by systematic biases due to instrumental, environmental, and management sources. In general, an underestimation of total rainfall can be observed, due to the difficulty of TBRs to catch the exact amount of water falling over the projection of the measurement area on the ground (wind, evaporation, splashing, and wetting phenomena) and to correctly measure the amount of water collected by its funnel (mechanical biases). In TBRs, the main sources of measurement biases are those caused by wind and mechanical biases [32][36].
2.1. Instrumental Error
The mechanical characteristics that benefit the operation of TBRs also generate a systematic mechanical bias that underestimates rainfall as the rainfall intensity (RI) increases. According to [24], this phenomenon is due to the water lost during the tipping movement of the buckets. During this movement, some water is not measured since the movement starts at that instant when a given bucket’s volume is reached. However, the bucket tipping rotation requires an amount of time that generates a time window where some rainwater is added as an unmeasured surplus (Figure 2). In addition, according to [2], there is another source of surplus caused by the drop triggering the tipping movement (D), with a certain fraction of its volume that exceeds the Vt, both related to RI. As the RI increases, the water flow in the funnel and the size of D increases. However, the surplus due to D can be considered negligible in contrast to that caused by the time the bucket takes to tip [2][37].
Figure 2. Water falling on the bucket during the tipping movement as an unmeasured surplus. Source: [2].
The volume of water lost during the tipping movement is related to the flow rate out of the funnel which, in turn, depends on the RI. If a constant increase in the RI is assumed, the flow rate would increase as the RI does, and therefore, so would the losses. However, they also depend on the tipping time, which decreases as the RI increases (especially at a high RI), caused by water constantly falling and impacting the rocker arm, accelerating its movement, which also generates a decrease in the Vt by reducing the kinetic energy needed to tip. The reduction of these two parameters results in a compensation effect, which offsets part of the losses; therefore, the increase in the volume of water lost during the tipping movement as a function of the increase in the RI follows a curved pattern [2][38].
Regarding the effects of the RI in TBR measurements, three regions were observed by [2][38]. The first region corresponds to a very low RI, where the flow rate falling from the funnel orifice is too low that does not have enough time to fall into the bucket in motion, so no extra water is added during the tipping time. In the second region, the flow rate generated by the RI is fast enough to add some water as it drops into the bucket during the tipping time and produces an underestimation in the measurements. The third region is observed at a high RI above a threshold where the drip-falling flow becomes a continuous stream and adds not only unmeasured water to the bucket during the tipping time, but also a constant thrust on the rocker arm; this generates a reduction in the Vt and tipping time, resulting in compensation of the underestimation effect generated by the unmeasured water falling into the bucket during the tipping time.
The magnitude of the biases depends on the TBR design characteristics, such as the size of the funnel orifice, the size of the funnel, the size of the buckets, and the instrument resolution [2][24][39]. For example, these biases are caused by the time the bucket takes to tip, and they will appear after a certain RI, since at a very low RI, the funnel flow rate is too low and the time window generated by the tipping time is not long enough to generate a measurement overshoot, which depends on the TBR characteristics. The magnitude of this no tipping time bias or first region varies from one TBR model to another depending in the specific characteristic, as well as the continuous stream threshold [2].
Since the biases are related to the RI, calibration strategies as a function of the RI are used to reduce their impact on the measurement. Likewise, there are other sources of instrumental error in the buckets’ self-functioning mechanism: drag variations, friction force variation in the fixed axis, variability in D size, the interaction of falling droplets with tipping bucket balance, changes in falling water direction, leveled errors, an incomplete evacuation of water from the tipping bucket or funnel, the buckets’ volume variation, water origin, initial conditions of the buckets, wetting loss to the internal wall of the gauging funnel, evaporation, splashing, mechanical blockages, and logging errors. These sources do not depend on the RI and calibration cannot avoid them; however they can be reduced by proper equipment management and maintenance [2][24][30][40][41][42][43]. Moreover, a random unexplained variation, not related to the RI, has been identified by several authors [2][30][36][40][41][44][45][46][47][48], which can be significant and could be explained by a combination of the sources previously mentioned and other sources originating from environmental agents (e.g., wind) and human error [2][40]. Nevertheless, as [39] affirmed, these random errors are small compared to those derived from RI or wind.
2.2. External Sources of Bias
These are the biases caused by external agents, not directly related to the TBR operating mechanism, such as losses from evaporation, wetting, splashing, funnel clogging, colonization for animals or insects, and wind effects [32][36][45][46][48][49][50][51][52]. Among all of these, the last one is the most relevant source of error in many precipitation monitoring sensors. According to [23], the effect of wind is caused by the interaction between the gauge body and the airflow. The rain gauge behaves as a “bluff-body” when impacted by the wind that produces airflow deformations around it, which results in significant acceleration and vertical velocity components above the collector that deviate the trajectories of the hydrometeors (Figure 3) and induces a significant reduction in their performance [23][32][43][51][53].
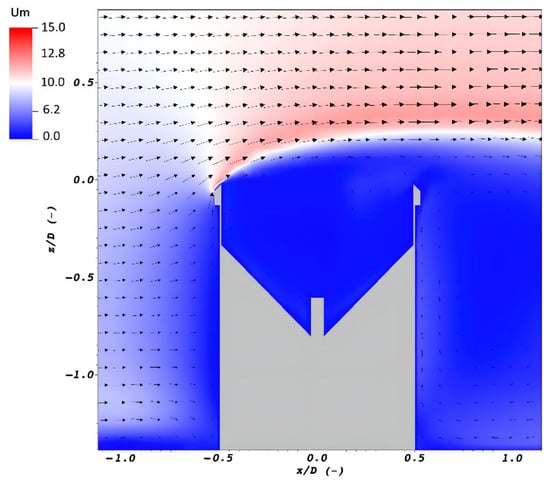
Wind biases can cause approximately 2–10% and 10–50% undercatch for liquid and solid precipitation, respectively. It depends on the gauge geometry, the wind speed, the type of precipitation, and its characteristics such as particle distribution, size, and precipitation intensity [51].
2.3. TBR Management and Limitations
TBR biases are generally defined as instrumental and environmental; however, researchers also consider TBR management as an important source of measurement biases, since proper TBR management can either reduce biases or favor their effects. The importance of instrumental management is not usually taken into account during the operation of rainfall monitoring networks or for data users; thus, errors propagate through applications or modeling and the results are affected by limited reliability, since most historic recorded rainfall series have never been corrected and are affected by significant biases and uncertainties [23][26][33][34].
References
- Biswas, A.K. History of Hydrology; Elsevier Science Limited: Amsterdam, The Netherlands, 1970.
- Segovia-Cardozo, D.A.; Rodríguez-Sinobas, L.; Díez-Herrero, A.; Zubelzu, S.; Canales-Ide, F. Understanding the Mechanical Biases of Tipping-Bucket Rain Gauges: A Semi-Analytical Calibration Approach. Water 2021, 13, 2285.
- Gnecco, I.; Palla, A.; La Barbera, P. A dimensionless approach for the runoff peak assessment: Effects of the rainfall event structure. Hydrol. Earth Syst. Sci. 2018, 22, 943–956.
- Villarini, G.; Mandapaka, P.V.; Krajewski, W.F.; Moore, R.J. Rainfall and sampling uncertainties: A rain gauge perspective. J. Geophys. Res. Atmos. 2008, 113, D11102.
- Agarwal, A.; Mishra, S.K.; Ram, S.; Singh, J.K. Simulation of Runoff and Sediment Yield using Artificial Neural Networks. Biosyst. Eng. 2006, 94, 597–613.
- Tapiador, F.J.; Navarro, A.; García-Ortega, E.; Merino, A.; Sánchez, J.L.; Marcos, C.; Kummerow, C. The Contribution of Rain Gauges in the Calibration of the IMERG Product: Results from the First Validation over Spain. J. Hydrometeorol. 2020, 21, 161–182.
- Borup, M.; Grum, M.; Linde, J.J.; Mikkelsen, P.S. Dynamic gauge adjustment of high-resolution X-band radar data for convective rain storms: Model-based evaluation against measured combined sewer overflow. J. Hydrol. 2016, 539, 687–699.
- Ochoa-Rodriguez, S.; Wang, L.P.; Willems, P.; Onof, C. A Review of Radar-Rain Gauge Data Merging Methods and Their Potential for Urban Hydrological Applications. Water Resour. Res. 2019, 55, 6356–6391.
- Sexton, A.M.; Sadeghi, A.M.; Zhang, X.; Srinivasan, R.; Shirmohammadi, A. Using NEXRAD and rain gauge precipitation data for hydrologic calibration of SWAT in a northeastern watershed. Trans. ASABE 2010, 53, 1501–1510.
- Sun, X.; Mein, R.G.; Keenan, T.D.; Elliott, J.F. Flood estimation using radar and raingauge data. J. Hydrol. 2000, 239, 4–18.
- Weng, S.; Zhai, D.; Yang, X.; Hu, X. A ZigBee wireless networking for remote sensing applications in hydrological monitoring system. In Proceedings of the Seventh International Conference on Electronics and Information Engineering, Nanjing, China, 23 January 2017; Volume 10322, pp. 442–450.
- Hund, S.V.; Johnson, M.S.; Keddie, T. Developing a Hydrologic Monitoring Network in Data-Scarce Regions Using Open-Source Arduino Dataloggers. Agric. Environ. Lett. 2016, 1, 160011.
- Sun, G.; Hu, T.; Yang, G.; Jia, J. Real-time and clock-shared rainfall monitoring with a wireless sensor network. Comput. Electron. Agric. 2015, 119, 1–11.
- Lama, G.F.C.; Crimaldi, M.; Pasquino, V.; Padulano, R.; Chirico, G.B. Bulk drag predictions of riparian arundo donax stands through UAV-acquired multispectral images. Water 2021, 13, 1333.
- Hrachowitz, M.; Savenije, H.H.G.; Blöschl, G.; McDonnell, J.J.; Sivapalan, M.; Pomeroy, J.W.; Arheimer, B.; Blume, T.; Clark, M.P.; Ehret, U.; et al. A decade of Predictions in Ungauged Basins (PUB)—A review. Hydrol. Sci. J. 2013, 58, 1198–1255.
- Segovia-Cardozo, D.A.; Rodríguez-Sinobas, L.; Canales-Ide, F.; Zubelzu, S. Design and field implementation of a low-cost, open-hardware platform for hydrological monitoring. Water 2021, 13, 3099.
- Han, K.; Zhang, D.; Bo, J.; Zhang, Z. Hydrological Monitoring System Design and Implementation Based on IOT. Phys. Procedia 2012, 33, 449–454.
- Abu Salleh, N.S.; Mohd Aziz, M.K.B.; Adzhar, N. Optimal Design of a Rain Gauge Network Models: Review Paper. J. Phys. Conf. Ser. 2019, 1366, 012072.
- Eltner, A.; Sardemann, H.; Kröhnert, M.; Schwalbe, E. Camera based low-cost system to monitor hydrological parameters in small catchments. Geophys. Res. Abstr. EGU Gen. Assem. 2017, 19, 2017–6698.
- Morán-Tejeda, E.; Llorente-Pinto, J.M.; Ceballos-Barbancho, A.; Tomás-Burguera, M.; Azorín-Molina, C.; Alonso-González, E.; Revuelto, J.; Herrero, J.; López-Moreno, J.I. The significance of monitoring high mountain environments to detect heavy precipitation hotspots: A case study in Gredos, Central Spain. Theor. Appl. Climatol. 2021, 146, 1175–1188.
- Paul, J.D.; Buytaert, W. Citizen Science and Low-Cost Sensors for Integrated Water Resources Management; Elsevier Ltd.: Amsterdam, The Netherlands, 2018; Volume 3.
- Hapuarachchi, H.A.P.; Wang, Q.J.; Pagano, T.C. A review of advances in flash flood forecasting. Hydrol. Process. 2011, 25, 2771–2784.
- Lanza, L.G.; Cauteruccio, A.; Stagnaro, M. Chapter 4—Rain Gauge Measurements. In Rainfall; Elsevier: Amsterdam, The Netherlands, 2022; pp. 77–108. ISBN 978012822544-8.
- Marsalek, J. Calibration of the tipping-bucket raingage. J. Hydrol. 1981, 53, 343–354.
- WMO. WMO Guide to Meteorological Instruments and Methods of Observation; WMO-No. 8; World Meteorological Organization: Geneva, Switzerland, 2008.
- Habib, E.H.; Meselhe, E.A.; Aduvala, A. V Effect of local errors of tipping-bucket rain gauges on rainfall-runoff simulations. J. Hydrol. Eng. 2008, 13, 488–496.
- Bowman, K.P. Comparison of TRMM precipitation retrievals with rain gauge data from ocean buoys. J. Clim. 2005, 18, 178–190.
- Ochoa-Rodriguez, S.; Wang, L.; Pfeifer, M.; Li, X.; Onof, C.; Maksimović, Č.; Pool, M.; Didszun, J. X-band radar monitoring campaign in Central London: An experiment to assess and improve the applicability of a low-cost portable X-band radar to urban hydrology. In Proceedings of the 2014 International Weather Radar and Hydrology Symposium, Washington, DC, USA, 7–9 April 2014.
- Todini, E. A Bayesian technique for conditioning radar precipitation estimates to rain-gauge measurements. Hydrol. Earth Syst. Sci. 2001, 5, 187–199.
- Habib, E.; Krajewski, W.F.; Kruger, A. Sampling errors of tipping-bucket rain gauge measurements. J. Hydrol. Eng. 2001, 6, 159–166.
- Baire, Q.; Dobre, M.; Piette, A.-S.; Lanza, L.; Cauteruccio, A.; Chinchella, E.; Merlone, A.; Kjeldsen, H.; Nielsen, J.; Østergaard, P.F. Calibration Uncertainty of Non-Catching Precipitation Gauges. Sensors 2022, 22, 6413.
- Lanza, L.G.; Cauteruccio, A. Chapter 1—Accuracy assessment and intercomparison of precipitation measurement instruments. In Precipitation Science; Elsevier: Amsterdam, The Netherlands, 2022; pp. 3–35. ISBN 9780128229736.
- La Barbera, P.; Lanza, L.G.; Stagi, L. Tipping bucket mechanical errors and their influence on rainfall statistics and extremes. Water Sci. Technol. 2002, 45, 1–9.
- Valík, A.; Brázdil, R.; Zahradníček, P.; Tolasz, R.; Fiala, R. Precipitation measurements by manual and automatic rain gauges and their influence on homogeneity of long-term precipitation series. Int. J. Climatol. 2021, 41, E2537–E2552.
- World Meteorological Organization General meteorological standards and recommended practices. In Technical Regulations; WMO Publication No. 49; WMO: Geneva, Switzerland, 2019; Volume I.
- Duchon, C.E.; Biddle, C.J. Undercatch of tipping-bucket gauges in high rain rate events. Adv. Geosci. 2010, 25, 11–15.
- Humphrey, M.D.; Istok, J.D.; Lee, J.Y.; Hevesi, J.A.; Flint, A.L. A New Method for Automated Dynamic Calibration of Tipping-Bucket Rain Gauges. J. Atmos. Ocean. Technol. 1997, 14, 1513–1519.
- Luyckx, G.; Berlamont, J. Simplified method to correct rainfall measurements from tipping bucket rain gauges. Urban Drain. Model. 2001, 767–776.
- Fankhauser, R. Measurement properties of tipping bucket rain gauges and their influence on urban runoff simulation. Water Sci. Technol. 1997, 36, 7–12.
- Sypka, P. Dynamic real-time volumetric correction for tipping-bucket rain gauges. Agric. For. Meteorol. 2019, 271, 158–167.
- Ciach, G.J. Local random errors in tipping-bucket rain gauge measurements. J. Atmos. Ocean. Technol. 2003, 20, 752–759.
- Vasvári, V. Calibration of tipping bucket rain gauges in the Graz urban research area. Atmos. Res. 2005, 77, 18–28.
- Colli, M.; Pollock, M.; Stagnaro, M.; Lanza, L.G.; Dutton, M.; O’Connell, E. A Computational Fluid-Dynamics assessment of the improved performance of aerodynamic rain gauges. Water Resour. Res. 2018, 54, 779–796.
- Colli, M.; Lanza, L.G.; La Barbera, P.; Chan, P.W. Measurement accuracy of weighing and tipping-bucket rainfall intensity gauges under dynamic laboratory testing. Atmos. Res. 2014, 144, 186–194.
- Sevruk, B.; Ondrás, M.; Chvíla, B. The WMO precipitation measurement intercomparisons. Atmos. Res. 2009, 92, 376–380.
- Ren, Z.; Li, M. Errors and correction of precipitation measurements in China. Adv. Atmos. Sci. 2007, 24, 449–458.
- Molini, A.; La Barbera, P.; Lanza, L.G.; Stagi, L. Rainfall intermittency and the sampling error of tipping-bucket rain gauges. Phys. Chem. Earth Part C Sol. Terr. Planet. Sci. 2001, 26, 737–742.
- Hoffmann, M.; Schwartengräber, R.; Wessolek, G.; Peters, A. Comparison of simple rain gauge measurements with precision lysimeter data. Atmos. Res. 2016, 174–175, 120–123.
- Michelson, D.B. Systematic correction of precipitation gauge observations using analyzed meteorological variables. J. Hydrol. 2004, 290, 161–177.
- Cauteruccio, A.; Colli, M.; Freda, A.; Stagnaro, M.; Lanza, L.G. The role of free-stream turbulence in attenuating the wind updraft above the collector of precipitation gauges. J. Atmos. Ocean. Technol. 2020, 37, 103–113.
- Cauteruccio, A.; Lanza, L.G. Parameterization of the collection efficiency of a cylindrical catching-type rain gauge based on rainfall intensity. Water 2020, 12, 3431.
- Molini, A.; Lanza, L.G.; La Barbera, P. Improving the accuracy of tipping-bucket rain records using disaggregation techniques. Atmos. Res. 2005, 77, 203–217.
- Cauteruccio, A.; Brambilla, E.; Stagnaro, M.; Lanza, L.G.; Rocchi, D. Experimental evidence of the wind-induced bias of precipitation gauges using particle image velocimetry and particle tracking in the wind tunnel. J. Hydrol. 2021, 600, 126690.
More
Information
Subjects:
Meteorology & Atmospheric Sciences
Contributors
MDPI registered users' name will be linked to their SciProfiles pages. To register with us, please refer to https://encyclopedia.pub/register
:
View Times:
2.1K
Revisions:
3 times
(View History)
Update Date:
20 Jun 2023
Table of Contents


Notice
You are not a member of the advisory board for this topic. If you want to update advisory board member profile, please contact office@encyclopedia.pub.
OK
Confirm
Only members of the Encyclopedia advisory board for this topic are allowed to note entries. Would you like to become an advisory board member of the Encyclopedia?
Yes
No
${ textCharacter }/${ maxCharacter }
Submit
Cancel
Back
Comments
${ item }
|
${ item.createdUser.fullName }
${ item.createdAt }
${ item.vote }
${ item.reply }
Delete
${ reply.createdUser.fullName }
${ reply.createdAt }
${ reply.vote }
Delete
There is no reply to this comment~
${ item.replyTextCharacter }/${ item.replyMaxCharacter }
Submit
Cancel
More
No more~
There is no comment~
${ textCharacter }/${ maxCharacter }
Submit
Cancel
${ selectedItem.replyTextCharacter }/${ selectedItem.replyMaxCharacter }
Submit
Cancel
Confirm
Are you sure to Delete?
Yes
No