Your browser does not fully support modern features. Please upgrade for a smoother experience.
Submitted Successfully!
 +1 credit
Thank you for your contribution! You can also upload a video entry or images related to this topic.
For video creation, please contact our Academic Video Service.
| Version | Summary | Created by | Modification | Content Size | Created at | Operation |
|---|---|---|---|---|---|---|
| 1 | Imran Ashraf | -- | 1102 | 2023-05-31 02:50:11 | | | |
| 2 | Dean Liu | -3 word(s) | 1099 | 2023-05-31 03:20:36 | | |
Video Upload Options
We provide professional Academic Video Service to translate complex research into visually appealing presentations. Would you like to try it?
Cite
If you have any further questions, please contact Encyclopedia Editorial Office.
Shafi, I.; Khan, H.; Farooq, M.S.; Diez, I.D.L.T.; Miró, Y.; Galán, J.C.; Ashraf, I. Wind–Solar Hybrid System Modeling. Encyclopedia. Available online: https://encyclopedia.pub/entry/45027 (accessed on 25 July 2026).
Shafi I, Khan H, Farooq MS, Diez IDLT, Miró Y, Galán JC, et al. Wind–Solar Hybrid System Modeling. Encyclopedia. Available at: https://encyclopedia.pub/entry/45027. Accessed July 25, 2026.
Shafi, Imran, Harris Khan, Muhammad Siddique Farooq, Isabel De La Torre Diez, Yini Miró, Juan Castanedo Galán, Imran Ashraf. "Wind–Solar Hybrid System Modeling" Encyclopedia, https://encyclopedia.pub/entry/45027 (accessed July 25, 2026).
Shafi, I., Khan, H., Farooq, M.S., Diez, I.D.L.T., Miró, Y., Galán, J.C., & Ashraf, I. (2023, May 31). Wind–Solar Hybrid System Modeling. In Encyclopedia. https://encyclopedia.pub/entry/45027
Shafi, Imran, et al. "Wind–Solar Hybrid System Modeling." Encyclopedia. Web. 31 May, 2023.
Copy Citation
Wind–solar hybrid systems combine solar photovoltaic cells and wind turbines to produce power from both solar and wind energy.
artificial neural network
energy prediction
wind–solar prediction
1. Solar-Panel-Array Modeling
Solar panels interconnected to produce power is called a solar array. A software named hybrid optimization of multiple energy resources (HOMER) is an optimization tool which is used to design micropower systems. It basically optimizes the capacity of items using techno-economic analysis. In this software, a wide range of optimization can be performed in fields of solar energy systems, wind energy systems, hydro energy systems, and conventional generator systems, which can be modeled and optimized. The output of the photovoltaic cell in HOMER can be calculated using Equation.
where Pout is the output of array, Pr is the rated capability, f is the degradation factor as a percentage, GT is solar radiation incident to the array in W/m2W/m2, GT,ST shows solar radiation under standard conditions, αp is the temperature coefficient in %∘°C, TC is the panel temperature, and TC,ST indicates the panel temperature under standard conditions.
GT,ST is normally taken as 1 W/m2W/m2. The radiations in the first five months of the year 2022 are given in Figure 1.
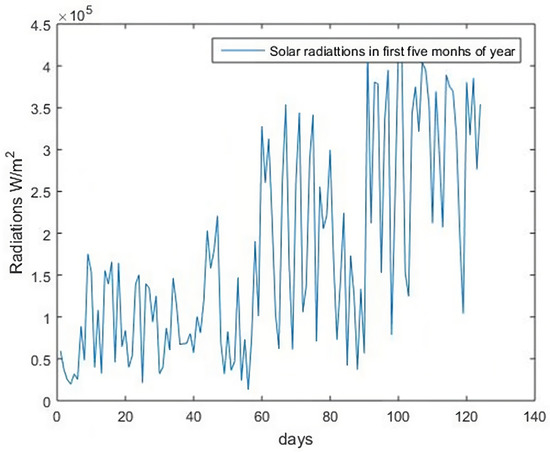
Figure 1. Solar radiations in January–May 2022.
The efficiency of solar panels decreases with temperature and if no solar tracking system is used then the solar panels are held to a suitable inclination which is fixed. The suitable inclination angles for every month are discussed in Table 1. In addition, if there are alternating load types then converters can be used which convert AC into DC by a process called rectification.
Table 1. Optimum angle and solar irradiance for each month.
| Month | θ� | Monthly kW/m22 |
|---|---|---|
| January | 57 | 209.6 |
| February | 48 | 198 |
| March | 43 | 229.9 |
| April | 18 | 232 |
| May | 6 | 250.8 |
| June | 0 | 248 |
| July | 5 | 251 |
| August | 13 | 238 |
| September | 28 | 218.6 |
| October | 43 | 216 |
| November | 54 | 200 |
| December | 59 | 202 |
| Yearly radiation kW/m22 | 2694 | |
2. Solar Radiance
To find the optimal angle of inclination, the solar energy received on 1 m2m2 panel at different instances of the year at different angles (between 0∘°–90∘°) is derived with the help of simple integral calculations. The value of the optimum is given in Table 2. Using these angles, one can achieve maximum output from solar panels.
3. Power Produced by Wind Turbines
To calculate wind speed, there are three steps. The first step is to find the wind speed approaching the turbine using a logarithmic law which is used to find the air speed at a hub height. Then, the generated output of the turbine is calculated through a comparison of the characteristic curve provided by the manufacturer, measured wind speed, and standard air density at a height equal to the hub height. Finally, the final output is adjusted for the actual air density. Wind speed at the corresponding hub height is calculated as:
where Vℎ is the wind speed at the hub height in m, V is the wind speed in m/s, f is the degradation factor as a percentage, Hℎ is the hub height, H is the height of the wind-speed measurement point and α is the logarithmic law exponent.
The actual output of the wind turbine is calculated by adjusting actual air density conditions using
In the above Equation, ρ is the air density in kg/m33, ρST is the standard air density under standard atmospheric conditions, PST is the power produced by a wind turbine in kW under the standard conditions used by the turbine power curve, which is provided by manufacturers in Figure 2, below.
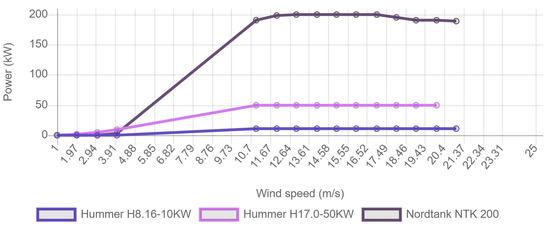
Figure 2. Power vs wind speed curve for different rated wind turbines.
As mentioned previously, the ρST is the density of air in kg/m3kg/m3, its value is 1.225 kg/m3kg/m3 at standard conditions; A is the swept area of the wind-turbine blades in m2m2, which can be calculated by rotor diameter; and v is the upstream air speed in m/s. It is clear from the equation that wind power is cubic proportional to wind speed. The wind density measured at various locations is less diverse in nature as compared to wind speed. The wind-power capacity is proportional to the wind speed throughout the year [1]. Figure 2 provides a useful visualization of the relationship between the wind speed and power output of different turbines with a rated capacity of 10 kW, 50 kW, and 200 kW. The data required for this comparison was provided by [2]. The 11 m/s wind speed is required for rated outputs 10, 50, and 200 kW wind turbines and produces almost little to no power during 0–4 m/s wind speeds. Turbines are bound and are not allowed to produce power higher than that for which they are designed to avoid failures and this is achieved by adjusting blade angles. From this, it is apparent that the installation of wind turbines should only be carried out at locations with a minimum wind speed of 4 m/s, and a maximum of nearly 21 m/s, while the average should be around 11 m/s. However, these values can change depending on the design of the wind turbines. Furthermore, safety mechanisms in the case of high wind speed are necessary as well. Our model can help in the prediction of such high wind speeds.
3. Conclusions
Wind–solar hybrid systems are the most suitable type of energy extraction system from renewable energy resources and can address the energy shortage, which occurred due to development in the modern world. Hybrid systems are not only environmentally friendly but are more reliable than any other standalone system, as evident from the literature review. A fully connected feed-forward back-propagation neural network with a single hidden layer and a suitable number of neurons at the input, hidden, and output layers were used to predict the wind speed and optimum angle for PV panels with an MAPE of 2.08%. The number of neurons in the hidden layer was set to 50 after seeing no improvement after further increases. The learn gradient descent learning function with momentum weight (GDM) was used as an adaptation function and logsig as an activation function. However, it is to be noted that the accuracy is dependent on the reliability of the training data that is used to train the Levenberg–Marquardt (LM) training function. A trained LM function converges better and shows better results than Gauss–Newton; however, still, flaws in data and network design can compromise the accuracy of results. By predicting the wind speeds, optimal power generation through wind turbines is achieved along with protection from high wind speeds. In addition, optimum angle prediction allows for optimal power generation through PV panels.
References
- Lei, M.; Shiyan, L.; Chuanwen, J.; Hongling, L.; Yan, Z. A review on the forecasting of wind speed and generated power. Renew. Sustain. Energy Rev. 2009, 13, 915–920.
- Bauer, L.; Matysk, S. Compare Power Curves of Wind Turbines. 2023. Available online: https://en.wind-turbine-models.com/powercurves (accessed on 4 April 2023).
More
Information
Contributors
MDPI registered users' name will be linked to their SciProfiles pages. To register with us, please refer to https://encyclopedia.pub/register
:
View Times:
814
Revisions:
2 times
(View History)
Update Date:
31 May 2023
Table of Contents


Notice
You are not a member of the advisory board for this topic. If you want to update advisory board member profile, please contact office@encyclopedia.pub.
OK
Confirm
Only members of the Encyclopedia advisory board for this topic are allowed to note entries. Would you like to become an advisory board member of the Encyclopedia?
Yes
No
${ textCharacter }/${ maxCharacter }
Submit
Cancel
Back
Comments
${ item }
|
${ item.createdUser.fullName }
${ item.createdAt }
${ item.vote }
${ item.reply }
Delete
${ reply.createdUser.fullName }
${ reply.createdAt }
${ reply.vote }
Delete
There is no reply to this comment~
${ item.replyTextCharacter }/${ item.replyMaxCharacter }
Submit
Cancel
More
No more~
There is no comment~
${ textCharacter }/${ maxCharacter }
Submit
Cancel
${ selectedItem.replyTextCharacter }/${ selectedItem.replyMaxCharacter }
Submit
Cancel
Confirm
Are you sure to Delete?
Yes
No