Submitted Successfully!
To reward your contribution, here is a gift for you: A free trial for our video production service.
Thank you for your contribution! You can also upload a video entry or images related to this topic.
Version Summary Created by Modification Content Size Created at Operation
1 -- 3213 2023-01-06 15:19:50 |
2 format corrected. Meta information modification 3213 2023-01-09 02:16:58 | |
3 rollback to version 1 Meta information modification 3213 2023-01-09 02:21:24 | |
4 format corrected. -1 word(s) 3212 2023-01-09 03:15:25 | |
5 format corrected. Meta information modification 3212 2023-01-09 03:16:15 |

Video Upload Options

Do you have a full video?

Confirm

Are you sure to Delete?
Cite
If you have any further questions, please contact Encyclopedia Editorial Office.
Wong, L.;  Mak, S.;  Goh, B.;  Lee, W. Infrared Spectroscopy in Biological Studies. Encyclopedia. Available online: https://encyclopedia.pub/entry/39846 (accessed on 17 May 2024).
Wong L,  Mak S,  Goh B,  Lee W. Infrared Spectroscopy in Biological Studies. Encyclopedia. Available at: https://encyclopedia.pub/entry/39846. Accessed May 17, 2024.
Wong, Le-Wei, Siow-Hui Mak, Bey-Hing Goh, Wai-Leng Lee. "Infrared Spectroscopy in Biological Studies" Encyclopedia, https://encyclopedia.pub/entry/39846 (accessed May 17, 2024).
Wong, L.,  Mak, S.,  Goh, B., & Lee, W. (2023, January 06). Infrared Spectroscopy in Biological Studies. In Encyclopedia. https://encyclopedia.pub/entry/39846
Wong, Le-Wei, et al. "Infrared Spectroscopy in Biological Studies." Encyclopedia. Web. 06 January, 2023.
Infrared Spectroscopy in Biological Studies
Edit

Infrared (IR) radiation is electromagnetic radiation with wavenumbers ranges of 12,500–10 cm−1. The IR region in the electromagnetic spectrum can be subdivided into three spectral regions, namely near-IR (NIR, 12,500–4000 cm−1), mid-IR (MIR, 4,000–400 cm−1), and far-IR (FIR, 400–10 cm−1). Accumulating evidence has shown that IR radiation has been widely investigated for biological studies and effects. The interaction between IR radiation and biomolecules enables to study the specific molecular vibrations of the sample constituents. IR spectroscopy, specifically MIR, has been used to investigate large numbers of biological samples such as cells, tissues, organ, and biofluids, providing qualitative and quantitative information that could be used for detection and classification. Notably, FTIR spectroscopy is considered a promising tool to study and analyze biological samples using MIR radiation. 

infrared spectroscopy FTIR biological studies

1. Infrared (IR) Spectroscopy

IR spectroscopy measures the interaction between IR radiation and matter. IR radiation is electromagnetic radiation with wavelengths and wavenumbers ranges of 0.78–1000 µm and 12,500–10 cm−1, respectively. The IR region in the electromagnetic spectrum can be subdivided into three spectral regions based on the wavelength and wavenumber: near-IR (NIR), mid-IR (MIR), and far-IR (FIR). Table 1 shows the subdivision of IR regions of the electromagnetic spectrum into NIR, MIR, and FIR with their corresponding wavelengths and wavenumbers  [1]. Applications of these IR spectral regions in the biological field are briefly discussed in the following sections.

1.1. Far-Infrared (FIR)

The FIR region is commonly defined as the region from 400 to 10 cm−1. On the other hand, the terahertz (THz) region refers to the spectrum range from 333 to 3.33 cm−1, which overlaps with the FIR region. THz and FIR spectroscopy principles are alike; the difference in names results from the instruments used according to experimental requirements [2].
FIR or THz radiation has been widely used in biomedical research, for example, by using cancer cell lines or cancer patients to establish cancer phototherapies [3][4][5]. FIR or THz radiation is highly sensitive to water content, hence making FIR or THz spectroscopy a potential screening tool for cancer diagnosis, based on the difference in the water content and water binding status in normal and cancerous tissues [6]. With increased water content in cancerous tissues compared to that in normal tissues, Vafapour et al. [7] were able to differentiate between healthy and cancerous colon tissues based on variations in their reflectance spectra. Kawashima et al. [8] suggested that the development of fibrous tissue around the malignant liver tumor tissue leads to water loss, thus giving rise to a higher permeability of THz transmission in the imaging experiments. FIR or THz radiation has been proven to be useful in bioimaging. The radiation also exerts beneficial biological effects by producing thermal and non-thermal effects, including strengthening cardiovascular function by enhancing vessel endothelial function, improving vasodilation, a vessel circulation, and angiogenesis; promoting wound healing [9][10]; treating postoperative lymphedema [4][11][12][13]; reducing postoperative pain [14]; suppressing skin photoaging [15][16]; etc.
In addition, FIR is more susceptible to the vibration modes of peptide skeletons and hydrogen bonds compared to MIR spectroscopy, it is therefore considered ideal for examining highly ordered protein structures, such as fibril, gels, and virus-like particles, as well as protein dynamics [17][18]. Several features of peptides and polyamides were linked to distinct modes of vibration according to their characterization based on spectroscopic data. However, proteins such as hemoglobin, lysozymes, and serum albumin showed only weak and broad absorption bands in the FIR region, hence requiring complex and time-consuming calculations and simulations to interpret the data obtained [18].

1.2. Mid-Infrared (MIR)

MIR (4000–400 cm−1) is commonly used in studying biological samples because most molecule bands, such as proteins, lipids, sugars, and nucleic acids, are present in the MIR region. According to Beer–Lambert’s law, molecular absorbance in this region is proportional to the concentration without light scattering; the measurement of these biological samples can evaluate any change in composition or structure [19]. In the biomedical area, IR spectroscopy, specifically MIR, has been used to investigate large numbers of cells, tissues, and organs, providing qualitative and quantitative information that could be used for detection and classification. This technology can be used in numerous disciplines of biodiagnostics, not only to characterize diseases and monitor drug delivery but also to reveal the biomolecular framework underlying the particular alterations processes and structures. IR spectroscopy could also be applied in forensic science to screen typical human bodily fluids collected from crime scenes as routine confirmation [20]. Notably, FTIR spectroscopy is considered an excellent method to study and analyze biological samples using MIR radiation [21].

1.3. Near-Infrared (NIR)

NIR spectroscopy (12,500–4000 cm−1) was exclusively employed as an accessory to other optical equipment before the advent of light-fiber optics and monochromator detectors; since then, NIR spectroscopy has become a tool that could be applied in various scientific disciplines, including medicine [22]. NIR applications in bioscience include medical monitoring [23], cell-related studies, analysis of bodily fluids and tissues [24], etc.
NIR calibration models for analyzing the cancer markers of prostate carcinoma (PCa) were among the first applications of NIR spectroscopy in cancer diagnosis [25]. Calibration was performed using a novel adaptive method to attenuate metabolically induced covariance between specific biomolecules in PCa cells. In addition to common bodily fluids such as serum and saliva, NIR can also analyze blood oxygen levels. In studies, higher total hemoglobin and water absorption were determined by analyzing NIR absorption between normal and malignant tissues, followed by weaker signals associated with oxygen saturation in lipids and tissue hemoglobin [26]. Furthermore, NIR spectroscopy has been extensively applied to investigate blood glucose content. A study conducted by Henn et al. found that both NIR and MIR can analyze urea and glucose in hemodialysis monitoring. However, MIR is the better tool for monitoring hemodialysis because MIR, coupled to a multi-reflection attenuated total reflection (ATR) cell, can provide access to more analyses of interest, such as lactate, phosphate, and creatinine [27].
With NIR imaging techniques, aqueous solution dispersion can be probed more easily, and changes in structure or concentration in water and proteins can also be monitored simultaneously [2]. However, compared to IR spectroscopy, the strongly overlapping bands generated by NIR spectroscopy are around 10 to 100 times weaker than the corresponding MIR bands [23], resulting in broad absorption profiles that complicate the identification of contributing vibrations [24] and band assignment [23]. Therefore, NIR spectroscopy still faces intense competition from IR spectroscopy, especially in bioanalytical research and the field of medical diagnosis [24].

2. Biomolecular Vibrations and MIR Spectrum

The absorption bands displayed on an IR spectrum can be assigned to specific molecular vibrations of the sample constituents in which most of the biomolecules absorb energies from MIR [28]. In this IR spectral region, the range of 1800–900 cm−1 is called the bio-fingerprint region, where the molecular vibrations in this region are unique for different types of biological samples, including different types of tumors [29][30]. For instance, IR absorption bands of amide I and II observed at 1650 and 1550 cm−1, methylene groups of lipids at 1470–1400 cm−1, stretching vibrations of phosphodiester groups at 1225 and 1080 cm−1, C-OH and C-O stretching of amino acids and carbohydrates at 1155 cm−1 and glycogen at 1030 cm−1 were reported to discriminate the plasma samples of healthy individuals from those with intraepithelial lesion or malignancy (NILM) and squamous intraepithelial lesion (SIL) [30]. In general, MIR regions including the high wavenumber region, which generally corresponds to stretching vibrations such as C-H, N-H, and O-H, together with the low wavenumber region, which correlate to bending and carbon skeleton fingerprint vibrations, characterize the structure of biological samples [31][32]. Table 2 shows the assignments of the main peaks observed in biological IR spectra, based on the literature.
Many studies have introduced FTIR as a promising biophysical tool for protein structural characterization and monitoring dynamic conformational changes [33]. The IR spectra of protein molecules exhibit many characteristic vibrational frequencies. These vibrational frequencies originate mainly from in-plane C-C stretch, C-N stretch, N-C stretch, N-H stretch and bend, CO stretch and bend, CNC and CCN deformation, and out-of-plane CO and N-H bend and CN torsion [38].
Amino acid residues are connected in proteins or polypeptides via amide bonds. In fact, protein secondary structures are attributed to the hydrogen bonds formed between atoms of the polypeptide backbone [39]. The differential hydrogen bonding in amino acids, together with geometric orientations of amide bonds, give rise to individual secondary structural folding in polypeptides (α-helix, β-sheet, and unordered structures), thereby contributing to resolvable absorption bands in the amide I band corresponding to secondary conformations in polypeptides [40][41][42]. Table 3 shows the assignment of protein secondary structures based on the analysis of the IR amide I band [41][43].
The amide I and II bands are the most conformationally sensitive among the protein bands. The amide I band, which is mainly composed of peptide carbonyl stretching vibration, has been predominantly used as the most sensitive spectral region to access protein conformational information and is less likely to be influenced by the nature of side chains [42]. In contrast, other amide bands are rarely used due to their complexity and are affected by details such as the force field, side chains, and hydrogen bonding [33]. However, the overlapping peaks corresponding to distinct secondary conformations of proteins make band assignment challenging. Thus, the amide I band has to be resolved into multiple individual band components by performing mathematical approaches, including second derivatives and band curve fitting or Fourier self-deconvolution, which correspond to the α-helix, β-sheet, turn, random, etc. of the protein compositions [40][41]. Mathematical and statistical approaches such as multivariate analysis have been increasingly employed in interpreting and revealing the information contained within spectra.

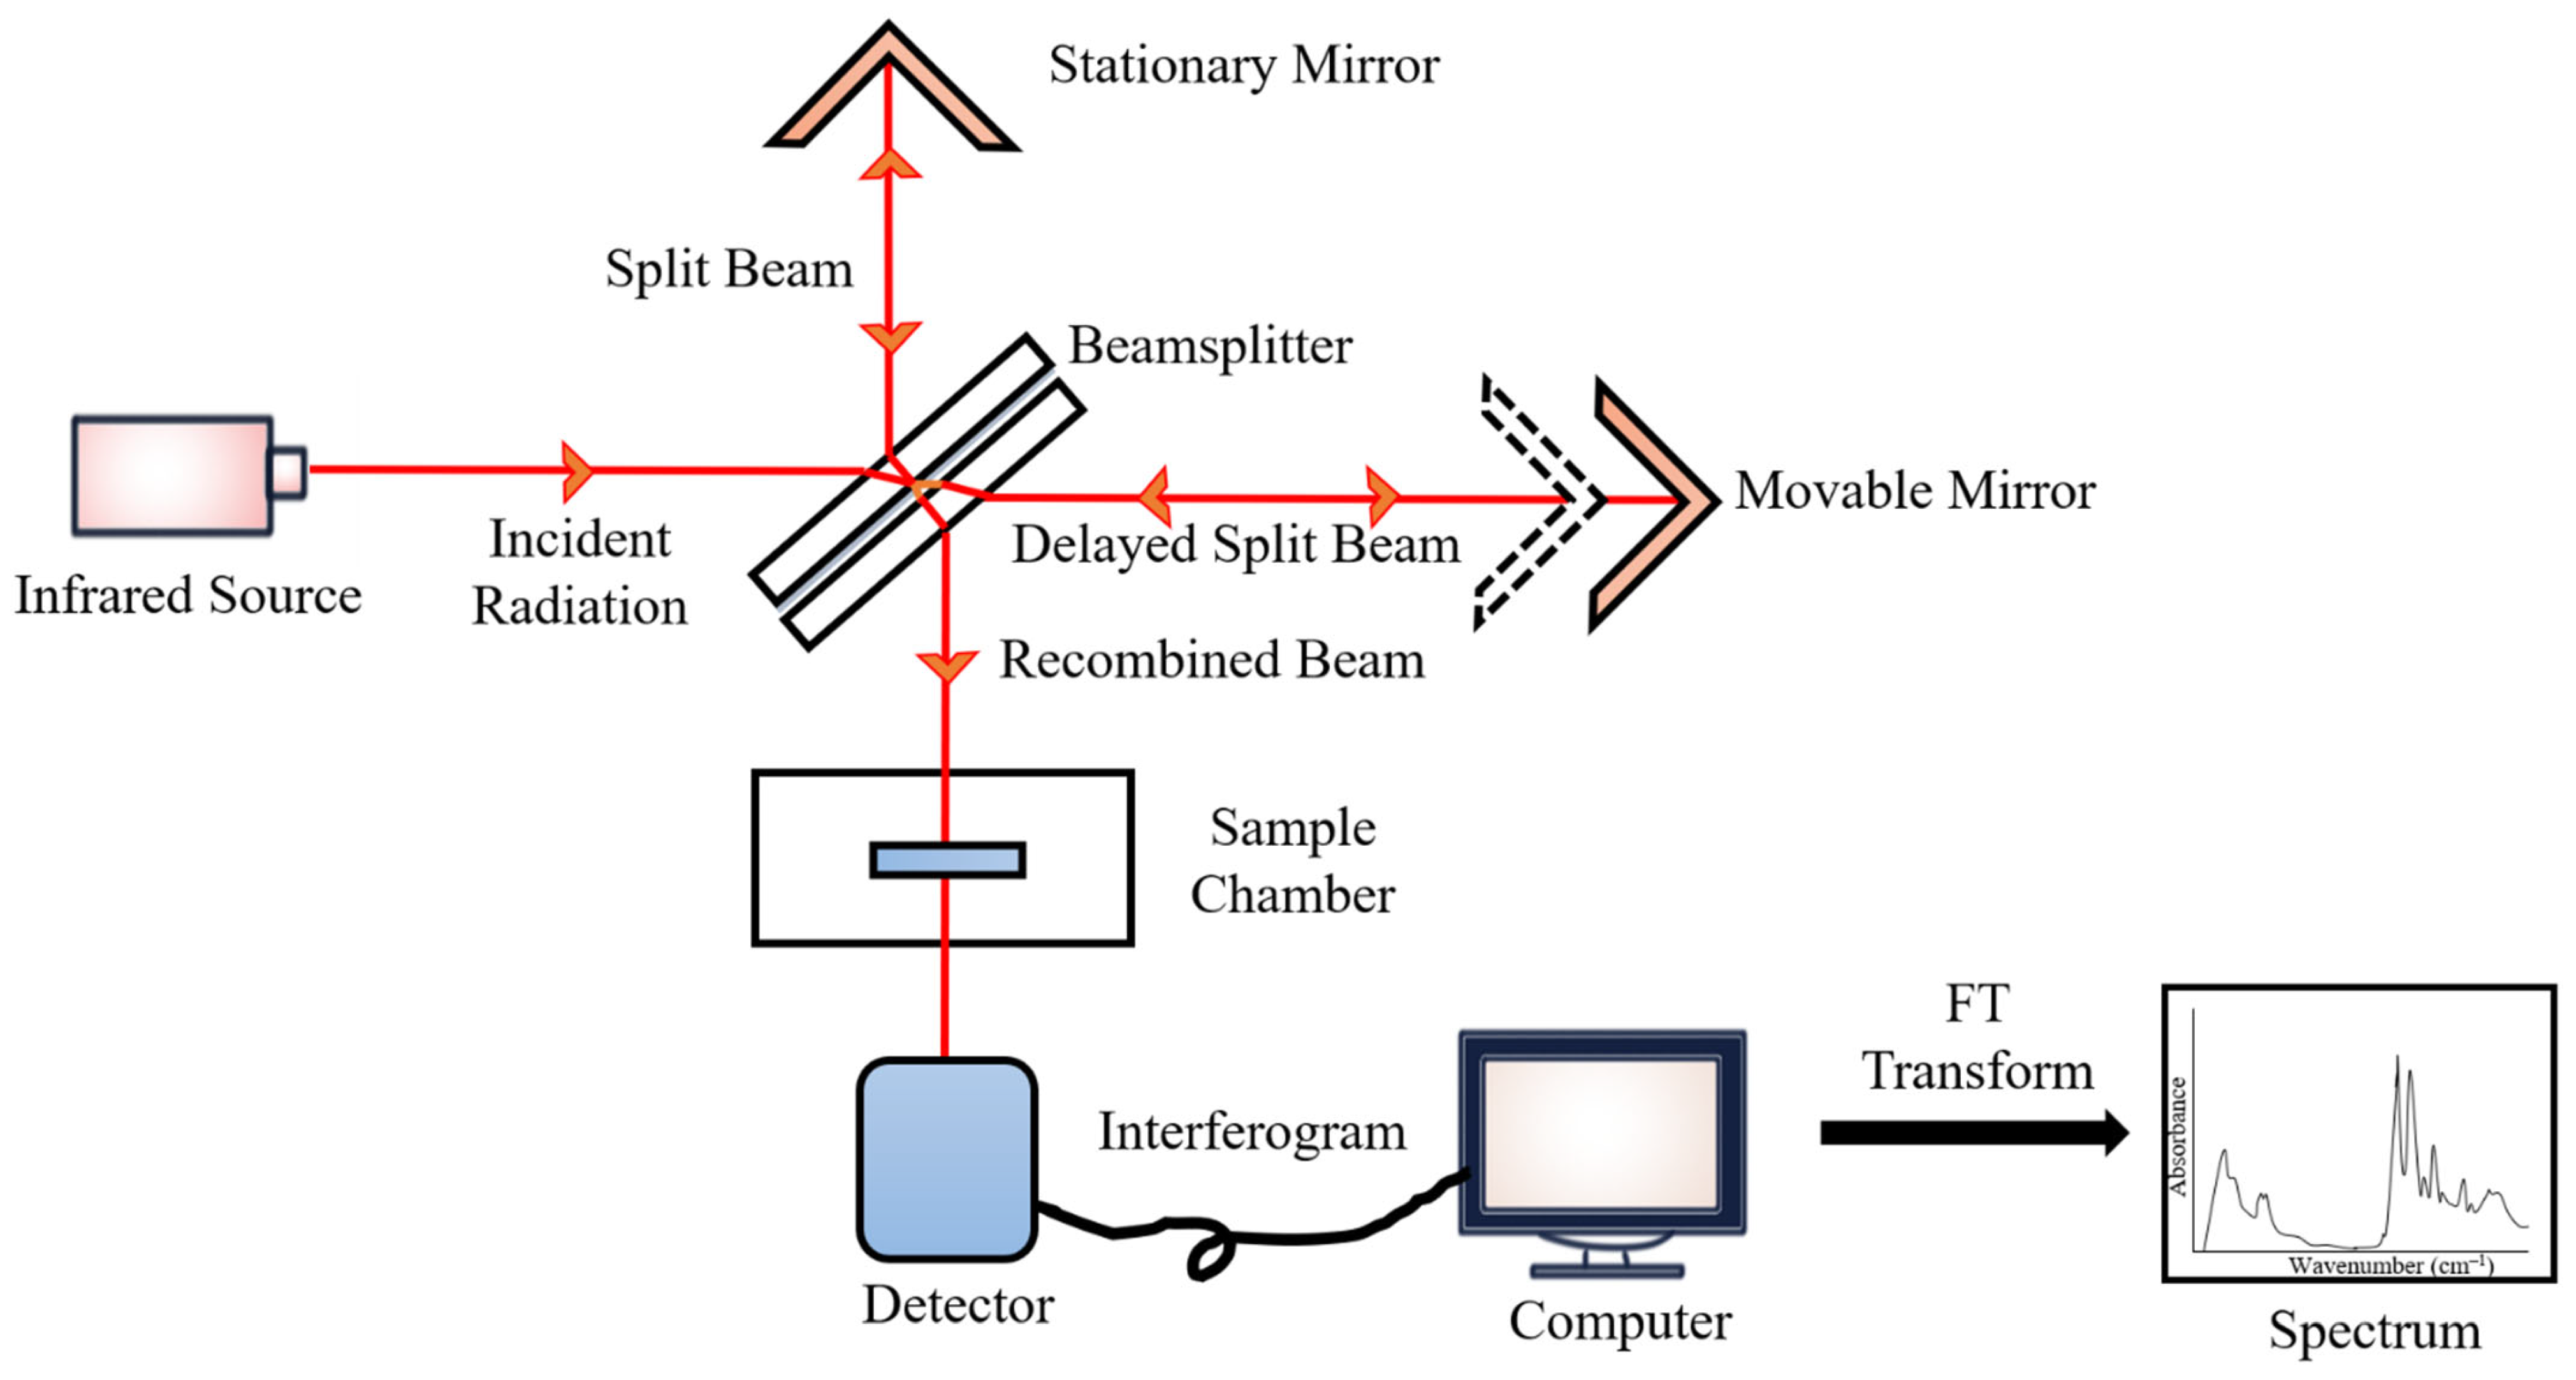
3. Sampling Modes of Fourier-Transform IR (FTIR)

FTIR works by mathematically Fourier-transforming an interferogram into an actual spectrum. In principle, specific frequencies of IR energy are selectively absorbed by sample constituents, which triggers atomic vibrations—the bending and stretching of the electric dipole moment—within a molecule and eventually results in the vibrational transition from the ground state to an excited vibrational state. These vibrational transitions are associated with corresponding bonding or molecular compositions. They can be interpreted both qualitatively and quantitatively based on the band positions, intensities, shapes, and widths, thereby providing cancer-specific biomarkers with distinctive spectral fingerprints [44].
During the measurements, the emitted IR energy passes through the interferometer along the optical path, where encoding of the spectral signals from the infrared frequencies takes place. The interferometer captures the spectral signals from the infrared frequencies. The interferogram, the resulting signal, is then transmitted through or reflected off the sample surface. The specific energy wavelengths, which represent a sample’s unique molecular characteristics, are absorbed. Eventually, the beam carrying molecular information then passes through the detector, and the measured signals are directed to a processing computer for Fourier transformation of the energy signals (Figure 1) [45].
Figure 1. FTIR block diagram.
FTIR spectroscopy has rapidly expanded beyond the essential structural characterization of molecules because of its inherent fundamental principles, simplicity of operation, and analytical sophistication. This technology provides a quick, label-free, and chemically specific examination of non-destructive biological materials with minimal sample preparation and processes, as well as qualitative and quantitative data in the form of reproducible IR spectra. FTIR spectroscopy is a cost-effective and economically sustainable tool for clinical research due to its low analytical cost and minimum reagent utilization during the analysis process. The application of FTIR spectroscopy in biofluid studies makes use of many sampling modes; the main sampling modes of FTIR spectroscopy are transmission, transflection, and attenuated total reflectance (ATR) [46].
In transmission-based sampling mode, IR radiation traverses a sample and a substrate such as calcium fluoride (CaF2) [21]. However, as the beam passes through an IR-absorbing sample, this technique requires an optimal pathlength to achieve quality spectra, which is typically specified at 1–20 μm to prevent saturation of the signal and non-Beer–Lambert-like behavior [44]; while in the case of aqueous biological samples, a shorter pathlength is required—not exceeding 6–10 μm—to account for the strong IR-absorbing water molecules [41]. The intensities of the IR bands are nevertheless limited by such short pathlengths. The implementation of transmission FTIR spectroscopy in clinics is rather challenging for aqueous or wet biological samples as their spectral reproducibility can be affected by spacer thickness, surface interactions, the presence of air bubbles in the sample, as well as the hydration level of the sample [44].
Transflection sampling mode functions by transmitting IR radiation through the sample deposited on an IR-reflecting substrate. Some of the incident radiation is reflected specularly from the surface; while most of the radiation is projected to the underlying reflecting substrate and reflected off the substrate through the sample [44]. The transflected radiation is detected and enables the molecular classification of the sample. Notably, the increased pathlength in transflection spectroscopy results in much larger absorption bands in the resultant IR spectra compared to those obtained in transmission and ATR sampling modes [44]. However, transflection FTIR may not be the best option in the study of biological samples. The increased sample pathlength makes it more susceptible to IR absorption by water molecules, in particular for studies involving wet biofluids. In addition, transflection FTIR spectroscopy is more prone to baseline effects due to the significant scattering effects, with resonant Mie scattering being the most prominent effect, resulting in smaller signal-to-noise ratio (SNR). According to Mie theory, the scattering effect occurs when the wavelength of the interrogating radiation is approximately the same size as the scattering particle of tissue or cell samples, which feature a high contrast in refractive index [47]. For instance, the nucleus can give rise to Mie-type scattering and spectral properties with non-Beer–Lambert absorption behavior because of its same size as the wavelength of the IR radiation [48]. Moreover, biological samples, even single cells, might have non-uniformity in size and shape that can give rise to a different extent of the scattering effect.
In addition, many studies have demonstrated that transflection FTIR spectroscopy is prone to the electric field standing wave (EFSW) effect [49][50][51]. An EFSW occurs at reflective metallic-like surfaces when the reflected radiation interferes with the incident radiation. EFSW can cause non-Beer–Lambert-like behavior, which results in non-linear spectral distortion with increasing thickness of the sample. The findings reported by Filik et al. [51] showed that variations in the thickness of bovine serum albumin (BSA) films, ranging from 200 to 1200 nm, gave rise to a different extent of the EFSW artifact, which exerted a significant effect on the transflection spectra by having a non-linear relationship with the IR wavelength. However, the spectral artifacts arising from the effects of light scattering and EFSW can be corrected by applying correction algorithms [52].
The issues addressed in transmission and transflection FTIR spectroscopy could be surpassed by using ATR-FTIR spectroscopy. ATR-FTIR relies on the interaction between an internal reflection element (IRE) comprising an infrared transparent material with a high refractive index—ATR crystals such as germanium, zinc selenide, zinc sulfide, or diamond—and a sample placed on the surface of the IRE [32]. The incident beam is transmitted through the IRE. Total internal reflectance is then instigated, and the IR beam is reflected in the IRE, creating an evanescent wave that protrudes beyond the IRE and penetrates into the surface of the sample for a few micrometers (1–2 μm) to determine its bonding geometry [32]; the wave then loses energy exponentially with distance from the interface of the IRE and the sample, and the resultant radiation is then measured, generating the resulting absorption spectrum [44]. In order to establish total internal reflectance, the critical angle must be minimized by having an IRE with a relatively higher refractive index than that of the sample; the angle of incidence must be greater than the critical angle, or else both the ATR and external refraction will contribute to the resultant spectrum [44]; and the sample must be in direct contact with the ATR crystal [32].
The use of mid-IR spectroscopy for biological studies is challenging because of the presence of water in tissues, cells, or biofluids. Water molecules are capable of absorbing IR radiation over a broad range in the mid-IR region, and can mask the absorption bands corresponding to other biochemical components of the sample. Thus, many studies have been carried out on dried biological samples in order to eliminate the detrimental effect on the resultant spectra caused by water molecules [53][54]. However, spectral differences were observed in fixed or dried samples and the samples in their hydrated or natural aqueous state, which may vary with their hydration state [55][56]. Zohdi et al. [55] demonstrated that the FTIR spectral information obtained from rodent heart and liver tissues preserved through desiccation drying, ethanol substitution, or formalin fixation changed compared to the spectra of fresh hydrated tissue samples, whereby the position and profile of the amide I band varied with the preparation approach and observable intensity loss of lipid absorption occurred when the tissues were hydrated with ethanol.
FTIR coupled with ATR is ideal for biological samples, including biofluids [57][58][59][60], tissues [61][62][63][64], and cells [65][66][67]. One of the main advantages of ATR is based on the use of the surface layer technique, which depends on the interaction between the generated evanescent waves and a few micrometers thick surface layer of the sample. This makes the measurements less likely to be affected by sample thickness, which also allows for simpler sample preparation. However, the sample needs to be at least three- to four-fold thicker than the penetration depth to prevent spectral artefacts with the IRE substrates [32]. Unlike transmission and transflection FTIR spectroscopy, given its small depth of beam penetration due to close proximity between the ATR element and samples, its small effective path length can prevent signal saturation and makes it applicable to aqueous samples, which allows the entire range of the MIR region, including the region corresponding to O-H vibrational modes, to remain accessible [47][68]. ATR-FTIR is thus a more preferable option for studying both dried and hydrated biological samples. Gulley-Stahl et al. [69] demonstrated that ATR-FTIR imaging produced images and resultant spectra with negligible scattering effects even when the biopsied kidney sample contained small amount of mineral that had a high refractive index. ATR-FTIR could thus eliminate spectral artifacts, which have always been an issue in transmission and transflection FTIR. Moreover, in contrast to transmission mode, ATR-FTIR does not need expensive substrates for analysis.

References

  1. Türker-Kaya, S.; Huck, C.W. A Review of Mid-Infrared and Near-Infrared Imaging: Principles, Concepts and Applications in Plant Tissue Analysis. Molecules 2017, 22, 168.
  2. Ozaki, Y. Infrared Spectroscopy—Mid-infrared, Near-infrared, and Far-infrared/Terahertz Spectroscopy. Anal. Sci. 2021, 37, 1193–1212.
  3. Ishibashi, J.; Yamashita, K.; Ishikawa, T.; Hosokawa, H.; Sumida, K.; Nagayama, M.; Kitamura, S. The effects inhibiting the proliferation of cancer cells by far-infrared radiation (FIR) are controlled by the basal expression level of heat shock protein (HSP) 70A. Med. Oncol. 2008, 25, 229–237.
  4. Li, K.; Xia, L.; Liu, N.F.; Nicoli, F.; Constantinides, J.; D’Ambrosia, C.; Lazzeri, D.; Tremp, M.; Zhang, J.F.; Zhang, Y.X. Far infrared ray (FIR) therapy: An effective and oncological safe treatment modality for breast cancer related lymphedema. J. Photochem. Photobiol. B: Biol. 2017, 172, 95–101.
  5. Cho, D.-H.; Lee, H.-J.; Lee, J.Y.; Park, J.-H.; Jo, I. Far-infrared irradiation inhibits breast cancer cell proliferation independently of DNA damage through increased nuclear Ca2+/calmodulin binding modulated-activation of checkpoint kinase 2. J. Photochem. Photobiol. B: Biol. 2021, 219, 112188.
  6. Son, J.-H. Terahertz electromagnetic interactions with biological matter and their applications. J. Appl. Phys. 2009, 105, 102033.
  7. Vafapour, Z.; Keshavarz, A.; Ghahraloud, H. The potential of terahertz sensing for cancer diagnosis. Heliyon 2020, 6, e05623.
  8. Kawashima, Y.; Masaaki, S.; Kuyama, K.; Sakai, T.; Hayakawa, Y.; Kaneda, T.; Sei, N. Terahertz Imaging for Formalin Fixed Malignant Liver Tumors Using Two-Band Beamline at the Accelerator Facility of Nihon University. Appl. Sci. 2022, 12, 2229.
  9. Hsu, Y.-H.; Lin, Y.-F.; Chen, C.-H.; Chiu, Y.-J.; Chiu, H.-W. Far infrared promotes wound healing through activation of Notch1 signaling. J. Mol. Med. 2017, 95, 1203–1213.
  10. Carrick, F.R.; Valerio, L.S.A.; Gonzalez-Vega, M.N.; Engel, D.; Sugaya, K. Accelerated Wound Healing Using a Novel Far-Infrared Ceramic Blanket. Life 2021, 11, 878.
  11. Xia, L.; Cui, C.; Nicoli, F.; Al-Mousawi, A.; Campisi, C.C.; Lazzeri, D.; Liu, N.F.; Xie, B.; Li, K.; Zhang, Y. Far Infrared Radiation Therapy for Gynecological Cancer-Related Lymphedema Is an Effective and Oncologically Safe Treatment: A Randomized-Controlled Trial. Lymphat. Res. Biol. 2022, 20, 164–174.
  12. Li, K.; Xu, H.; Liu, N.F.; Sadigh, P.; Evans, V.; Zhang, Y.X. Far-infrared ray for treating chronic lower extremity lymphedema with dermatolymphangioadenitis: A postoperative complication of gynecological tumor resection. Arch. Gynecol. Obstet. 2017, 295, 1441–1450.
  13. Li, K.; Zhang, Z.; Liu, N.F.; Feng, S.Q.; Tong, Y.; Zhang, J.F.; Constantinides, J.; Lazzeri, D.; Grassetti, L.; Nicoli, F.; et al. Efficacy and safety of far infrared radiation in lymphedema treatment: Clinical evaluation and laboratory analysis. Lasers Med. Sci. 2017, 32, 485–494.
  14. Yoon, J.Y.; Park, J.H.; Lee, K.J.; Kim, H.S.; Rhee, S.-M.; Oh, A.J.H. The effect of postoperatively applied far-infrared radiation on pain and tendon-to-bone healing after arthroscopic rotator cuff repair: A clinical prospective randomized comparative study. Korean J. Pain 2020, 33, 344–351.
  15. Lee, J.H.; Roh, M.R.; Lee, K.H. Effects of Infrared Radiation on Skin Photo-Aging and Pigmentation. Yonsei Med. J. 2006, 47, 485–490.
  16. Chiu, H.-W.; Chen, C.-H.; Chen, Y.-J.; Hsu, Y.-H. Far-infrared suppresses skin photoaging in ultraviolet B-exposed fibroblasts and hairless mice. PLoS ONE 2017, 12, e0174042.
  17. Falconer, R.J.; Markelz, A. Terahertz Spectroscopic Analysis of Peptides and Proteins. J. Infrared Millim. Terahertz Waves 2012, 33, 973–988.
  18. Han, Y.; Ling, S.; Qi, Z.; Shao, Z.; Chen, X. Application of far-infrared spectroscopy to the structural identification of protein materials. Phys. Chem. Chem. Phys. 2018, 20, 11643–11648.
  19. França, A.S.; Oliveira, L.S. FTIR Spectroscopy: Advances in Research and Applications; Nova Science Publishers: Hauppauge, NY, USA, 2022.
  20. Beć, K.B.; Grabska, J.; Huck, C.W. Biomolecular and bioanalytical applications of infrared spectroscopy—A review. Anal. Chim. Acta 2020, 1133, 150–177.
  21. De Bruyne, S.; Speeckaert, M.M.; Delanghe, J.R. Applications of mid-infrared spectroscopy in the clinical laboratory setting. Crit. Rev. Clin. Lab. Sci. 2018, 55, 1–20.
  22. Jha, S.N. Near Infrared Spectroscopy; Springer: Berlin/Heidelberg, Germany, 2010.
  23. Fraser-Miller, S.J.; Saarinen, J.; Strachan, C.J. Vibrational Spectroscopic Imaging; Springer: New York, NY, USA, 2016.
  24. Beć, K.B.; Grabska, J.; Huck, C.W. Near-Infrared Spectroscopy in Bio-Applications. Molecules 2020, 25, 2948.
  25. Rhiel, M.; Cohen, M.B.; Murhammer, D.W.; Arnold, M.A. Nondestructive near-infrared spectroscopic measurement of multiple analytes in undiluted samples of serum-based cell culture media. Biotechnol. Bioeng. 2002, 77, 73–82.
  26. Tromberg, B.J.; Cerussi, A.; Shah, N.; Compton, M.; Durkin, A.; Hsiang, D.; Butler, J.; Mehta, R. Imaging in breast cancer: Diffuse optics in breast cancer: Detecting tumors in pre-menopausal women and monitoring neoadjuvant chemotherapy. Breast Cancer Res. 2005, 7, 279–285.
  27. Henn, R.; Kirchler, C.G.; Schirmeister, Z.L.; Roth, A.; Mäntele, W.; Huck, C.W. Hemodialysis monitoring using mid- and near-infrared spectroscopy with partial least squares regression. J. Biophotonics 2018, 11, e201700365.
  28. Sala, A.; Anderson, D.J.; Brennan, P.M.; Butler, H.J.; Cameron, J.M.; Jenkinson, M.D.; Rinaldi, C.; Theakstone, A.G.; Baker, M.J. Biofluid diagnostics by FTIR spectroscopy: A platform technology for cancer detection. Cancer Lett. 2020, 477, 122–130.
  29. De Lima, K.M.G.; Gajjar, K.B.; Martin-Hirsch, P.L.; Martin, F.L. Segregation of ovarian cancer stage exploiting spectral biomarkers derived from blood plasma or serum analysis: ATR-FTIR spectroscopy coupled with variable selection methods. Biotechnol. Prog. 2015, 31, 832–839.
  30. Neves, A.C.O.; Silva, P.P.; Morais, C.L.M.; Miranda, C.G.; Crispim, J.C.O.; Lima, K.M.G. ATR-FTIR and multivariate analysis as a screening tool for cervical cancer in women from northeast Brazil: A biospectroscopic approach. RSC Adv. 2016, 6, 99648–99655.
  31. Stępień, E.; Kamińska, A.; Surman, M.; Karbowska, D.; Wróbel, A.; Przybyło, M. Fourier-Transform InfraRed (FT-IR) spectroscopy to show alterations in molecular composition of EV subpopulations from melanoma cell lines in different malignancy. Biochem. Biophys. Rep. 2021, 25, 100888.
  32. Baker, M.J.; Trevisan, J.; Bassan, P.; Bhargava, R.; Butler, H.J.; Dorling, K.M.; Fielden, P.R.; Fogarty, S.W.; Fullwood, N.J.; Heys, K.A.; et al. Using Fourier transform IR spectroscopy to analyze biological materials. Nat. Protoc. 2014, 9, 1771–1791.
  33. Yang, H.; Yang, S.; Kong, J.; Dong, A.; Yu, S. Obtaining information about protein secondary structures in aqueous solution using Fourier transform IR spectroscopy. Nat. Protoc. 2015, 10, 382–396.
  34. Szentirmai, V.; Wacha, A.; Németh, C.; Kitka, D.; Rácz, A.; Héberger, K.; Mihály, J.; Varga, Z. Reagent-free total protein quantification of intact extracellular vesicles by attenuated total reflection Fourier transform infrared (ATR-FTIR) spectroscopy. Anal. Bioanal. Chem. 2020, 412, 4619–4628.
  35. Ramos-Garcia, V.; Ten-Doménech, I.; Moreno-Giménez, A.; Gormaz, M.; Parra-Llorca, A.; Shephard, A.P.; Sepúlveda, P.; Pérez-Guaita, D.; Vento, M.; Lendl, B.; et al. ATR-FTIR spectroscopy for the routine quality control of exosome isolations. Chemom. Intell. Lab. Syst. 2021, 217, 104401.
  36. Zlotogorski-Hurvitz, A.; Dekel, B.Z.; Malonek, D.; Yahalom, R.; Vered, M. FTIR-based spectrum of salivary exosomes coupled with computational-aided discriminating analysis in the diagnosis of oral cancer. J. Cancer Res. Clin. Oncol. 2019, 145, 685–694.
  37. Paolini, L.; Federici, S.; Consoli, G.; Arceri, D.; Radeghieri, A.; Alessandri, I.; Bergese, P. Fourier-transform Infrared (FT-IR) spectroscopy fingerprints subpopulations of extracellular vesicles of different sizes and cellular origin. J. Extracell. Vesicles 2020, 9, 1741174.
  38. Bandekar, J. Amide modes and protein conformation. Biochim. Biophys. Acta Protein Struct. Mol. Enzymol. 1992, 1120, 123–143.
  39. Rehman, I.; Farooq, M.; Botelho, S. Biochemistry, secondary protein structure. In StatPearls; StatPearls Publishing: Treasure Island, FL, USA, 2022.
  40. Singh Bal, R. Basic aspects of the technique and applications of Infrared spectroscopy of peptides and proteins. Infrared Anal. Pept. Proteins 1999, 750, 2–37.
  41. Glassford, S.E.; Byrne, B.; Kazarian, S.G. Recent applications of ATR FTIR spectroscopy and imaging to proteins. Biochim. Et Biophys. Acta (BBA)—Proteins Proteom. 2013, 1834, 2849–2858.
  42. López-Lorente, I.; Mizaikoff, B. Mid-infrared spectroscopy for protein analysis: Potential and challenges. Anal. Bioanal. Chem. 2016, 408, 2875–2889.
  43. Ghimire, H.; Venkataramani, M.; Bian, Z.; Liu, Y.; Perera, A.G.U. ATR-FTIR spectral discrimination between normal and tumorous mouse models of lymphoma and melanoma from serum samples. Sci. Rep. 2017, 7, 16993.
  44. Theakstone, A.G.; Rinaldi, C.; Butler, H.J.; Cameron, J.M.; Confield, L.R.; Rutherford, S.H.; Sala, A.; Sangamnerkar, S.; Baker, M.J. Fourier-transform infrared spectroscopy of biofluids: A practical approach. Transl. Biophotonics 2021, 3, e202000025.
  45. Fadlelmoula, A.; Pinho, D.; Carvalho, V.H.; Catarino, S.O.; Minas, G. Fourier Transform Infrared (FTIR) Spectroscopy to Analyse Human Blood over the Last 20 Years: A Review towards Lab-on-a-Chip Devices. Micromachines 2022, 13, 187.
  46. Dorling, K.M.; Baker, M.J. Highlighting attenuated total reflection Fourier transform infrared spectroscopy for rapid serum analysis. Trends Biotechnol. 2013, 31, 327–328.
  47. Kazarian, S.G.; Chan, K.L.A. ATR-FTIR spectroscopic imaging: Recent advances and applications to biological systems. Analyst 2013, 138, 1940–1951.
  48. Mohlenhoff, B.; Romeo, M.; Diem, M.; Wood, B.R. Mie-Type Scattering and Non-Beer-Lambert Absorption Behavior of Human Cells in Infrared Microspectroscopy. Biophys. J. 2005, 88, 3635–3640.
  49. Pilling, M.J.; Bassan, P.; Gardner, P. Comparison of transmission and transflectance mode FTIR imaging of biological tissue. Analyst 2015, 140, 2383–2392.
  50. Staniszewska-Slezak, E.; Rygula, A.; Malek, K.; Baranska, M. Transmission versus transflection mode in FTIR analysis of blood plasma: Is the electric field standing wave effect the only reason for observed spectral distortions? Analyst 2015, 140, 2412–2421.
  51. Filik, J.; Frogley, M.D.; Pijanka, J.K.; Wehbe, K.; Cinque, G. Electric field standing wave artefacts in FTIR micro-spectroscopy of biological materials. Analyst 2012, 137, 853–861.
  52. Shakya, B.R.; Teppo, H.-R.; Rieppo, L. Optimization of measurement mode and sample processing for FTIR microspectroscopy in skin cancer research. Analyst 2022, 147, 851–861.
  53. Sala, A.; Spalding, K.E.; Ashton, K.M.; Board, R.; Butler, H.; Dawson, T.P.; Harris, D.A.; Hughes, C.S.; Jenkins, C.A.; Jenkinson, M.D.; et al. Rapid analysis of disease state in liquid human serum combining infrared spectroscopy and “digital drying”. J. Biophotonics 2020, 13, e202000118.
  54. Wilk, A.; Drozdz, A.; Olbrich, K.; Janik-Olchawa, N.; Setkowicz, Z.; Chwiej, J. Influence of measurement mode on the results of glioblastoma multiforme analysis with the FTIR microspectroscopy. Spectrochim. Acta Part A: Mol. Biomol. Spectrosc. 2022, 287, 122086.
  55. Zohdi, V.; Whelan, D.; Wood, B.R.; Pearson, J.; Bambery, K.; Black, M.J. Importance of Tissue Preparation Methods in FTIR Micro-Spectroscopical Analysis of Biological Tissues: ‘Traps for New Users’. PLoS ONE 2015, 10, e0116491.
  56. Oliver, K.V.; Maréchal, A.; Rich, P.R. Effects of the Hydration State on the Mid-Infrared Spectra of Urea and Creatinine in Relation to Urine Analyses. Appl. Spectrosc. 2016, 70, 983–994.
  57. Byrne, H.J.; Bonnier, F.; McIntyre, J.; Parachalil, D.R. Quantitative analysis of human blood serum using vibrational spectroscopy. Clin. Spectrosc. 2020, 2, 100004.
  58. Silva, L.G.; Péres, A.F.S.; Freitas, D.L.D.; Morais, C.L.M.; Martin, F.L.; Crispim, J.C.O.; Lima, K.M.G. ATR-FTIR spectroscopy in blood plasma combined with multivariate analysis to detect HIV infection in pregnant women. Sci. Rep. 2020, 10, 20156.
  59. Sitnikova, V.E.; Kotkova, M.A.; Nosenko, T.N.; Kotkova, T.N.; Martynova, D.M.; Uspenskaya, M.V. Breast cancer detection by ATR-FTIR spectroscopy of blood serum and multivariate data-analysis. Talanta 2020, 214, 120857.
  60. Sarigul, N.; Kurultak, I.; Gökceoğlu, A.U.; Korkmaz, F. Urine analysis using FTIR spectroscopy: A study on healthy adults and children. J. Biophotonics 2021, 14, e202100009.
  61. Ghassemi, M.; Barzegari, S.; Hajian, P.; Zham, H.; Mirzaei, H.R.; Shirazi, F.H. Diagnosis of normal and malignant human gastric tissue samples by FTIR spectra combined with mathematical models. J. Mol. Struct. 2021, 1229, 129493.
  62. Kyriakidou, M.; Anastassopoulou, J.; Tsakiris, A.; Koui, M.; Theophanides, T. FT-IR Spectroscopy Study in Early Diagnosis of Skin Cancer. Vivo 2017, 31, 1131–1137.
  63. Theophilou, G.; Lima, K.M.G.; Briggs, M.; Martin-Hirsch, P.L.; Stringfellow, H.F.; Martin, F.L. A biospectroscopic analysis of human prostate tissue obtained from different time periods points to a trans-generational alteration in spectral phenotype. Sci. Rep. 2015, 5, 13465.
  64. Tomas, R.C.; Sayat, A.J.; Atienza, A.N.; Danganan, J.L.; Ramos, M.R.; Fellizar, A.; Notarte, K.I.; Angeles, L.M.; Bangaoil, R.; Santillan, A.; et al. Detection of breast cancer by ATR-FTIR spectroscopy using artificial neural networks. PLoS ONE 2022, 17, e0262489.
  65. Mata-Miranda, M.M.; Vazquez-Zapien, G.J.; Rojas-Lopez, M.; Sanchez-Monroy, V.; Perez-Ishiwara, D.G.; Delgado-Macuil, R.J. Morphological, molecular and FTIR spectroscopic analysis during the differentiation of kidney cells from pluripotent stem cells. Biol. Res. 2017, 50, 14.
  66. Wu, B.-B.; Gong, Y.-P.; Wu, X.-H.; Chen, Y.-Y.; Chen, F.-F.; Jin, L.-T.; Cheng, B.-R.; Hu, F.; Xiong, B. Fourier transform infrared spectroscopy for the distinction of MCF-7 cells treated with different concentrations of 5-fluorouracil. J. Transl. Med. 2015, 13, 108.
  67. Li, L.; Bi, X.; Sun, H.; Liu, S.; Yu, M.; Zhang, Y.; Weng, S.; Yang, L.; Bao, Y.; Wu, J.; et al. Characterization of ovarian cancer cells and tissues by Fourier transform infrared spectroscopy. J. Ovarian Res. 2018, 11, 64.
  68. Sabbatini, S.; Conti, C.; Orilisi, G.; Giorgini, E. Infrared spectroscopy as a new tool for studying single living cells: Is there a niche? Biomed. Spectrosc. Imaging 2017, 6, 85–99.
  69. Gulley-Stahl, H.J.; Bledsoe, S.B.; Evan, A.P.; Sommer, A.J. The Advantages of an Attenuated Total Internal Reflection Infrared Microspectroscopic Imaging Approach for Kidney Biopsy Analysis. Appl. Spectrosc. 2010, 64, 15–22.
More
Information
Subjects: Biology
Contributors MDPI registered users' name will be linked to their SciProfiles pages. To register with us, please refer to https://encyclopedia.pub/register : , , ,
View Times: 1.5K
Revisions: 5 times (View History)
Update Date: 09 Jan 2023
1000/1000