1. Infrared (IR) Spectroscopy
IR spectroscopy measures the interaction between IR radiation and matter. IR radiation is electromagnetic radiation with wavelengths and wavenumbers ranges of 0.78–1000 µm and 12,500–10 cm
−1, respectively. The IR region in the electromagnetic spectrum can be subdivided into three spectral regions based on the wavelength and wavenumber: near-IR (NIR), mid-IR (MIR), and far-IR (FIR).
Table 1 shows the subdivision of IR regions of the electromagnetic spectrum into NIR, MIR, and FIR with their corresponding wavelengths and wavenumbers
[1][1]. Applications of these IR spectral regions in the biological field are briefly discussed in the following sections.
1.1. Far-Infrared (FIR)
The FIR region is commonly defined as the region from 400 to 10 cm
−1. On the other hand, the terahertz (THz) region refers to the spectrum range from 333 to 3.33 cm
−1, which overlaps with the FIR region. THz and FIR spectroscopy principles are alike; the difference in names results from the instruments used according to experimental requirements
[2].
FIR or THz radiation has been widely used in biomedical research, for example, by using cancer cell lines or cancer patients to establish cancer phototherapies
[3][4][5][3,4,5]. FIR or THz radiation is highly sensitive to water content, hence making FIR or THz spectroscopy a potential screening tool for cancer diagnosis, based on the difference in the water content and water binding status in normal and cancerous tissues
[6]. With increased water content in cancerous tissues compared to that in normal tissues, Vafapour et al.
[7] were able to differentiate between healthy and cancerous colon tissues based on variations in their reflectance spectra. Kawashima et al.
[8] suggested that the development of fibrous tissue around the malignant liver tumor tissue leads to water loss, thus giving rise to a higher permeability of THz transmission in the imaging experiments. FIR or THz radiation has been proven to be useful in bioimaging. The radiation also exerts beneficial biological effects by producing thermal and non-thermal effects, including strengthening cardiovascular function by enhancing vessel endothelial function, improving vasodilation, a vessel circulation, and angiogenesis; promoting wound healing
[9][10][9,10]; treating postoperative lymphedema
[4][11][12][13][4,11,12,13]; reducing postoperative pain
[14]; suppressing skin photoaging
[15][16][15,16]; etc.
In addition, FIR is more susceptible to the vibration modes of peptide skeletons and hydrogen bonds compared to MIR spectroscopy, it is therefore considered ideal for examining highly ordered protein structures, such as fibril, gels, and virus-like particles, as well as protein dynamics
[17][18][17,18]. Several features of peptides and polyamides were linked to distinct modes of vibration according to their characterization based on spectroscopic data. However, proteins such as hemoglobin, lysozymes, and serum albumin showed only weak and broad absorption bands in the FIR region, hence requiring complex and time-consuming calculations and simulations to interpret the data obtained
[18].
1.2. Mid-Infrared (MIR)
MIR (4000–400 cm
−1) is commonly used in studying biological samples because most molecule bands, such as proteins, lipids, sugars, and nucleic acids, are present in the MIR region. According to Beer–Lambert’s law, molecular absorbance in this region is proportional to the concentration without light scattering; the measurement of these biological samples can evaluate any change in composition or structure
[19]. In the biomedical area, IR spectroscopy, specifically MIR, has been used to investigate large numbers of cells, tissues, and organs, providing qualitative and quantitative information that could be used for detection and classification. This technology can be used in numerous disciplines of biodiagnostics, not only to characterize diseases and monitor drug delivery but also to reveal the biomolecular framework underlying the particular alterations processes and structures. IR spectroscopy could also be applied in forensic science to screen typical human bodily fluids collected from crime scenes as routine confirmation
[20]. Notably, FTIR spectroscopy is considered an excellent method to study and analyze biological samples using MIR radiation
[21].
1.3. Near-Infrared (NIR)
NIR spectroscopy (12,500–4000 cm
−1) was exclusively employed as an accessory to other optical equipment before the advent of light-fiber optics and monochromator detectors; since then, NIR spectroscopy has become a tool that could be applied in various scientific disciplines, including medicine
[22]. NIR applications in bioscience include medical monitoring
[23], cell-related studies, analysis of bodily fluids and tissues
[24], etc.
NIR calibration models for analyzing the cancer markers of prostate carcinoma (PCa) were among the first applications of NIR spectroscopy in cancer diagnosis
[25]. Calibration was performed using a novel adaptive method to attenuate metabolically induced covariance between specific biomolecules in PCa cells. In addition to common bodily fluids such as serum and saliva, NIR can also analyze blood oxygen levels. In studies, higher total hemoglobin and water absorption were determined by analyzing NIR absorption between normal and malignant tissues, followed by weaker signals associated with oxygen saturation in lipids and tissue hemoglobin
[26]. Furthermore, NIR spectroscopy has been extensively applied to investigate blood glucose content. A study conducted by Henn et al. found that both NIR and MIR can analyze urea and glucose in hemodialysis monitoring. However, MIR is the better tool for monitoring hemodialysis because MIR, coupled to a multi-reflection attenuated total reflection (ATR) cell, can provide access to more analyses of interest, such as lactate, phosphate, and creatinine
[27].
With NIR imaging techniques, aqueous solution dispersion can be probed more easily, and changes in structure or concentration in water and proteins can also be monitored simultaneously
[2]. However, compared to IR spectroscopy, the strongly overlapping bands generated by NIR spectroscopy are around 10 to 100 times weaker than the corresponding MIR bands
[23], resulting in broad absorption profiles that complicate the identification of contributing vibrations
[24] and band assignment
[23]. Therefore, NIR spectroscopy still faces intense competition from IR spectroscopy, especially in bioanalytical research and the field of medical diagnosis
[24].
2. Biomolecular Vibrations and MIR Spectrum
The absorption bands displayed on an IR spectrum can be assigned to specific molecular vibrations of the sample constituents in which most of the biomolecules absorb energies from MIR
[28]. In this IR spectral region, the range of 1800–900 cm
−1 is called the bio-fingerprint region, where the molecular vibrations in this region are unique for different types of biological samples, including different types of tumors
[29][30][29,30]. For instance, IR absorption bands of amide I and II observed at 1650 and 1550 cm
−1, methylene groups of lipids at 1470–1400 cm
−1, stretching vibrations of phosphodiester groups at 1225 and 1080 cm
−1, C-OH and C-O stretching of amino acids and carbohydrates at 1155 cm
−1 and glycogen at 1030 cm
−1 were reported to discriminate the plasma samples of healthy individuals from those with intraepithelial lesion or malignancy (NILM) and squamous intraepithelial lesion (SIL)
[30]. In general, MIR regions including the high wavenumber region, which generally corresponds to stretching vibrations such as C-H, N-H, and O-H, together with the low wavenumber region, which correlate to bending and carbon skeleton fingerprint vibrations, characterize the structure of biological samples
[31][32][31,32].
Table 2 shows the assignments of the main peaks observed in biological IR spectra, based on the literature.
Many studies have introduced FTIR as a promising biophysical tool for protein structural characterization and monitoring dynamic conformational changes
[33]. The IR spectra of protein molecules exhibit many characteristic vibrational frequencies. These vibrational frequencies originate mainly from in-plane C-C stretch, C-N stretch, N-C stretch, N-H stretch and bend, CO stretch and bend, CNC and CCN deformation, and out-of-plane CO and N-H bend and CN torsion
[38].
Amino acid residues are connected in proteins or polypeptides via amide bonds. In fact, protein secondary structures are attributed to the hydrogen bonds formed between atoms of the polypeptide backbone
[39]. The differential hydrogen bonding in amino acids, together with geometric orientations of amide bonds, give rise to individual secondary structural folding in polypeptides (α-helix, β-sheet, and unordered structures), thereby contributing to resolvable absorption bands in the amide I band corresponding to secondary conformations in polypeptides
[40][41][42][40,41,42].
Table 3 shows the assignment of protein secondary structures based on the analysis of the IR amide I band
[41][43][41,43].
The amide I and II bands are the most conformationally sensitive among the protein bands. The amide I band, which is mainly composed of peptide carbonyl stretching vibration, has been predominantly used as the most sensitive spectral region to access protein conformational information and is less likely to be influenced by the nature of side chains
[42]. In contrast, other amide bands are rarely used due to their complexity and are affected by details such as the force field, side chains, and hydrogen bonding
[33]. However, the overlapping peaks corresponding to distinct secondary conformations of proteins make band assignment challenging. Thus, the amide I band has to be resolved into multiple individual band components by performing mathematical approaches, including second derivatives and band curve fitting or Fourier self-deconvolution, which correspond to the α-helix, β-sheet, turn, random, etc. of the protein compositions
[40][41][40,41]. Mathematical and statistical approaches such as multivariate analysis have been increasingly employed in interpreting and revealing the information contained within spectra.
3. Sampling Modes of Fourier-Transform IR (FTIR)
FTIR works by mathematically Fourier-transforming an interferogram into an actual spectrum. In principle, specific frequencies of IR energy are selectively absorbed by sample constituents, which triggers atomic vibrations—the bending and stretching of the electric dipole moment—within a molecule and eventually results in the vibrational transition from the ground state to an excited vibrational state. These vibrational transitions are associated with corresponding bonding or molecular compositions. They can be interpreted both qualitatively and quantitatively based on the band positions, intensities, shapes, and widths, thereby providing cancer-specific biomarkers with distinctive spectral fingerprints
[44].
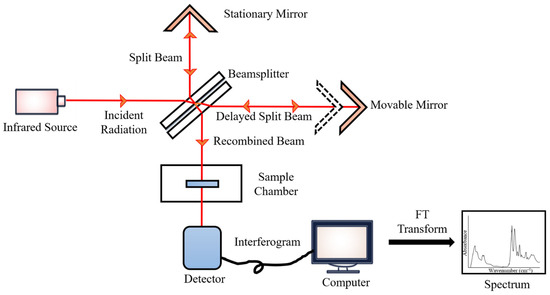
During the measurements, the emitted IR energy passes through the interferometer along the optical path, where encoding of the spectral signals from the infrared frequencies takes place. The interferometer captures the spectral signals from the infrared frequencies. The interferogram, the resulting signal, is then transmitted through or reflected off the sample surface. The specific energy wavelengths, which represent a sample’s unique molecular characteristics, are absorbed. Eventually, the beam carrying molecular information then passes through the detector, and the measured signals are directed to a processing computer for Fourier transformation of the energy signals (
Figure 12)
[45].
Figure 12.
FTIR block diagram.
FTIR spectroscopy has rapidly expanded beyond the essential structural characterization of molecules because of its inherent fundamental principles, simplicity of operation, and analytical sophistication. This technology provides a quick, label-free, and chemically specific examination of non-destructive biological materials with minimal sample preparation and processes, as well as qualitative and quantitative data in the form of reproducible IR spectra. FTIR spectroscopy is a cost-effective and economically sustainable tool for clinical research due to its low analytical cost and minimum reagent utilization during the analysis process. The application of FTIR spectroscopy in biofluid studies makes use of many sampling modes; the main sampling modes of FTIR spectroscopy are transmission, transflection, and attenuated total reflectance (ATR)
[46].
In transmission-based sampling mode, IR radiation traverses a sample and a substrate such as calcium fluoride (CaF
2)
[21]. However, as the beam passes through an IR-absorbing sample, this technique requires an optimal pathlength to achieve quality spectra, which is typically specified at 1–20 μm to prevent saturation of the signal and non-Beer–Lambert-like behavior
[44]; while in the case of aqueous biological samples, a shorter pathlength is required—not exceeding 6–10 μm—to account for the strong IR-absorbing water molecules
[41]. The intensities of the IR bands are nevertheless limited by such short pathlengths. The implementation of transmission FTIR spectroscopy in clinics is rather challenging for aqueous or wet biological samples as their spectral reproducibility can be affected by spacer thickness, surface interactions, the presence of air bubbles in the sample, as well as the hydration level of the sample
[44].
Transflection sampling mode functions by transmitting IR radiation through the sample deposited on an IR-reflecting substrate. Some of the incident radiation is reflected specularly from the surface; while most of the radiation is projected to the underlying reflecting substrate and reflected off the substrate through the sample
[44]. The transflected radiation is detected and enables the molecular classification of the sample. Notably, the increased pathlength in transflection spectroscopy results in much larger absorption bands in the resultant IR spectra compared to those obtained in transmission and ATR sampling modes
[44]. However, transflection FTIR may not be the best option in the study of biological samples. The increased sample pathlength makes it more susceptible to IR absorption by water molecules, in particular for studies involving wet biofluids. In addition, transflection FTIR spectroscopy is more prone to baseline effects due to the significant scattering effects, with resonant Mie scattering being the most prominent effect, resulting in smaller signal-to-noise ratio (SNR). According to Mie theory, the scattering effect occurs when the wavelength of the interrogating radiation is approximately the same size as the scattering particle of tissue or cell samples, which feature a high contrast in refractive index
[47]. For instance, the nucleus can give rise to Mie-type scattering and spectral properties with non-Beer–Lambert absorption behavior because of its same size as the wavelength of the IR radiation
[48]. Moreover, biological samples, even single cells, might have non-uniformity in size and shape that can give rise to a different extent of the scattering effect.
In addition, many studies have demonstrated that transflection FTIR spectroscopy is prone to the electric field standing wave (EFSW) effect
[49][50][51][49,50,51]. An EFSW occurs at reflective metallic-like surfaces when the reflected radiation interferes with the incident radiation. EFSW can cause non-Beer–Lambert-like behavior, which results in non-linear spectral distortion with increasing thickness of the sample. The findings reported by Filik et al.
[51] showed that variations in the thickness of bovine serum albumin (BSA) films, ranging from 200 to 1200 nm, gave rise to a different extent of the EFSW artifact, which exerted a significant effect on the transflection spectra by having a non-linear relationship with the IR wavelength. However, the spectral artifacts arising from the effects of light scattering and EFSW can be corrected by applying correction algorithms
[52].
The issues addressed in transmission and transflection FTIR spectroscopy could be surpassed by using ATR-FTIR spectroscopy. ATR-FTIR relies on the interaction between an internal reflection element (IRE) comprising an infrared transparent material with a high refractive index—ATR crystals such as germanium, zinc selenide, zinc sulfide, or diamond—and a sample placed on the surface of the IRE
[32]. The incident beam is transmitted through the IRE. Total internal reflectance is then instigated, and the IR beam is reflected in the IRE, creating an evanescent wave that protrudes beyond the IRE and penetrates into the surface of the sample for a few micrometers (1–2 μm) to determine its bonding geometry
[32]; the wave then loses energy exponentially with distance from the interface of the IRE and the sample, and the resultant radiation is then measured, generating the resulting absorption spectrum
[44]. In order to establish total internal reflectance, the critical angle must be minimized by having an IRE with a relatively higher refractive index than that of the sample; the angle of incidence must be greater than the critical angle, or else both the ATR and external refraction will contribute to the resultant spectrum
[44]; and the sample must be in direct contact with the ATR crystal
[32].
The use of mid-IR spectroscopy for biological studies is challenging because of the presence of water in tissues, cells, or biofluids. Water molecules are capable of absorbing IR radiation over a broad range in the mid-IR region, and can mask the absorption bands corresponding to other biochemical components of the sample. Thus, many studies have been carried out on dried biological samples in order to eliminate the detrimental effect on the resultant spectra caused by water molecules
[53][54][53,54]. However, spectral differences were observed in fixed or dried samples and the samples in their hydrated or natural aqueous state, which may vary with their hydration state
[55][56][55,56]. Zohdi et al.
[55] demonstrated that the FTIR spectral information obtained from rodent heart and liver tissues preserved through desiccation drying, ethanol substitution, or formalin fixation changed compared to the spectra of fresh hydrated tissue samples, whereby the position and profile of the amide I band varied with the preparation approach and observable intensity loss of lipid absorption occurred when the tissues were hydrated with ethanol.
FTIR coupled with ATR is ideal for biological samples, including biofluids
[57][58][59][60][57,58,59,60], tissues
[61][62][63][64][61,62,63,64], and cells
[65][66][67][65,66,67]. One of the main advantages of ATR is based on the use of the surface layer technique, which depends on the interaction between the generated evanescent waves and a few micrometers thick surface layer of the sample. This makes the measurements less likely to be affected by sample thickness, which also allows for simpler sample preparation. However, the sample needs to be at least three- to four-fold thicker than the penetration depth to prevent spectral artefacts with the IRE substrates
[32]. Unlike transmission and transflection FTIR spectroscopy, given its small depth of beam penetration due to close proximity between the ATR element and samples, its small effective path length can prevent signal saturation and makes it applicable to aqueous samples, which allows the entire range of the MIR region, including the region corresponding to O-H vibrational modes, to remain accessible
[47][68][47,68]. ATR-FTIR is thus a more preferable option for studying both dried and hydrated biological samples. Gulley-Stahl et al.
[69] demonstrated that ATR-FTIR imaging produced images and resultant spectra with negligible scattering effects even when the biopsied kidney sample contained small amount of mineral that had a high refractive index. ATR-FTIR could thus eliminate spectral artifacts, which have always been an issue in transmission and transflection FTIR. Moreover, in contrast to transmission mode, ATR-FTIR does not need expensive substrates for analysis.