 +1 credit
| Version | Summary | Created by | Modification | Content Size | Created at | Operation |
|---|---|---|---|---|---|---|
| 1 | Chiara Schirripa Spagnolo | -- | 7682 | 2022-12-14 21:13:34 | | | |
| 2 | Lindsay Dong | -3854 word(s) | 3828 | 2022-12-19 05:05:01 | | | | |
| 3 | Lindsay Dong | Meta information modification | 3828 | 2022-12-19 05:18:29 | | | | |
| 4 | Lindsay Dong | Meta information modification | 3828 | 2022-12-19 05:20:32 | | |
Video Upload Options
Probe choice in single-molecule microscopy requires deeper evaluations than those adopted for less sensitive fluorescence microscopy studies. Fluorophore characteristics can alter or hide subtle phenomena observable at the single-molecule level, wasting the potential of the sophisticated instrumentation and algorithms developed for this kind of advanced applications. The three typical groups of fluorophores are fluorescent proteins, organic dyes and quantum dots; here their advantages, drawbacks and use in single-molecule microscopy are discussed. Some requirements are common to all applications, such as high brightness and photostability, specific and efficient labeling, controlled stoichiometry, no perturbation on the system. Other requirements depend on the specific type of single-molecule technique; some of them are here described with their specific requirements for probe choice.
1. Single-Molecule Techniques
Three important classes of single-molecule techniques are single-molecule FRET (smFRET), single-molecule tracking (SMT, also called single-particle tracking (SPT)), and single-molecule localization microscopy (SMLM) (Figure 1).
FRET is a powerful approach for studying intramolecular and intermolecular interactions (Figure 1A). At the single-molecule level, it allows observation of rare states and characterization of detailed kinetics. FRET consists in an energy transfer from an excited fluorophore (the donor) to another one (the acceptor) when they are close enough (typically in the nanometer range). A spectral overlap between donor emission and acceptor absorption is necessary for an efficient transfer. Other requirements are: low cross-talk between the channels (low donor emission leakage in the acceptor emission window and minimum direct acceptor excitation), high photostability (low photobleaching and intensity fluctuations), and, mostly in the single molecule case, similar quantum yields and detection efficiencies of donor and acceptor [1][2].
SMT consists in the reconstruction of the trajectories of single molecules (Figure 1B). An essential requirement is the ability to follow the molecules for enough time, so the probe must be resistant to photobleaching. Moreover, intensity fluctuations are not desirable because they cause interruptions in tracks. An accurate track reconstruction also requires a high time resolution: higher SNR allows shorter integration times per frame and a larger number of sample points for reconstructing tracks [3][4].
In SMLM, individual fluorescent molecules are localized with resolutions of the order of nanometers or tens of nanometers, starting from diffraction-limited images, thanks to the activation of small subsets of molecules per cycle [5][6] (Figure 1C). The fundamental requirement is a mechanism that ensures stochastic transitions between “Off” and “On” states, which must lead to sparse activations in order to have only one On-dye in a diffraction-limited area. This requires a low On/Off duty cycle (defined as the fraction of time a fluorophore spends in the On state) and long-lived dark states. Other requirements are high photon counts per switching event and generally a high number of switching cycles [7][8].
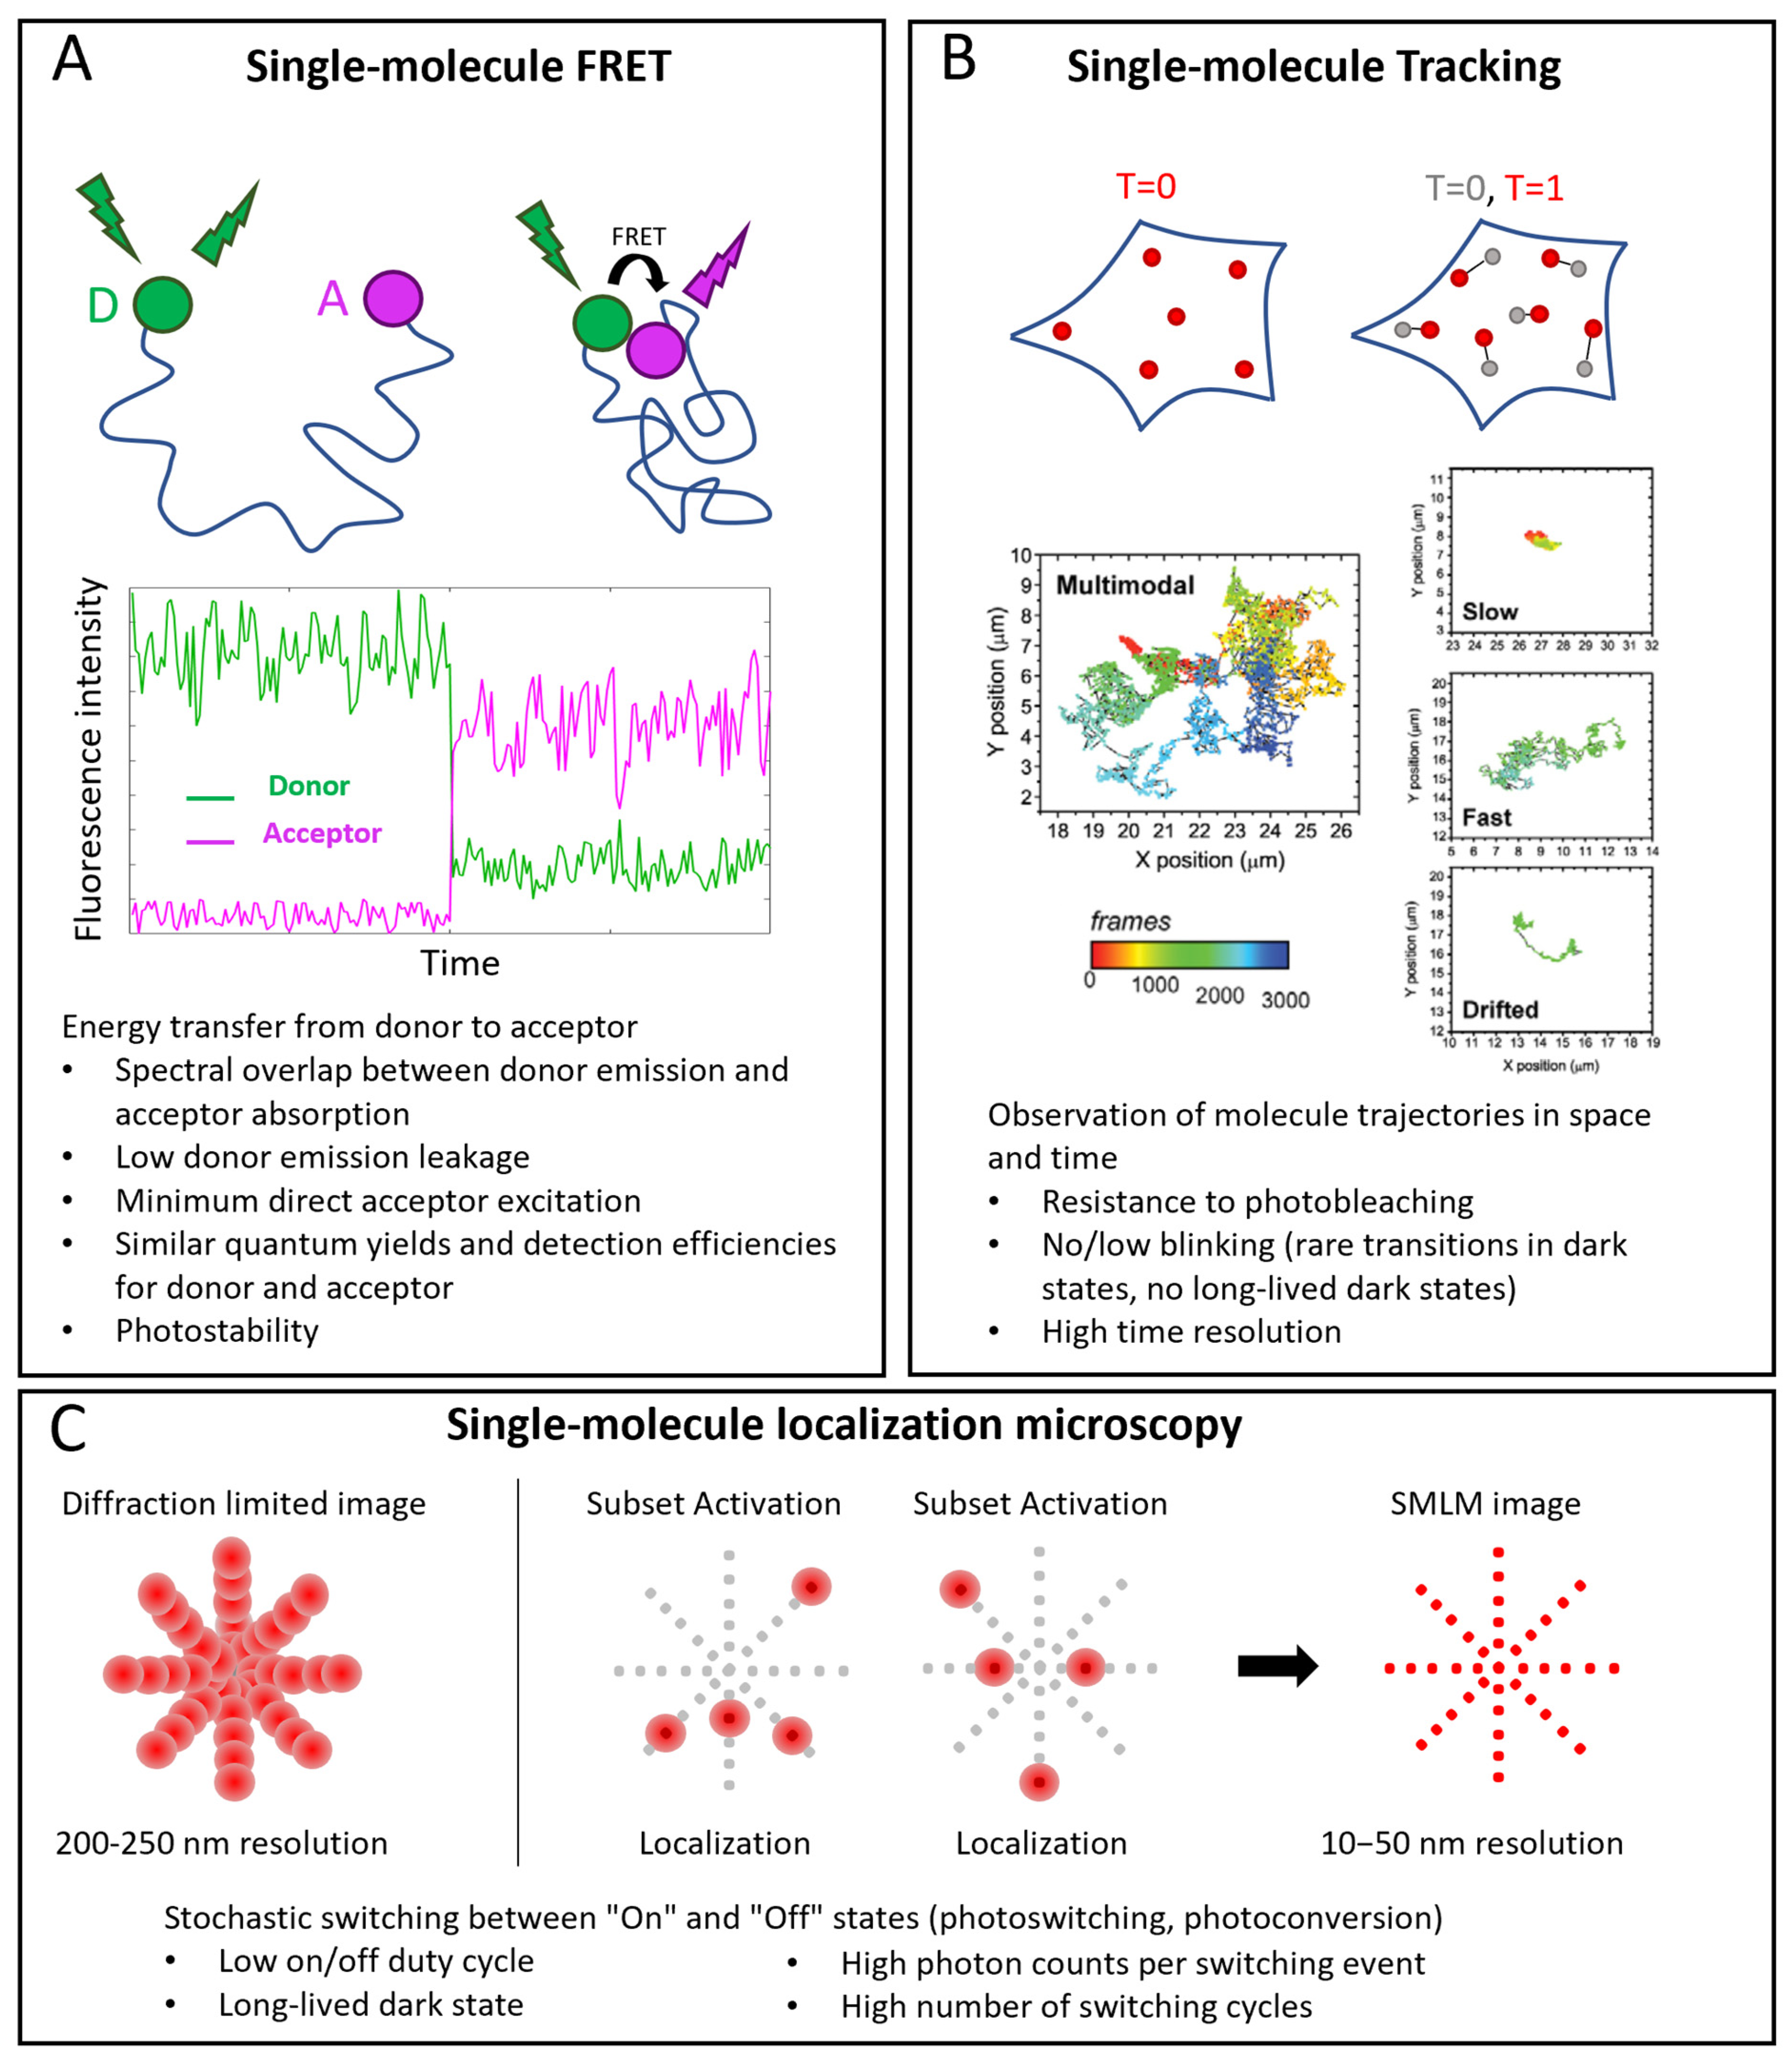
Figure 1. Single-molecule applications in microscopy. (A) smFRET. Top: example of conformational study: donor (D) and acceptor (A) probes label two sites of the same molecule. When the sites are distant, no FRET occurs: under D excitation, only its emission is detected; when the sites are near enough (typically a few nm), FRET occurs: when D is excited, emission of A is detected. Middle: example of corresponding single-molecule intensity traces. (B) Single-molecule tracking. Positions of labeled molecules are determined at different time points and their trajectories are reconstructed. Examples of tracks reproduced with permission from [9] (© 2013 The Company of Biologists Ltd.), where TrkA receptors were labeled with Quantum Dots. Multimodal tracks include periods of slow, fast and drifted motions. (C) Single-molecule localization microscopy (SMLM). Top, left: in conventional diffraction-limited images, resolution is around 200–250 nm, so that PSFs of close emitters overlap. Top, right: SMLM exploits activation of small subsets of probes at a time to have nonoverlapping point spread functions (PFSs), localize them individually and reconstruct images with 10–50 nm resolution. In the bottom part of each panel, specific probe requirements for each technique are highlighted.
2. Fluorescent Proteins
The discovery of the green fluorescent protein (GFP) in the early 1960s revolutionized biological investigations, and in the last 30 years, it has seen extensive use [10][11]. Fluorescent proteins (FPs) from different species and several mutants have expanded the color palette of this kind of fluorescent reporter [12][13]. One of the advantages of FPs is their intrinsically specific labeling with controlled stoichiometry, thanks to the fact that their DNA sequence is genetically fused to the one of the molecule of interest. The only impact of aspecific labeling could arise from the partial degradation of the chimeric protein. Moreover, the system can be used in many contexts, such as cells, tissue, yeasts, and bacteria, with better biocompatibility compared to the other kinds of probes. At the same time, there are some downsides. FPs are less bright and photostable than organic fluorophores or Qdots. They are also larger than organic fluorophores (even if smaller than Qdots), so they are more likely to introduce perturbation in some processes. Indeed, FPs are ~25 kD in size, while organic fluorophores have average sizes typically less than 1 kD [13]. Another critical point is that many FPs tend to oligomerize [14]. This tendency may depend on some experimental conditions, such as concentration, so an assessment of the phenomenon in the context of interest can be required to avoid artifacts [15][16][17][18].
In particular, for smFRET, the most common pair consists of a cyan-emitting variant (cyan fluorescent protein, CFP) and a yellow-emitting variant (yellow fluorescent protein, YFP) [19]. However, some limitations are associated with this FRET pair and multiple factors must be considered to allow quantitative measurements: overlap of donor and acceptor emissions, dependence of YFP properties on environmental conditions (e.g., pH), complex photokinetics such as reversible photobleaching or photoconversion of YFPs into CFP-like FPs, low brightness of CFP, and dimerization tendency [19][20][21]. Advanced versions of CFP and YFP have been developed to improve these factors, such as eCFP, Cerulean, mTurquoise, mCerulean3, mTFP1, Aquamarine for the first; EYFP, mVenus, mCitrine, sEYFP, YPet, for the second [19][20][22][23][24]. These reduced some of the mentioned weaknesses, although only partially. Green donors (GFP and enhanced versions eGFP, Clover, mNeonGreen) with red acceptors (such as mCherry, monomeric DsRed, RFP or mRuby) have been proposed and used as well [18][21][25]. This approach allows for lower induced autofluorescence, less phototoxicity, greater separation of spectra and resistance to environmental changes [20][22]. However, red FPs typically have low brightness, with a FRET emission that can be too weak even compared to the donor emission tail [22]. Recently, there have been efforts to develop new versions of red-emitting FPs to make up for the lack of bright and stable red fluorescent proteins, especially for FRET applications [26][27][28].
Live-cell SMLM was enabled by the development of photoactivatable fluorescent proteins, which are still widely used in particular for photoactivated localization microscopy (PALM) [29][30][31][32]. Employment of FPs was also favored by the ease of performing intracellular labeling in live cells, not possible with labeled antibodies or with many membrane-impermeable organic dyes and dye conjugates [33][34]. Several types of FPs suitable for SMLM have been engineered, including irreversible photoactivatable FPs (PA-FPs), photoconvertible or photoshiftable FPs (PS-FPs) and reversible PA-FPs (also called photoswitchable FPs) [5][35][36][37][38]. A summary of the photoswitching properties of selected FPs and an overview of their SMLM applications are available in [39].
FPs have been employed in SMT as well [40][41], even if their limited brightness and photostability usually lead researchers to prefer other kinds of probes for better SNR, time resolution and total observation time, especially for studies on molecules with faster diffusion. FPs are used in a specific type of SPT based on photoactivated localization microscopy, sptPALM, where the trajectories of a few photoactivated FPs are followed [32][42][43][44][45].
3. Organic Dyes
Organic dyes, in comparison to FPs, have higher brightness, less photobleaching, wider available spectral range and smaller size [46]. The main weaker aspect compared to FPs is that labeling is not genetically encoded, so it requires additional steps such as chemical coupling reactions; these can be laborious, require controls of labeling efficiency and lead to aspecific labeling and interactions [47][48][49]. Extensive washing is usually necessary to try to remove unbound dyes, but this must be mild for preserving cell adhesion and functioning, so it is usually not fully effective. Moreover, the time needed for washing makes time-dependent assays difficult.
Labeling can be performed using antibodies chemically conjugated with fluorescent dyes (direct or indirect immunostaining [50]). One of the main limitations of this labeling method arises from the relatively large size of antibodies (150 kDa, ~10 to 15 nm), which nullifies the advantage of organic dyes’ small size. To reduce the possible hindrance, it is possible to use smaller Fab (fragment antigen-binding) fragments (55 kDa, ~5 to 6 nm), or nanobodies (15 kDa, ~4 nm) [51][52][53]. Fab fragments have been used for single-molecule fluorescence microscopy in living cells, e.g., in labeling CD59 receptors with Alexa 647 [54] or CD36 receptors with Cy3 [55].
Another class of strategies to perform fluorescent labeling with organic dyes is based on the genetic insertion of a protein/peptide tag in a protein to be labeled. The tag is recognized and bound by specific chemical motifs, which are bound to or are part of the dyes. A specific and strong conjugation between the dye and a short peptide tag is often achieved by exploiting enzymes that catalyze the covalent bond between them or by exploiting click chemistry. Extensive reviews about protein/peptide tags useful for fluorescent labeling can be found in [56][57][58][59]. The most used approaches, especially for single-molecule imaging, are based on SNAP-tag [60], CLIP-tag [61], HaloTag [62][63][64], and ACP and related tags [65][66] (Figure 2).SNAP-tag is a 20 kDa (30-residue) self-labeling protein tag, engineered to react efficiently with benzylguanine (BG) derivatives, resulting in a covalent link (Figure 2A). Several popular organic dyes suitable for single-molecule applications are commercially available from New England Biolabs (Ipswich, MA, USA), as ready-to-use BG substrates, e.g., Alexa, Atto, or Dyomics dye derivatives. Additional ones can be prepared via a reaction of BG-NH2 (New England Biolabs) with N-hydroxysuccinimide ester (NHS) forms of the dyes (example of protocols is available in [67]), typically commercially available for dyes of practically all companies. SNAP-tag technology can be used for both extra- and intracellular labeling: in the first case, using non-cell-permeable substrates such as SNAP-Surface® (New England Biolabs), for studying, e.g., membrane receptors [68][69]; in the second case, using cell-permeable substrates such as SNAP-Cell® (New England Biolabs) or Janelia Fluor dyes, a quite recent family of cell-permeable fluorophores for single-molecule imaging [70] (protocols for the synthesis of SNAP-tag ligands of Janelia Fluor and subsequent labeling can be found in [71]).
CLIP-tag is another 20 kDa self-labeling protein tag engineered from SNAP as an orthogonal labeling system, accepting benzylcytosine (BC) derivatives as substrates (Figure 2B). By using the two tags, it is possible to obtain simultaneous and orthogonal two-color labeling with two different dyes [72].
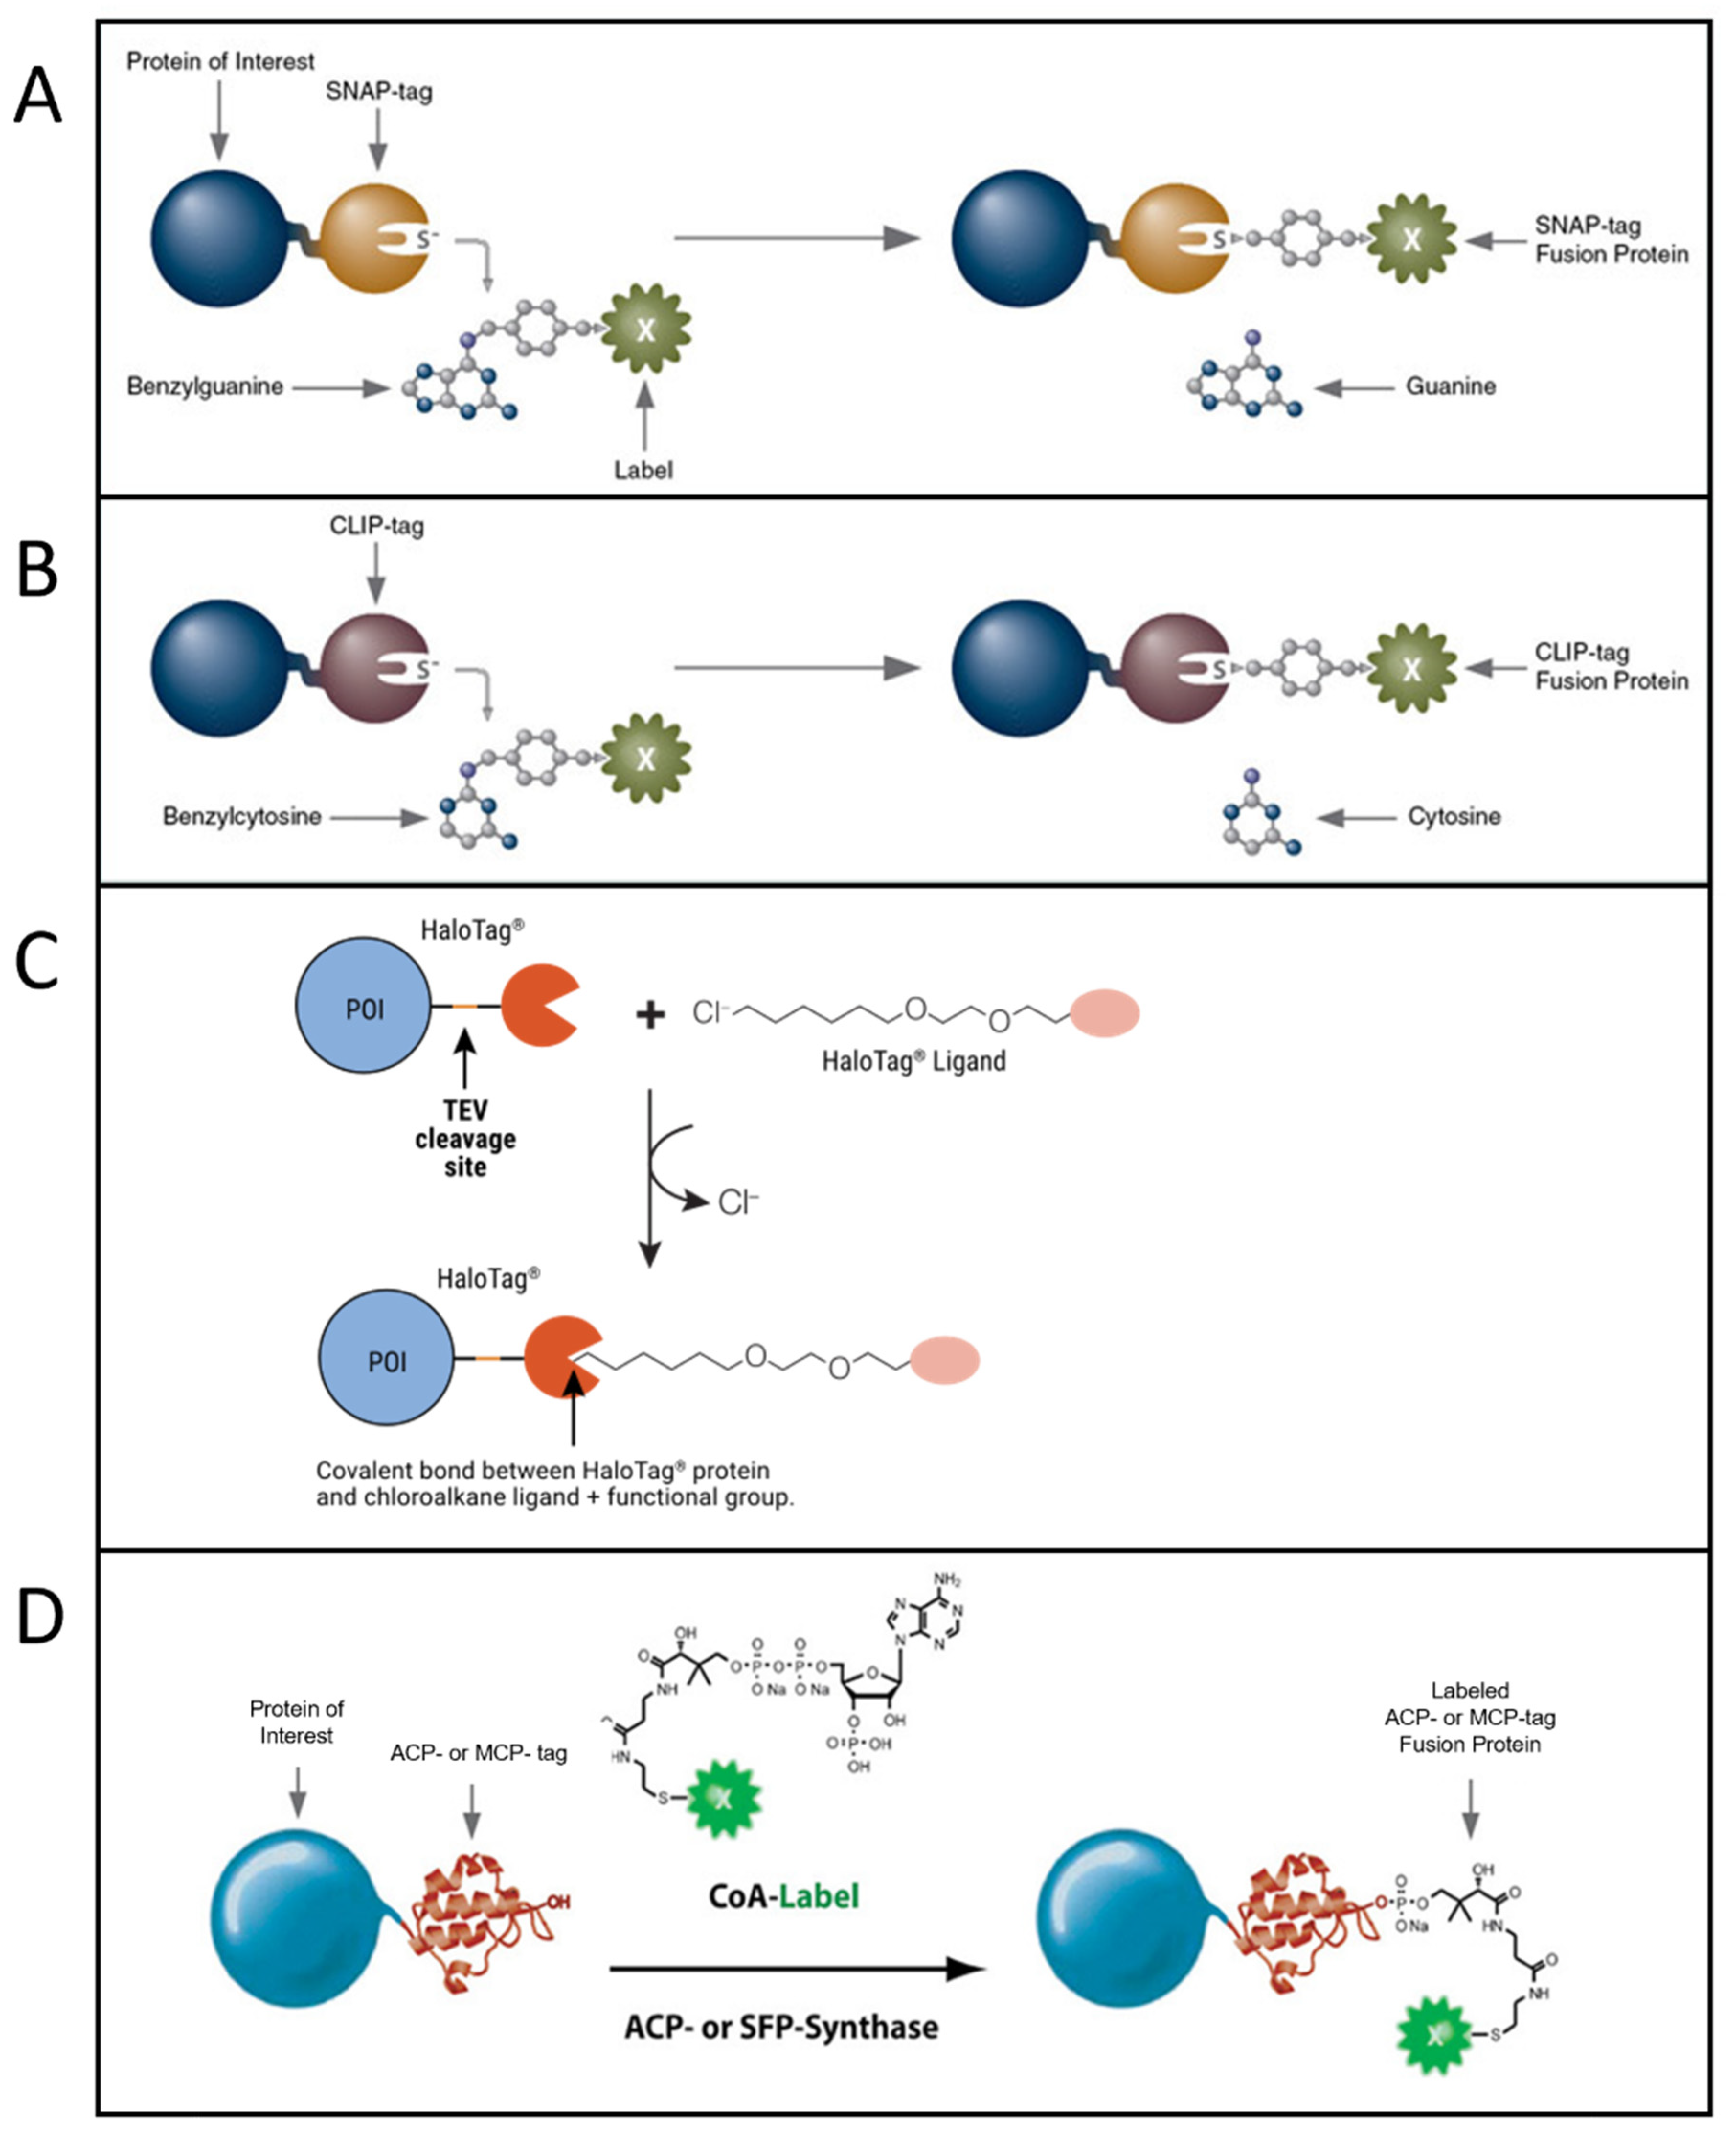
Figure 2. Most popular tag-based labeling strategies. (A) SNAP-tag. A benzylguanine—derivative of the label reacts with the self-labeling SNAP-tag fused to the protein of interest (image from https://www.addgene.org accessed on 20 October 2022). (B) CLIP-tag. A benzylcytosine—derivative of the label reacts with the self-labeling CLIP-tag fused to the protein of interest (image from https://www.addgene.org accessed on 20 October 2022). (C) Halo-tag. A chloroalkane—derivative of the label reacts with the self-labeling Halo-tag fused to the protein of interest (POI) (image from [66] used with permission from Promega Corporation), TEV: Tobacco Etch Virus. (D) ACP-tag. The enzyme ACP- (or SFP-) synthase catalyzes the attachment of a Coenzyme A (CoA)-label to the ACP- (or MCP-) tag fused to the protein of interest (image from https://www.addgene.org accessed on 20 October 2022).
HaloTag is a self-labeling protein tag that reacts specifically with chloroalkane (CA)-derivatized fluorophores (Figure 2C). Like SNAP and CLIP, it leads to specific and covalent linkage. It is larger than SNAP and CLIP, being 33 kDa and having 297 residues. Complete protocols for HaloTag-based labeling (generating a HaloTag fusion protein, generating Halo fluorophore ligands starting from their NHS forms, labeling) are provided by Promega [73]. Protocols for single-molecule tracking inside the nucleus of living cells exploiting HaloTag labeling are available in the literature as well [74]. Some ready-to-use dyes for HaloTag labeling are available from Promega (including some for intracellular labeling, e.g., tetramethylrhodamine (TMR), Oregon Green, Janelia Dyes, and others for labeling on the cell membrane, e.g., Alexa 488 and 660).
Another group of tags has been engineered from the acyl-carrier protein (ACP). These are enzyme-mediated labeling tags: phosphopantetheine transferase (PPTase) enzymes catalyze the covalent conjugation of a phosphopantetheine-dye to a serine residue in the tag (Figure 2D). The first developed tags were the peptidyl-carrier protein (PCP) and acyl-carrier protein (ACP, also with its mutant MCP) domains (80–120 residues, ~9 kDa in size and so smaller than SNAP, CLIP and Halo Tag) [65][75][76]. These tags were further optimized to obtain even shorter tags, such as the YBBR (11 residues), S6 (12 residues) and A1 (12 residues) [64][77][78]. In this group of tags, couples allowing orthogonal labeling with two different probes were identified, i.e., ACP-MCP or the shorter tags A1-S6. Orthogonality is achieved because two different enzymes, Sfp and AcpS, have to be used for the labeling [78]. Organic dyes in phosphopantetheine form can be obtained via conjugation with coenzyme A (CoA), obtainable from the maleimide reactive form of the dye reacting with CoA via a thiol-maleimide reaction. Protocols for production of PPTase enzymes AcpS and Sfp, synthesis and purification of CoA–dye conjugates, and expression and labeling of tagged proteins can be found in [79][80]. CoA-conjugated probes are not cell-permeable, so labeling of ACP-derived tags in living cells can be performed only on the cell membrane.
Organic dyes have been widely employed in single-molecule applications. Different couples of organic dyes have been used for smFRET, like the very popular Cy3/Cy5 or Atto 550/Atto 647N, but also Alexa 555/Alexa 647, Atto 532/Atto 647N, Atto 488/Atto 647N, Alexa 488/Alexa 594, Alexa 488/Alexa 555, Alexa 488/Atto 647N [2][81][82][83][84][85][86][87]. Förster radii of couples of Atto dyes can be found at [88], and of couples of Alexa dyes can be found at [89]. Even multicolor smFRET has been achieved with organic dyes [90][91][92][93].
Organic dyes were used in many more SMT experiments than FPs. They allowed tracking a variety of biomolecules on the cell membrane and in different cell compartments, in order to study several processes, among which an established example is diffusion and interactions of receptors [72][94]. Their current levels of brightness and photostability limit simultaneous multicolor studies or registration of very long trajectories (for these purposes, Qdots are more often exploited, as discussed in the following). Tracking duration is typically limited to about 10 s. However, there is a continuous effort to improve the photostability of organic dyes. It is known that their photodegradation can be caused by both oxygen-dependent and oxygen-independent processes and that the triplet state plays a fundamental role, although higher excited states can be involved as well. The exact mechanisms are not fully understood and depend on the specific conditions. Approaches for improving photostability are based on deoxygenation methods or on the use of additives in the medium such as antioxidants, triplet state quenchers, oxidizing and/or reducing agents [95].
Organic dyes are used in SMLM as well, in particular in stochastic optical reconstruction microscopy (STORM) [96]. The principle of STORM is similar to that of PALM, but in this case the photoswitching of fluorophores is random and requires special buffers, which are not suitable for living cells [7][33]. The most used formulations consist of deoxygenated solutions containing a thiol, where deoxygenation is achieved by enzymatic (e.g., via glucose oxidase and catalase, galactose oxidase, Oxyrase) or nonenzymatic (e.g., via methylene blue and a thiol) approaches; different types of thiols have been used (e.g., β-mercaptoethylamine, cysteine, glutathione). These buffers work for several but not all dyes, and the effects of the different buffer components on the photochemical mechanisms are not well understood yet. Different dyes can require different conditions for optimal photoswitching, either in buffer composition or additive concentrations [39]. A summary of the photoswitching properties of selected organic fluorophores and an overview of their SMLM applications are available in the literature [39]. A recent field of research focuses on the development of spontaneous blinking dyes, which require no special buffers nor additives and not even high excitation power to perform SMLM; therefore, they can allow more flexible and cell-friendlier studies [97][98][99]. Another way to perform SMLM with organic dyes without special buffers is the method of point accumulation for imaging in nanoscale topography (PAINT) [100][101]. Instead of using photoswitching, this technique exploits stochastic and transient binding to the target of freely diffusing probes to visualize small subsets of molecules at a time. This allows more freedom in the dye choice. The most recent approach is DNA-PAINT, where fluorescently labeled DNA oligonucleotides diffuse freely in solution and can bind transiently to targets labeled with complementary DNA strands [102][103][104].
4. Quantum Dots and Other Nanoparticles
Quantum dots (QDs) have the great advantage of being brighter than organic dyes (and FPs), thanks to much higher extinction coefficients; moreover, they are not affected by photobleaching. The main limitation concerns their relatively large size. Functionalized QDs usually are 15–50 nm in size (diameter), bigger than organic dyes (<1 nm) and even than FPs (about 4 nm) [105][106].
The most used methods for labeling with QDs exploit antibodies or the streptavidin-biotin interaction (Figure 3A,B). QDs conjugated with streptavidin or with different kinds of antibodies are commercially available in ready-to-use formulations (e.g., by Thermofisher).
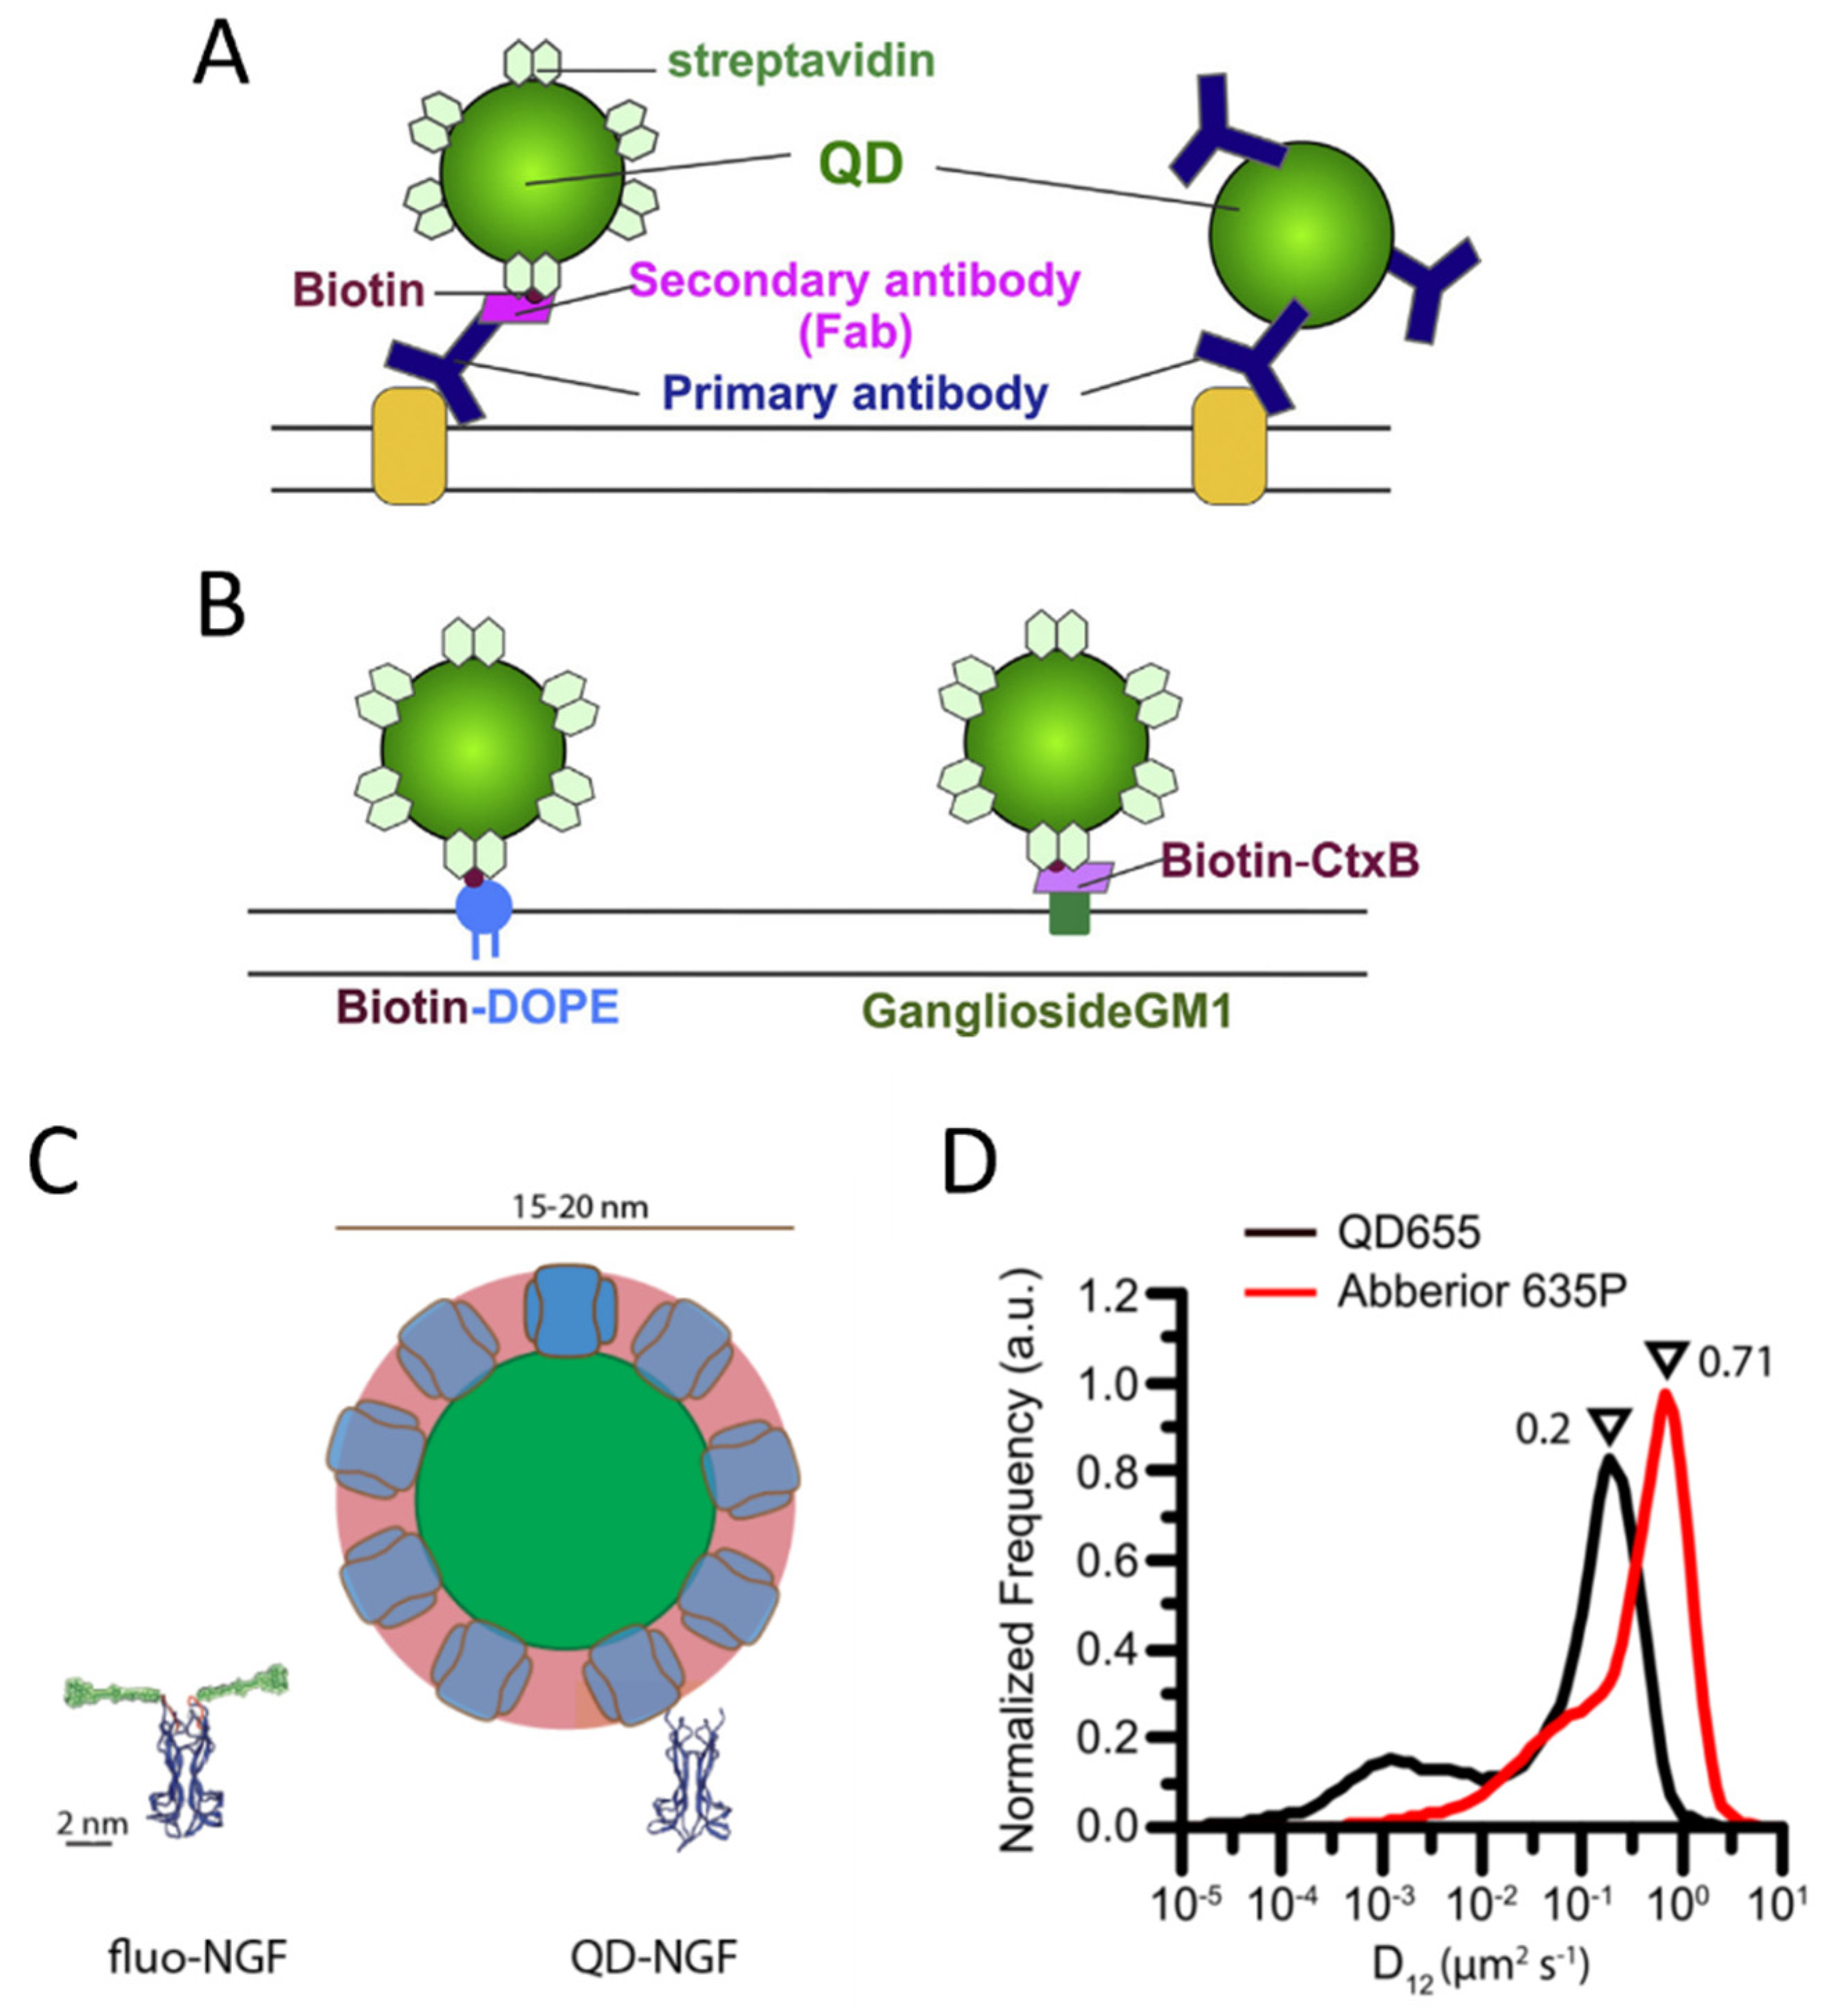
Figure 3. Labeling of membrane molecules with quantum dots. (A) Example of labeling based on antibodies. Left: a membrane molecule is recognized by a primary antibody, a biotinylated Fab fragment of the secondary antibody binds to the primary antibody, and streptavidin quantum dot (QD) binds to biotin. Right: QD is directly conjugated with the primary antibody. (B) Labeling of biotinylated molecules with streptavidin QDs. Labeling of a phospholipid (left) and a lipid raft component, the ganglioside GM1 recognized by a biotinylated cholera toxin B subunit (CtxB, right), are reported as examples. (A,B) are reprinted from [107] with permission (copyright 2018, Elsevier). (C,D) represent examples of hindrance caused by QD labeling. (C) Visual comparison between YBBR-tagged-NGF (nerve growth factor) labeled with organic dye and biotinylated NGF labeled with streptavidin QD (only backbone represented for NGF and tag, reprinted from [108]). (D) Labeling by QDs causes a slowing down of p75NTR receptors compared to labeling by smaller organic dyes, with a maximum in the reported measured diffusion coefficient distributions that decreases from 0.71 to 0.2 µm2/s (reprinted from [94]).
Alternative strategies for covalent labeling with QDs still need improvement and, in general, are not usually employed.
Since extracellular targets are accessible to QD labeling, many SMT studies exist on various membrane molecules, such as receptors [109][110], ion channels [111][112] and lipids [113][114], resulting in longer tracks in comparison to organic dyes [106]. On the other side, the internalization of QDs and QD conjugates into the cytoplasm of living cells for intracellular imaging is challenging. Several methods have been tested, e.g., electroporation, microinjection, liposome fusion, and cell-penetrating peptides, but these approaches often cause QD aggregation and limited stability within the cytoplasm [115][116].
An intermittent behavior for QD emission (blinking) has often been reported [117], which could cause interruptions in track reconstruction. However, several strategies have been developed to reduce QD blinking, so the phenomenon has been improved over the years [118][119]. Moreover, tracking algorithms can afford the problem of temporary missing spots: especially in conditions of high SNR, as in the case of QDs, they allow for obtaining reliable tracking solutions [120][121].
QDs were particularly preferred over organic dyes for multicolor SMT studies because they allow for easier implementation of the microscopy setup. Indeed, QDs have excitation spectra that increase towards the UV, such that probes emitting in different colors can be excited with one single wavelength; moreover, contrary to organic dyes, QDs have relatively narrow and symmetric emission spectra, without a tail at longer wavelengths, so many different channels can be better separated without spectral overlap [122][123][124][125][126].
However, some studies highlighted perturbations of biomolecule behavior caused by QD labeling, e.g., QD labeling based on biotin–streptavidin conjugation caused a decreased diffusion coefficient for p75NTR receptors compared to labeling with small organic dyes on S6-tag, as observed with SMT on the membrane of living cells [94] (Figure 3D). Hindrance of receptor mobility has also been observed on B cell receptors [127]. A study employing single-molecule imaging and tracking of YBBR-tagged neurotrophins labeled with a small organic dye revealed that their signaling endosomes contain clusters of NGF made of 2–8 dimers [108], while a previous study with streptavidin-QD labeling of biotinylated NGF detected a single NGF dimer per vesicle [128]. The discrepancy has been explained on the basis of the different sizes and steric hindrance of the labeling (Figure 3C): QD labeling introduces a volume up to 70 times larger than NGF; using smaller organic dyes might allow accommodating a physiologically higher number of clustered NGF molecules in the same vesicle [108]. The impact of more cumbersome labeling may depend on the considered system and the measurements of interest. Abraham et al. demonstrated that, even if QDs labeling caused a general slowdown, it allowed detecting large differences in receptor mobility, such as changes caused by destruction of the actin cytoskeleton, on par with organic dyes [127]. The impact of QD-labeling complexes is likely more evident on small, fast-diffusing and flexible molecules [94], while others can be less or not significantly influenced. Indeed, as mentioned before, several SMT studies have been performed using QD labeling and obtained relevant results [109][110][111][112][113].
The application of QDs in FRET and smFRET is not as widespread as for organic dyes or FPs [2][105][129][130]. The typical configuration involving QDs is based on a QD as donor and a different kind of probe (often an organic dye) as acceptor [131][132]. Indeed, the employment of QDs as donors benefits from their high extinction coefficient for efficient donor excitation, their broad excitation spectra for efficient excitation/emission light separation, and their narrow and symmetric emission for cross-talk minimization. On the contrary, their use as acceptors is very challenging: their high extinction coefficient and broad excitation spectrum make it nearly impossible to avoid direct acceptor excitation upon excitation of the donor fluorophore.
QDs are less used than FPs or organic dyes in SMLM [5]. QDs typically exhibit intrinsic blinking; however, exploiting this property for STORM has proven difficult. Indeed, QDs show a small Off/On time ratio, which makes it hard to create the desired large population of Off-probes. As a result, multiple emitters overlap in a diffraction-limited volume, limiting the ability to localize single contributions [133][134]. Moreover, QDs cannot be photoactivatable/switchable [134].
QDs are the most used inorganic nanoparticles in single-molecule microscopy. Of note, other kinds of nanoparticles have been used or are being developed, especially in SMT. These include upconversion nanoparticles (UCNPs), polymer dots (PDots), fluorescent nanodiamonds (FNDs). These are even brighter and more photostable than QDs. Tracking time ranges from tens of minutes up to hours with localization accuracies of a few nm [135]. A recent study exploited UCNPs to perform single-particle tracking on molecular motors in live cells, achieving 2.4 nm localization accuracy with 2 ms time resolution [136]. However, several challenges still limit the use of these powerful probes, mainly due to large sizes (UCNPs have sizes of 40–50 nm) and complex surface chemistries. As discussed for QDs, these features make it hard to obtain efficient and specific labeling or intracellular delivery and may induce perturbation on some labeled molecules, and these problems are even more severe than in the case of QDs [135].
References
- Ha, T. Single-Molecule Fluorescence Resonance Energy Transfer. Methods 2001, 25, 78–86, doi:10.1006/meth.2001.1217.
- Roy, R.; Hohng, S.; Ha, T. A Practical Guide to Single-Molecule FRET. Nat. Methods 2008, 5, 507–516.
- Manzo, C.; Garcia-Parajo, M.F. A Review of Progress in Single Particle Tracking: From Methods to Biophysical Insights. Reports Prog. Phys. 2015, 78.
- P. Clausen, M.; Christoffer Lagerholm, B. The Probe Rules in Single Particle Tracking. Curr. Protein Pept. Sci. 2011, 12, 699–713, doi:10.2174/138920311798841672.
- Lelek, M.; Gyparaki, M.T.; Beliu, G.; Schueder, F.; Griffié, J.; Manley, S.; Jungmann, R.; Sauer, M.; Lakadamyali, M.; Zimmer, C. Single-Molecule Localization Microscopy. Nat. Rev. Methods Prim. 2021, 1, doi:10.1038/s43586-021-00038-x.
- Pujals, S.; Albertazzi, L. Super-Resolution Microscopy for Nanomedicine Research. ACS Nano 2019, 13, 9707–9712.
- Dempsey, G.T.; Vaughan, J.C.; Chen, K.H.; Bates, M.; Zhuang, X. Evaluation of Fluorophores for Optimal Performance in Localization-Based Super-Resolution Imaging. Nat. Methods 2011, 8, 1027–1040, doi:10.1038/nmeth.1768.
- Kikuchi, K.; Adair, L.D.; Lin, J.; New, E.J.; Kaur, A. Photochemical Mechanisms of Fluorophores Employed in Single‐Molecule Localization Microscopy. Angew. Chemie Int. Ed. 2022, doi:10.1002/anie.202204745.
- Marchetti, L.; Callegari, A.; Luin, S.; Signore, G.; Viegi, A.; Beltram, F.; Cattaneo, A. Ligand Signature in the Membrane Dynamics of Single TrkA Receptor Molecules. J. Cell Sci. 2013, doi:10.1242/jcs.129916.
- Shimomura, O.; Johnson, F.H.; Saiga, Y. Extraction, Purification and Properties of Aequorin, a Bioluminescent Protein from the Luminous Hydromedusan,Aequorea. J. Cell. Comp. Physiol. 1962, 59, 223–239, doi:10.1002/jcp.1030590302.
- Tsien, R.Y. THE GREEN FLUORESCENT PROTEIN. Annu. Rev. Biochem. 1998, 67, 509–544, doi:10.1146/annurev.biochem.67.1.509.
- Shaner, N.C.; Patterson, G.H.; Davidson, M.W. Advances in Fluorescent Protein Technology. J. Cell Sci. 2007, 120, 4247–4260.
- Kremers, G.J.; Gilbert, S.G.; Cranfill, P.J.; Davidson, M.W.; Piston, D.W. Fluorescent Proteins at a Glance. J. Cell Sci. 2011, 124, 157–160.
- Snapp, E.L. Fluorescent Proteins: A Cell Biologist’s User Guide. Trends Cell Biol. 2009, 19, 649–655, doi:10.1016/j.tcb.2009.08.002.
- Costantini, L.M.; Fossati, M.; Francolini, M.; Snapp, E.L. Assessing the Tendency of Fluorescent Proteins to Oligomerize Under Physiologic Conditions. Traffic 2012, 13, 643–649, doi:10.1111/j.1600-0854.2012.01336.x.
- Zacharias, D.A.; Violin, J.D.; Newton, A.C.; Tsien, R.Y. Partitioning of Lipid-Modified Monomeric GFPs into Membrane Microdomains of Live Cells. Science (80-. ). 2002, 296, 913–916, doi:10.1126/science.1068539.
- Costantini, L.M.; Baloban, M.; Markwardt, M.L.; Rizzo, M.; Guo, F.; Verkhusha, V. V.; Snapp, E.L. A Palette of Fluorescent Proteins Optimized for Diverse Cellular Environments. Nat. Commun. 2015, 6, 1–13, doi:10.1038/ncomms8670.
- Marchetti, L.; Comelli, L.; D’Innocenzo, B.; Puzzi, L.; Luin, S.; Arosio, D.; Calvello, M.; Mendoza-Maldonado, R.; Peverali, F.; Trovato, F.; et al. Homeotic Proteins Participate in the Function of Human-DNA Replication Origins. Nucleic Acids Res. 2010, 38, 8105–8119, doi:10.1093/nar/gkq688.
- Miyawaki, A. Development of Probes for Cellular Functions Using Fluorescent Proteins and Fluorescence Resonance Energy Transfer. Annu. Rev. Biochem. 2011, 80, 357–373, doi:10.1146/annurev-biochem-072909-094736.
- Hochreiter, B.; Garcia, A.P.; Schmid, J.A. Fluorescent Proteins as Genetically Encoded FRET Biosensors in Life Sciences. Sensors (Switzerland) 2015, 15, 26281–26314, doi:10.3390/s151026281.
- Lam, A.J.; St-Pierre, F.; Gong, Y.; Marshall, J.D.; Cranfill, P.J.; Baird, M.A.; McKeown, M.R.; Wiedenmann, J.; Davidson, M.W.; Schnitzer, M.J.; et al. Improving FRET Dynamic Range with Bright Green and Red Fluorescent Proteins. Nat. Methods 2012, 9, 1005–1012, doi:10.1038/nmeth.2171.
- Bajar, B.T.; Wang, E.S.; Zhang, S.; Lin, M.Z.; Chu, J. A Guide to Fluorescent Protein FRET Pairs. Sensors (Switzerland) 2016, 16, 1–24, doi:10.3390/s16091488.
- Rizzo, M.A.; Springer, G.H.; Granada, B.; Piston, D.W. An Improved Cyan Fluorescent Protein Variant Useful for FRET. Nat. Biotechnol. 2004, 22, 445–449, doi:10.1038/nbt945.
- Piston, D.W.; Kremers, G.J. Fluorescent Protein FRET: The Good, the Bad and the Ugly. Trends Biochem. Sci. 2007, 32, 407–414, doi:10.1016/j.tibs.2007.08.003.
- Albertazzi, L.; Arosio, D.; Marchetti, L.; Ricci, F.; Beltram, F. Quantitative FRET Analysis with the E0GFP-MCherry Fluorescent Protein Pair. Photochem. Photobiol. 2009, 85, 287–297, doi:10.1111/j.1751-1097.2008.00435.x.
- Mo, G.C.H.; Posner, C.; Rodriguez, E.A.; Sun, T.; Zhang, J. A Rationally Enhanced Red Fluorescent Protein Expands the Utility of FRET Biosensors. Nat. Commun. 2020, 11, 1–9, doi:10.1038/s41467-020-15687-x.
- Bindels, D.S.; Haarbosch, L.; Van Weeren, L.; Postma, M.; Wiese, K.E.; Mastop, M.; Aumonier, S.; Gotthard, G.; Royant, A.; Hink, M.A.; et al. MScarlet: A Bright Monomeric Red Fluorescent Protein for Cellular Imaging. Nat. Methods 2016, 14, 53–56, doi:10.1038/nmeth.4074.
- Bajar, B.T.; Wang, E.S.; Lam, A.J.; Kim, B.B.; Jacobs, C.L.; Howe, E.S.; Davidson, M.W.; Lin, M.Z.; Chu, J. Improving Brightness and Photostability of Green and Red Fluorescent Proteins for Live Cell Imaging and FRET Reporting. Sci. Rep. 2016, 6, doi:10.1038/srep20889.
- Betzig, E.; Patterson, G.H.; Sougrat, R.; Lindwasser, O.W.; Olenych, S.; Bonifacino, J.S.; Davidson, M.W.; Lippincott-Schwartz, J.; Hess, H.F. Imaging Intracellular Fluorescent Proteins at Nanometer Resolution. Science (80-. ). 2006, 313, 1642–1645, doi:10.1126/science.1127344.
- Shroff, H.; Galbraith, C.G.; Galbraith, J.A.; Betzig, E. Live-Cell Photoactivated Localization Microscopy of Nanoscale Adhesion Dynamics. Nat. Methods 2008, 5, 417–423, doi:10.1038/nmeth.1202.
- Biteen, J.S.; Thompson, M.A.; Tselentis, N.K.; Bowman, G.R.; Shapiro, L.; Moerner, W.E. Super-Resolution Imaging in Live Caulobacter Crescentus Cells Using Photoswitchable EYFP. Nat. Methods 2008, 5, 947–949, doi:10.1038/nmeth.1258.
- De Zitter, E.; Thédié, D.; Mönkemöller, V.; Hugelier, S.; Beaudouin, J.; Adam, V.; Byrdin, M.; Van Meervelt, L.; Dedecker, P.; Bourgeois, D. Mechanistic Investigation of MEos4b Reveals a Strategy to Reduce Track Interruptions in SptPALM. Nat. Methods 2019, 16, 707–710, doi:10.1038/s41592-019-0462-3.
- Henriques, R.; Griffiths, C.; Rego, E.H.; Mhlanga, M.M. PALM and STORM: Unlocking Live-Cell Super-Resolution. Biopolymers 2011, 95, 322–331, doi:10.1002/bip.21586.
- Niu, L.; Yu, J. Investigating Intracellular Dynamics of FtsZ Cytoskeleton with Photoactivation Single-Molecule Tracking. Biophys. J. 2008, 95, 2009–2016, doi:10.1529/biophysj.108.128751.
- Fernández-Suárez, M.; Ting, A.Y. Fluorescent Probes for Super-Resolution Imaging in Living Cells. Nat. Rev. Mol. Cell Biol. 2008, 9, 929–943.
- Wang, S.; Moffitt, J.R.; Dempsey, G.T.; Xie, X.S.; Zhuang, X. Characterization and Development of Photoactivatable Fluorescent Proteins for Single-Molecule-Based Superresolution Imaging. Proc. Natl. Acad. Sci. U. S. A. 2014, 111, 8452–8457, doi:10.1073/pnas.1406593111.
- Tao, A.; Zhang, R.; Yuan, J. Characterization of Photophysical Properties of Photoactivatable Fluorescent Proteins for Super-Resolution Microscopy. J. Phys. Chem. B 2020, 124, 1892–1897, doi:10.1021/acs.jpcb.9b11028.
- Luin, S.; Voliani, V.; Lanza, G.; Bizzarri, R.; Amat, P.; Tozzini, V.; Serresi, M.; Beltram, F. Raman Study of Chromophore States in Photochromic Fluorescent Proteins. J. Am. Chem. Soc. 2009, 131, 96–103, doi:10.1021/ja804504b.
- Li, H.; Vaughan, J.C. Switchable Fluorophores for Single-Molecule Localization Microscopy. Chem. Rev. 2018, 118, 9412–9454, doi:10.1021/acs.chemrev.7b00767.
- Zhang, M.; Zhang, Z.; He, K.; Wu, J.; Li, N.; Zhao, R.; Yuan, J.; Xiao, H.; Zhang, Y.; Fang, X. Quantitative Characterization of the Membrane Dynamics of Newly Delivered TGF-β Receptors by Single-Molecule Imaging. Anal. Chem. 2018, 90, 4282–4287, doi:10.1021/acs.analchem.7b03448.
- Douglass, A.D.; Vale, R.D. Single-Molecule Microscopy Reveals Plasma Membrane Microdomains Created by Protein-Protein Networks That Exclude or Trap Signaling Molecules in T Cells. Cell 2005, 121, 937–950, doi:10.1016/j.cell.2005.04.009.
- Ye, Z.; Li, N.; Zhao, L.; Sun, Y.; Ruan, H.; Zhang, M.; Yuan, J.; Fang, X. Super-Resolution Imaging and Tracking of TGF-β Receptor II on Living Cells. Sci. Bull. 2016, 61, 632–638, doi:10.1007/s11434-016-1043-9.
- Manley, S.; Gillette, J.M.; Patterson, G.H.; Shroff, H.; Hess, H.F.; Betzig, E.; Lippincott-Schwartz, J. High-Density Mapping of Single-Molecule Trajectories with Photoactivated Localization Microscopy. Nat. Methods 2008, 5, 155–157, doi:10.1038/nmeth.1176.
- Lee, Y.; Phelps, C.; Huang, T.; Mostofian, B.; Wu, L.; Zhang, Y.; Tao, K.; Chang, Y.H.; Stork, P.J.S.; Gray, J.W.; et al. High-Throughput Single-Particle Tracking Reveals 1 Nested Membrane Domains That Dictate Krasg12d 2 Diffusion and Trafficking. Elife 2019, 8, doi:10.7554/eLife.46393.
- Manley, S.; Gillette, J.M.; Lippincott-Schwartz, J. Single-Particle Tracking Photoactivated Localization Microscopy for Mapping Single-Molecule Dynamics. In Methods in Enzymology; Academic Press Inc., 2010; Vol. 475, pp. 109–120.
- Xia, T.; Li, N.; Fang, X. Single-Molecule Fluorescence Imaging in Living Cells. Annu. Rev. Phys. Chem. 2013, 64, 459–480, doi:10.1146/annurev-physchem-040412-110127.
- Zanetti-Domingues, L.C.; Tynan, C.J.; Rolfe, D.J.; Clarke, D.T.; Martin-Fernandez, M. Hydrophobic Fluorescent Probes Introduce Artifacts into Single Molecule Tracking Experiments Due to Non-Specific Binding. PLoS One 2013, 8, doi:10.1371/journal.pone.0074200.
- Banaz, N.; Mäkelä, J.; Uphoff, S. Choosing the Right Label for Single-Molecule Tracking in Live Bacteria: Side-by-Side Comparison of Photoactivatable Fluorescent Protein and Halo Tag Dyes. J. Phys. D. Appl. Phys. 2019, 52, doi:10.1088/1361-6463/aaf255.
- Bosch, P.J.; Corrêa, I.R.; Sonntag, M.H.; Ibach, J.; Brunsveld, L.; Kanger, J.S.; Subramaniam, V. Evaluation of Fluorophores to Label SNAP-Tag Fused Proteins for Multicolor Single-Molecule Tracking Microscopy in Live Cells. Biophys. J. 2014, 107, 803–814, doi:10.1016/j.bpj.2014.06.040.
- Im, K.; Mareninov, S.; Diaz, M.F.P.; Yong, W.H. An Introduction to Performing Immunofluorescence Staining. In Methods in Molecular Biology; Humana Press Inc., 2019; Vol. 1897, pp. 299–311.
- Tian, H.; Furstenberg, A.; Huber, T. Labeling and Single-Molecule Methods to Monitor G Proteincoupled Receptor Dynamics. Chem. Rev. 2017, 117, 186–245, doi:10.1021/acs.chemrev.6b00084.
- Hayashi-Takanaka, Y.; Stasevich, T.J.; Kurumizaka, H.; Nozaki, N.; Kimura, H. Evaluation of Chemical Fluorescent Dyes as a Protein Conjugation Partner for Live Cell Imaging. PLoS One 2014, 9, doi:10.1371/journal.pone.0106271.
- Oddone, A.; Vilanova, I.V.; Tam, J.; Lakadamyali, M. Super-Resolution Imaging with Stochastic Single-Molecule Localization: Concepts, Technical Developments, and Biological Applications. Microsc. Res. Tech. 2014, 77, 502–509, doi:10.1002/jemt.22346.
- Wieser, S.; Moertelmaier, M.; Fuertbauer, E.; Stockinger, H.; Schütz, G.J. (Un)Confined Diffusion of CD59 in the Plasma Membrane Determined by High-Resolution Single Molecule Microscopy. Biophys. J. 2007, 92, 3719–3728, doi:10.1529/biophysj.106.095398.
- Jaqaman, K.; Kuwata, H.; Touret, N.; Collins, R.; Trimble, W.S.; Danuser, G.; Grinstein, S. Cytoskeletal Control of CD36 Diffusion Promotes Its Receptor and Signaling Function. Cell 2011, 146, 593–606, doi:10.1016/j.cell.2011.06.049.
- Wombacher, R.; Cornish, V.W. Chemical Tags: Applications in Live Cell Fluorescence Imaging. J. Biophotonics 2011, 4, 391–402, doi:10.1002/jbio.201100018.
- Schneider, A.F.L.; Hackenberger, C.P.R. Fluorescent Labelling in Living Cells. Curr. Opin. Biotechnol. 2017, 48, 61–68, doi:10.1016/j.copbio.2017.03.012.
- Freidel, C.; Kaloyanova, S.; Peneva, K. Chemical Tags for Site-Specific Fluorescent Labeling of Biomolecules. Amino Acids 2016, 48, 1357–1372, doi:10.1007/s00726-016-2204-5.
- HaloTag® Technology: Novel New Applications Available online: https://ita.promega.com/resources/pubhub/2019/halotag-technology-novel-new-applications/ (accessed on 20 October 2022).
- Keppler, A.; Gendreizig, S.; Gronemeyer, T.; Pick, H.; Vogel, H.; Johnsson, K. A General Method for the Covalent Labeling of Fusion Proteins with Small Molecules in Vivo. Nat. Biotechnol. 2003, 21, 86–89, doi:10.1038/nbt765.
- Gautier, A.; Juillerat, A.; Heinis, C.; Corrêa, I.R.; Kindermann, M.; Beaufils, F.; Johnsson, K. An Engineered Protein Tag for Multiprotein Labeling in Living Cells. Chem. Biol. 2008, 15, doi:10.1016/j.chembiol.2008.01.007.
- Los, G. V.; Encell, L.P.; McDougall, M.G.; Hartzell, D.D.; Karassina, N.; Zimprich, C.; Wood, M.G.; Learish, R.; Ohana, R.F.; Urh, M.; et al. HaloTag: A Novel Protein Labeling Technology for Cell Imaging and Protein Analysis. ACS Chem. Biol. 2008, 3, doi:10.1021/cb800025k.
- Encell, L.P. Development of a Dehalogenase-Based Protein Fusion Tag Capable of Rapid, Selective and Covalent Attachment to Customizable Ligands. Curr. Chem. Genomics 2012, 6, 55–71, doi:10.2174/1875397301206010055.
- England, C.G.; Luo, H.; Cai, W. HaloTag Technology: A Versatile Platform for Biomedical Applications. Bioconjug. Chem. 2015, 26, 975–986, doi:10.1021/acs.bioconjchem.5b00191.
- Yin, J.; Straight, P.D.; McLoughlin, S.M.; Zhou, Z.; Lin, A.J.; Golan, D.E.; Kelleher, N.L.; Kolter, R.; Walsh, C.T. Genetically Encoded Short Peptide Tag for Versatile Protein Labeling by Sfp Phosphopantetheinyl Transferase. Proc. Natl. Acad. Sci. 2005, 102, doi:10.1073/pnas.0507705102.
- George, N.; Pick, H.; Vogel, H.; Johnsson, N.; Johnsson, K. Specific Labeling of Cell Surface Proteins with Chemically Diverse Compounds. J. Am. Chem. Soc. 2004, 126, 8896–8897, doi:10.1021/ja048396s.
- Cole, N.B. Site-Specific Protein Labeling with SNAP-Tags. Curr. Protoc. Protein Sci. 2013, 2013, 30.1.1-30.1.16, doi:10.1002/0471140864.ps3001s73.
- Maurel, D.; Comps-Agrar, L.; Brock, C.; Rives, M.-L.; Bourrier, E.; Ayoub, M.A.; Bazin, H.; Tinel, N.; Durroux, T.; Prézeau, L.; et al. Cell-Surface Protein-Protein Interaction Analysis with Time-Resolved FRET and Snap-Tag Technologies: Application to GPCR Oligomerization. Nat. Methods 2008, 5, doi:10.1038/nmeth.1213.
- Calebiro, D.; Rieken, F.; Wagner, J.; Sungkaworn, T.; Zabel, U.; Borzi, A.; Cocucci, E.; Zurn, A.; Lohse, M.J. Single-Molecule Analysis of Fluorescently Labeled G-Protein-Coupled Receptors Reveals Complexes with Distinct Dynamics and Organization. Proc. Natl. Acad. Sci. 2013, 110, doi:10.1073/pnas.1205798110.
- Grimm, J.B.; English, B.P.; Chen, J.; Slaughter, J.P.; Zhang, Z.; Revyakin, A.; Patel, R.; Macklin, J.J.; Normanno, D.; Singer, R.H.; et al. A General Method to Improve Fluorophores for Live-Cell and Single-Molecule Microscopy. Nat. Methods 2015, 12, 244–250, doi:10.1038/nmeth.3256.
- Grimm, J.B.; Brown, T.A.; English, B.P.; Lionnet, T.; Lavis, L.D. Synthesis of Janelia Fluor HaloTag and SNAP-Tag Ligands and Their Use in Cellular Imaging Experiments BT - Super-Resolution Microscopy: Methods and Protocols. Methods Mol. Biol. 2017, 1663, 179–188.
- Sungkaworn, T.; Jobin, M.-L.; Burnecki, K.; Weron, A.; Lohse, M.J.; Calebiro, D. Single-Molecule Imaging Reveals Receptor–G Protein Interactions at Cell Surface Hot Spots. Nature 2017, 550, doi:10.1038/nature24264.
- HaloTag® Technology: Focus on Imaging Protocol Available online: https://ita.promega.com/resources/protocols/technical-manuals/0/halotag-technology-focus-on-imaging-protocol/ (accessed on 16 October 2022).
- Mazza, D.; Ganguly, S.; McNally, J.G. Monitoring Dynamic Binding of Chromatin Proteins in Vivo by Single-Molecule Tracking. Methods Mol. Biol. 2013, 1042, 117–137, doi:10.1007/978-1-62703-526-2_9.
- Yin, J.; Liu, F.; Li, X.; Walsh, C.T. Labeling Proteins with Small Molecules by Site-Specific Posttranslational Modification. J. Am. Chem. Soc. 2004, 126, doi:10.1021/ja047749k.
- Yin, J.; Lin, A.J.; Buckett, P.D.; Wessling-Resnick, M.; Golan, D.E.; Walsh, C.T. Single-Cell FRET Imaging of Transferrin Receptor Trafficking Dynamics by Sfp-Catalyzed, Site-Specific Protein Labeling. Chem. Biol. 2005, 12, 999–1006, doi:10.1016/j.chembiol.2005.07.006.
- Marchetti, L.; De Nadai, T.; Bonsignore, F.; Calvello, M.; Signore, G.; Viegi, A.; Beltram, F.; Luin, S.; Cattaneo, A. Site-Specific Labeling of Neurotrophins and Their Receptors via Short and Versatile Peptide Tags. PLoS One 2014, 9, doi:10.1371/journal.pone.0113708.
- Zhou, Z.; Cironi, P.; Lin, A.J.; Xu, Y.; Hrvatin, S.; Golan, D.E.; Silver, P.A.; Walsh, C.T.; Yin, J. Genetically Encoded Short Peptide Tags for Orthogonal Protein Labeling by Sfp and AcpS Phosphopantetheinyl Transferases. ACS Chem. Biol. 2007, 2, doi:10.1021/cb700054k.
- Yin, J.; Lin, A.J.; Golan, D.E.; Walsh, C.T. Site-Specific Protein Labeling by Sfp Phosphopantetheinyl Transferase. Nat. Protoc. 2006, 1, doi:10.1038/nprot.2006.43.
- Gobbo, F.; Bonsignore, F.; Amodeo, R.; Cattaneo, A.; Marchetti, L. Site-Specific Direct Labeling of Neurotrophins and Their Receptors: From Biochemistry to Advanced Imaging Applications. In Methods in Molecular Biology; Humana Press Inc., 2018; Vol. 1727, pp. 295–314.
- Joo, C.; Ha, T. Single-Molecule FRET with Total Internal Reflection Microscopy. Cold Spring Harb. Protoc. 2012, 7, 1223–1237, doi:10.1101/pdb.top072058.
- Kim, J.Y.; Kim, C.; Lee, N.K. Real-Time Submillisecond Single-Molecule FRET Dynamics of Freely Diffusing Molecules with Liposome Tethering. Nat. Commun. 2015, 6, 1–9, doi:10.1038/ncomms7992.
- Mukherjee, S.K.; Knop, J.M.; Oliva, R.; Möbitz, S.; Winter, R. Untangling the Interaction of α-Synuclein with DNA i-Motifs and Hairpins by Volume-Sensitive Single-Molecule FRET Spectroscopy. RSC Chem. Biol. 2021, 2, 1196–1200, doi:10.1039/d1cb00108f.
- Brunger, A.T.; Strop, P.; Vrljic, M.; Chu, S.; Weninger, K.R. Three-Dimensional Molecular Modeling with Single Molecule FRET. J. Struct. Biol. 2011, 173, 497–505, doi:10.1016/j.jsb.2010.09.004.
- Singh, D.; Sielaff, H.; Börsch, M.; Grüber, G. Conformational Dynamics of the Rotary Subunit F in the A3B3DF Complex of Methanosarcina Mazei Gö1 A-ATP Synthase Monitored by Single-Molecule FRET. FEBS Lett. 2017, 591, 854–862, doi:10.1002/1873-3468.12605.
- König, I.; Zarrine-Afsar, A.; Aznauryan, M.; Soranno, A.; Wunderlich, B.; Dingfelder, F.; Stüber, J.C.; Plückthun, A.; Nettels, D.; Schuler, B. Single-Molecule Spectroscopy of Protein Conformational Dynamics in Live Eukaryotic Cells. Nat. Methods 2015, 12, 773–779, doi:10.1038/nmeth.3475.
- Vandenberk, N.; Barth, A.; Borrenberghs, D.; Hofkens, J.; Hendrix, J. Evaluation of Blue and Far-Red Dye Pairs in Single-Molecule Förster Resonance Energy Transfer Experiments. J. Phys. Chem. B 2018, 122, 4249–4266, doi:10.1021/acs.jpcb.8b00108.
- Förster-Radius R0 of Selected ATTO-Dye Pairs Available online: https://www.atto-tec.com/fileadmin/user_upload/Katalog_Flyer_Support/R_0_-Tabelle_2018_web.pdf (accessed on 17 October 2022).
- R0 Values for Some Alexa Fluor Dyes—Table 1.6 | Thermo Fisher Scientific - IT Available online: https://www.thermofisher.com/it/en/home/references/molecular-probes-the-handbook/tables/r0-values-for-some-alexa-fluor-dyes.html (accessed on 17 October 2022).
- Hohng, S.; Joo, C.; Ha, T. Single-Molecule Three-Color FRET. Biophys. J. 2004, 87, 1328–1337, doi:10.1529/biophysj.104.043935.
- Lee, S.; Lee, J.; Hohng, S. Single-Molecule Three-Color FRET with Both Negligible Spectral Overlap and Long Observation Time. PLoS One 2010, 5, e12270, doi:10.1371/journal.pone.0012270.
- Lee, J.; Lee, S.; Ragunathan, K.; Joo, C.; Ha, T.; Hohng, S. Single-Molecule Four-Color FRET. Angew. Chemie - Int. Ed. 2010, 49, 9922–9925, doi:10.1002/anie.201005402.
- Ratzke, C.; Hellenkamp, B.; Hugel, T. Four-Colour FRET Reveals Directionality in the Hsp90 Multicomponent Machinery. Nat. Commun. 2014, 5, 1–9, doi:10.1038/ncomms5192.
- Marchetti, L.; Bonsignore, F.; Gobbo, F.; Amodeo, R.; Calvello, M.; Jacob, A.; Signore, G.; Schirripa Spagnolo, C.; Porciani, D.; Mainardi, M.; et al. Fast-Diffusing P75 NTR Monomers Support Apoptosis and Growth Cone Collapse by Neurotrophin Ligands. Proc. Natl. Acad. Sci. 2019, 116, doi:10.1073/pnas.1902790116.
- Demchenko, A.P. Photobleaching of Organic Fluorophores: Quantitative Characterization, Mechanisms, Protection. Methods Appl. Fluoresc. 2020, 8.
- Samanta, S.; Gong, W.; Li, W.; Sharma, A.; Shim, I.; Zhang, W.; Das, P.; Pan, W.; Liu, L.; Yang, Z.; et al. Organic Fluorescent Probes for Stochastic Optical Reconstruction Microscopy (STORM): Recent Highlights and Future Possibilities. Coord. Chem. Rev. 2019, 380, 17–34, doi:10.1016/j.ccr.2018.08.006.
- Uno, S.N.; Kamiya, M.; Yoshihara, T.; Sugawara, K.; Okabe, K.; Tarhan, M.C.; Fujita, H.; Funatsu, T.; Okada, Y.; Tobita, S.; et al. A Spontaneously Blinking Fluorophore Based on Intramolecular Spirocyclization for Live-Cell Super-Resolution Imaging. Nat. Chem. 2014, 6, 681–689, doi:10.1038/nchem.2002.
- Uno, S.N.; Kamiya, M.; Morozumi, A.; Urano, Y. A Green-Light-Emitting, Spontaneously Blinking Fluorophore Based on Intramolecular Spirocyclization for Dual-Colour Super-Resolution Imaging. Chem. Commun. 2017, 54, 102–105, doi:10.1039/c7cc07783a.
- Morozumi, A.; Kamiya, M.; Uno, S.N.; Umezawa, K.; Kojima, R.; Yoshihara, T.; Tobita, S.; Urano, Y. Spontaneously Blinking Fluorophores Based on Nucleophilic Addition/Dissociation of Intracellular Glutathione for Live-Cell Super-Resolution Imaging. J. Am. Chem. Soc. 2020, 142, 9625–9633, doi:10.1021/jacs.0c00451.
- Sharonov, A.; Hochstrasser, R.M. Wide-Field Subdiffraction Imaging by Accumulated Binding of Diffusing Probes. Proc. Natl. Acad. Sci. U. S. A. 2006, 103, 18911–18916, doi:10.1073/pnas.0609643104.
- Tas, R.P.; Albertazzi, L.; Voets, I.K. Small Peptide-Protein Interaction Pair for Genetically Encoded, Fixation Compatible Peptide-PAINT. Nano Lett. 2021, 21, 9509–9516, doi:10.1021/acs.nanolett.1c02895.
- van Wee, R.; Filius, M.; Joo, C. Completing the Canvas: Advances and Challenges for DNA-PAINT Super-Resolution Imaging. Trends Biochem. Sci. 2021, 46, 918–930.
- Nieves, D.J.; Gaus, K.; Baker, M.A.B. DNA-Based Super-Resolution Microscopy: DNA-PAINT. Genes (Basel). 2018, 9.
- Schnitzbauer, J.; Strauss, M.T.; Schlichthaerle, T.; Schueder, F.; Jungmann, R. Super-Resolution Microscopy with DNA-PAINT. Nat. Protoc. 2017, 12, 1198–1228, doi:10.1038/nprot.2017.024.
- Resch-Genger, U.; Grabolle, M.; Cavaliere-Jaricot, S.; Nitschke, R.; Nann, T. Quantum Dots versus Organic Dyes as Fluorescent Labels. Nat. Methods 2008, 5, 763–775, doi:10.1038/nmeth.1248.
- Bannai, H.; Lévi, S.; Schweizer, C.; Dahan, M.; Triller, A. Imaging the Lateral Diffusion of Membrane Molecules with Quantum Dots. Nat. Protoc. 2007, 1, 2628–2634, doi:10.1038/nprot.2006.429.
- Bannai, H. Molecular Membrane Dynamics: Insights into Synaptic Function and Neuropathological Disease. Neurosci. Res. 2018, 129, 47–56.
- De Nadai, T.; Marchetti, L.; Di Rienzo, C.; Calvello, M.; Signore, G.; Di Matteo, P.; Gobbo, F.; Turturro, S.; Meucci, S.; Viegi, A.; et al. Precursor and Mature NGF Live Tracking: One versus Many at a Time in the Axons. Sci. Rep. 2016, 6, doi:10.1038/srep20272.
- Amodeo, R.; Nifosì, R.; Giacomelli, C.; Ravelli, C.; La Rosa, L.; Callegari, A.; Trincavelli, M.L.; Mitola, S.; Luin, S.; Marchetti, L. Molecular Insight on the Altered Membrane Trafficking of TrkA Kinase Dead Mutants. Biochim. Biophys. Acta - Mol. Cell Res. 2020, 1867, doi:10.1016/j.bbamcr.2019.118614.
- Opazo, P.; Labrecque, S.; Tigaret, C.M.; Frouin, A.; Wiseman, P.W.; De Koninck, P.; Choquet, D. CaMKII Triggers the Diffusional Trapping of Surface AMPARs through Phosphorylation of Stargazin. Neuron 2010, 67, 239–252, doi:10.1016/j.neuron.2010.06.007.
- Gómez-Varela, D.; Kohl, T.; Schmidt, M.; Rubio, M.E.; Kawabe, H.; Nehring, R.B.; Schäfer, S.; Stühmer, W.; Pardo, L.A. Characterization of Eag1 Channel Lateral Mobility in Rat Hippocampal Cultures by Single-Particle-Tracking with Quantum Dots. PLoS One 2010, 5, e8858, doi:10.1371/journal.pone.0008858.
- Won, S.; Kim, H.D.; Kim, J.Y.; Lee, B.C.; Chang, S.; Park, C.S. Movements of Individual BKCa Channels in Live Cell Membrane Monitored by Site-Specific Labeling Using Quantum Dots. Biophys. J. 2010, 99, 2853–2862, doi:10.1016/j.bpj.2010.08.049.
- Chang, J.C.; Rosenthal, S.J. Visualization of Lipid Raft Membrane Compartmentalization in Living RN46A Neuronal Cells Using Single Quantum Dot Tracking. ACS Chem. Neurosci. 2012, 3, 737–743, doi:10.1021/cn3000845.
- Murcia, M.J.; Minner, D.E.; Mustata, G.M.; Ritchie, K.; Naumann, C.A. Design of Quantum Dot-Conjugated Lipids for Long-Term, High-Speed Tracking Experiments on Cell Surfaces. J. Am. Chem. Soc. 2008, 130, 15054–15062, doi:10.1021/ja803325b.
- Delehanty, J.B.; Mattoussi, H.; Medintz, I.L. Delivering Quantum Dots into Cells: Strategies, Progress and Remaining Issues. Anal. Bioanal. Chem. 2009, 393, 1091–1105.
- Muro, E.; Fragola, A.; Pons, T.; Lequeux, N.; Ioannou, A.; Skourides, P.; Dubertret, B. Comparing Intracellular Stability and Targeting of Sulfobetaine Quantum Dots with Other Surface Chemistries in Live Cells. Small 2012, 8, 1029–1037, doi:10.1002/smll.201101787.
- Efros, A.L.; Nesbitt, D.J. Origin and Control of Blinking in Quantum Dots. Nat. Nanotechnol. 2016, 11, 661–671.
- Mahler, B.; Spinicelli, P.; Buil, S.; Quelin, X.; Hermier, J.P.; Dubertret, B. Towards Non-Blinking Colloidal Quantum Dots. Nat. Mater. 2008, 7, 659–664, doi:10.1038/nmat2222.
- Lane, L.A.; Smith, A.M.; Lian, T.; Nie, S. Compact and Blinking-Suppressed Quantum Dots for Single-Particle Tracking in Live Cells. J. Phys. Chem. B 2014, 118, 14140–14147, doi:10.1021/jp5064325.
- Jaqaman, K.; Loerke, D.; Mettlen, M.; Kuwata, H.; Grinstein, S.; Schmid, S.L.; Danuser, G. Robust Single-Particle Tracking in Live-Cell Time-Lapse Sequences. Nat. Methods 2008, 5, 695–702, doi:10.1038/nmeth.1237.
- Sergé, A.; Bertaux, N.; Rigneault, H.; Marguet, D. Dynamic Multiple-Target Tracing to Probe Spatiotemporal Cartography of Cell Membranes. Nat. Methods 2008, 5, 687–694, doi:10.1038/nmeth.1233.
- Low-Nam, S.T.; Lidke, K.A.; Cutler, P.J.; Roovers, R.C.; Van Bergen En Henegouwen, P.M.P.; Wilson, B.S.; Lidke, D.S. ErbB1 Dimerization Is Promoted by Domain Co-Confinement and Stabilized by Ligand Binding. Nat. Struct. Mol. Biol. 2011, 18, 1244–1249, doi:10.1038/nsmb.2135.
- Arnspang, E.C.; Brewer, J.R.; Lagerholm, B.C. Multi-Color Single Particle Tracking with Quantum Dots. PLoS One 2012, 7, doi:10.1371/journal.pone.0048521.
- You, C.; Marquez-Lago, T.T.; Richter, C.P.; Wilmes, S.; Moraga, I.; Garcia, K.C.; Leier, A.; Piehler, J. Receptor Dimer Stabilization by Hierarchical Plasma Membrane Microcompartments Regulates Cytokine Signaling. Sci. Adv. 2016, 2, doi:10.1126/sciadv.1600452.
- Ito, Y.; Sakata-Sogawa, K.; Tokunaga, M. Multi-Color Single-Molecule Tracking and Subtrajectory Analysis for Quantification of Spatiotemporal Dynamics and Kinetics upon T Cell Activation. Sci. Rep. 2017, 7, 1–14, doi:10.1038/s41598-017-06960-z.
- Clausen, M.P.; Arnspang, E.C.; Ballou, B.; Bear, J.E.; Lagerholm, B.C. Simultaneous Multi-Species Tracking in Live Cells with Quantum Dot Conjugates. PLoS One 2014, 9, e97671, doi:10.1371/journal.pone.0097671.
- Abraham, L.; Lu, H.Y.; Falcão, R.C.; Scurll, J.; Jou, T.; Irwin, B.; Tafteh, R.; Gold, M.R.; Coombs, D. Limitations of Qdot Labelling Compared to Directly-Conjugated Probes for Single Particle Tracking of B Cell Receptor Mobility. Sci. Rep. 2017, 7, 1–13, doi:10.1038/s41598-017-11563-9.
- Cui, B.; Wu, C.; Chen, L.; Ramirez, A.; Bearer, E.L.; Li, W.P.; Mobley, W.C.; Chu, S. One at a Time, Live Tracking of NGF Axonal Transport Using Quantum Dots. Proc. Natl. Acad. Sci. U. S. A. 2007, 104, 13666–13671, doi:10.1073/pnas.0706192104.
- Arai, Y.; Nagai, T. Extensive Use of FRET in Biological Imaging. J. Electron Microsc. (Tokyo). 2013, 62, 419–428, doi:10.1093/jmicro/dft037.
- Algar, W.R.; Hildebrandt, N.; Vogel, S.S.; Medintz, I.L. FRET as a Biomolecular Research Tool — Understanding Its Potential While Avoiding Pitfalls. Nat. Methods 2019, 16, 815–829, doi:10.1038/s41592-019-0530-8.
- Cardoso Dos Santos, M.; Algar, W.R.; Medintz, I.L.; Hildebrandt, N. Quantum Dots for Förster Resonance Energy Transfer (FRET). TrAC - Trends Anal. Chem. 2020, 125, 115819, doi:10.1016/j.trac.2020.115819.
- Snee, P.T. Semiconductor Quantum Dot FRET: Untangling Energy Transfer Mechanisms in Bioanalytical Assays. TrAC - Trends Anal. Chem. 2020, 123, 115750, doi:10.1016/j.trac.2019.115750.
- Allen, J.R.; Ross, S.T.; Davidson, M.W. Single Molecule Localization Microscopy for Superresolution. J. Opt. (United Kingdom) 2013, 15, doi:10.1088/2040-8978/15/9/094001.
- Yang, X.; Zhanghao, K.; Wang, H.; Liu, Y.; Wang, F.; Zhang, X.; Shi, K.; Gao, J.; Jin, D.; Xi, P. Versatile Application of Fluorescent Quantum Dot Labels in Super-Resolution Fluorescence Microscopy. ACS Photonics 2016, 3, 1611–1618, doi:10.1021/acsphotonics.6b00178.
- Jin, D.; Xi, P.; Wang, B.; Zhang, L.; Enderlein, J.; Van Oijen, A.M. Nanoparticles for Super-Resolution Microscopy and Single-Molecule Tracking. Nat. Methods 2018, 15, 415–423.
- Lee, J.; Lee, H.; Kang, M.; Baday, M.; Lee, S.H. High Spatial and Temporal Resolution Using Upconversion Nanoparticles and Femtosecond Pulsed Laser in Single Particle Tracking. Curr. Appl. Phys. 2022, 44, 40–45, doi:10.1016/j.cap.2022.09.002.

