The virtual collection of DPVS data is a new field that few scholars have studied. Therefore, in this section, to facilitate understanding, researchers compare and analyze the similarities and differences between the steps of virtual collection and other methods. Focusing on their similarities, researchers give directions for DPVS virtual collection research, and then focusing on their differences, they summarize the challenges faced by DPVS virtual collection. It is worth noting that this approach to elaboration is novel for the review literature and can help the reader understand the connections and differences clearly between virtual collection and other studies.
PV data is most closely correlated with external conditions, and factors such as the geographic location of the installation site. Environmental factors have a significant impact on the accuracy of the virtual collection model. Therefore, one of the prerequisites assumed for the realization of virtual collection is that the station to be collected and the RPS have similar external factors. From the data point of view, researchers want the data set to obey similar distribution patterns as much as possible, thus providing higher-quality input data for supervised learning. This similarity can make the virtual collection more robust and ensure the virtual collection data’s accuracy even in weather changes.
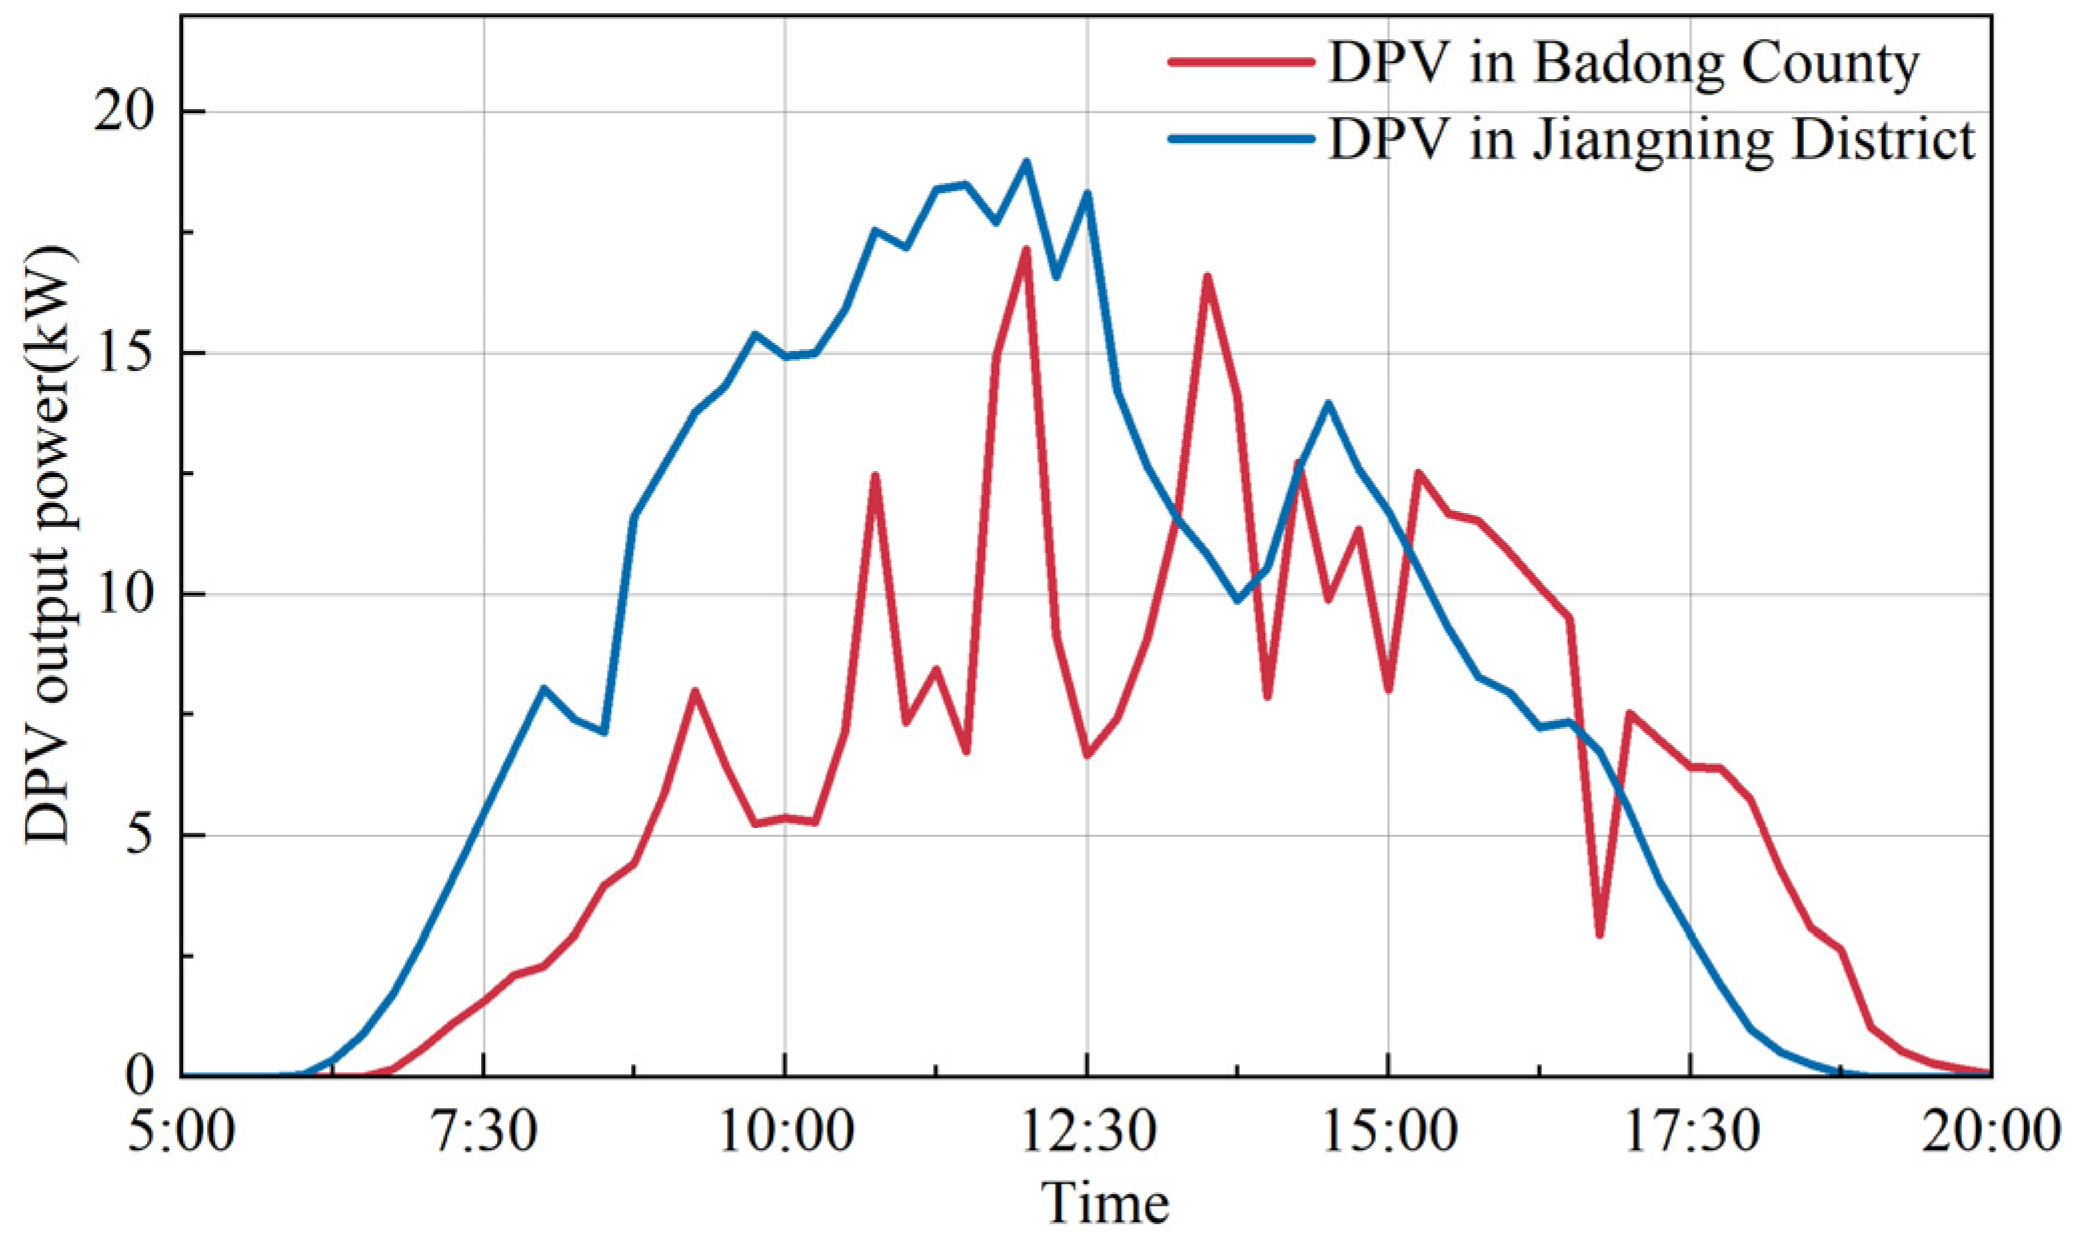
To illustrate, Badong County in southwestern Hubei Province, China, and Jiangning District in Nanjing City, Jiangsu Province, produce widely different power data due to different terrain, topography, meteorology and other conditions. Figure 4 shows the power output of PV stations in Badong County and Jiangning District on a typical summer day. For the DPVS of Jiangning district, using the DPVS operation data of Badong district for data inference would seriously reduce the accuracy of the virtual collection because of the extremely low similarity between them. Therefore, it is necessary to define clusters of PV stations that satisfy the similarity requirement by similarity analysis in advance.
Many factors affecting the PV output state are coupled with each other
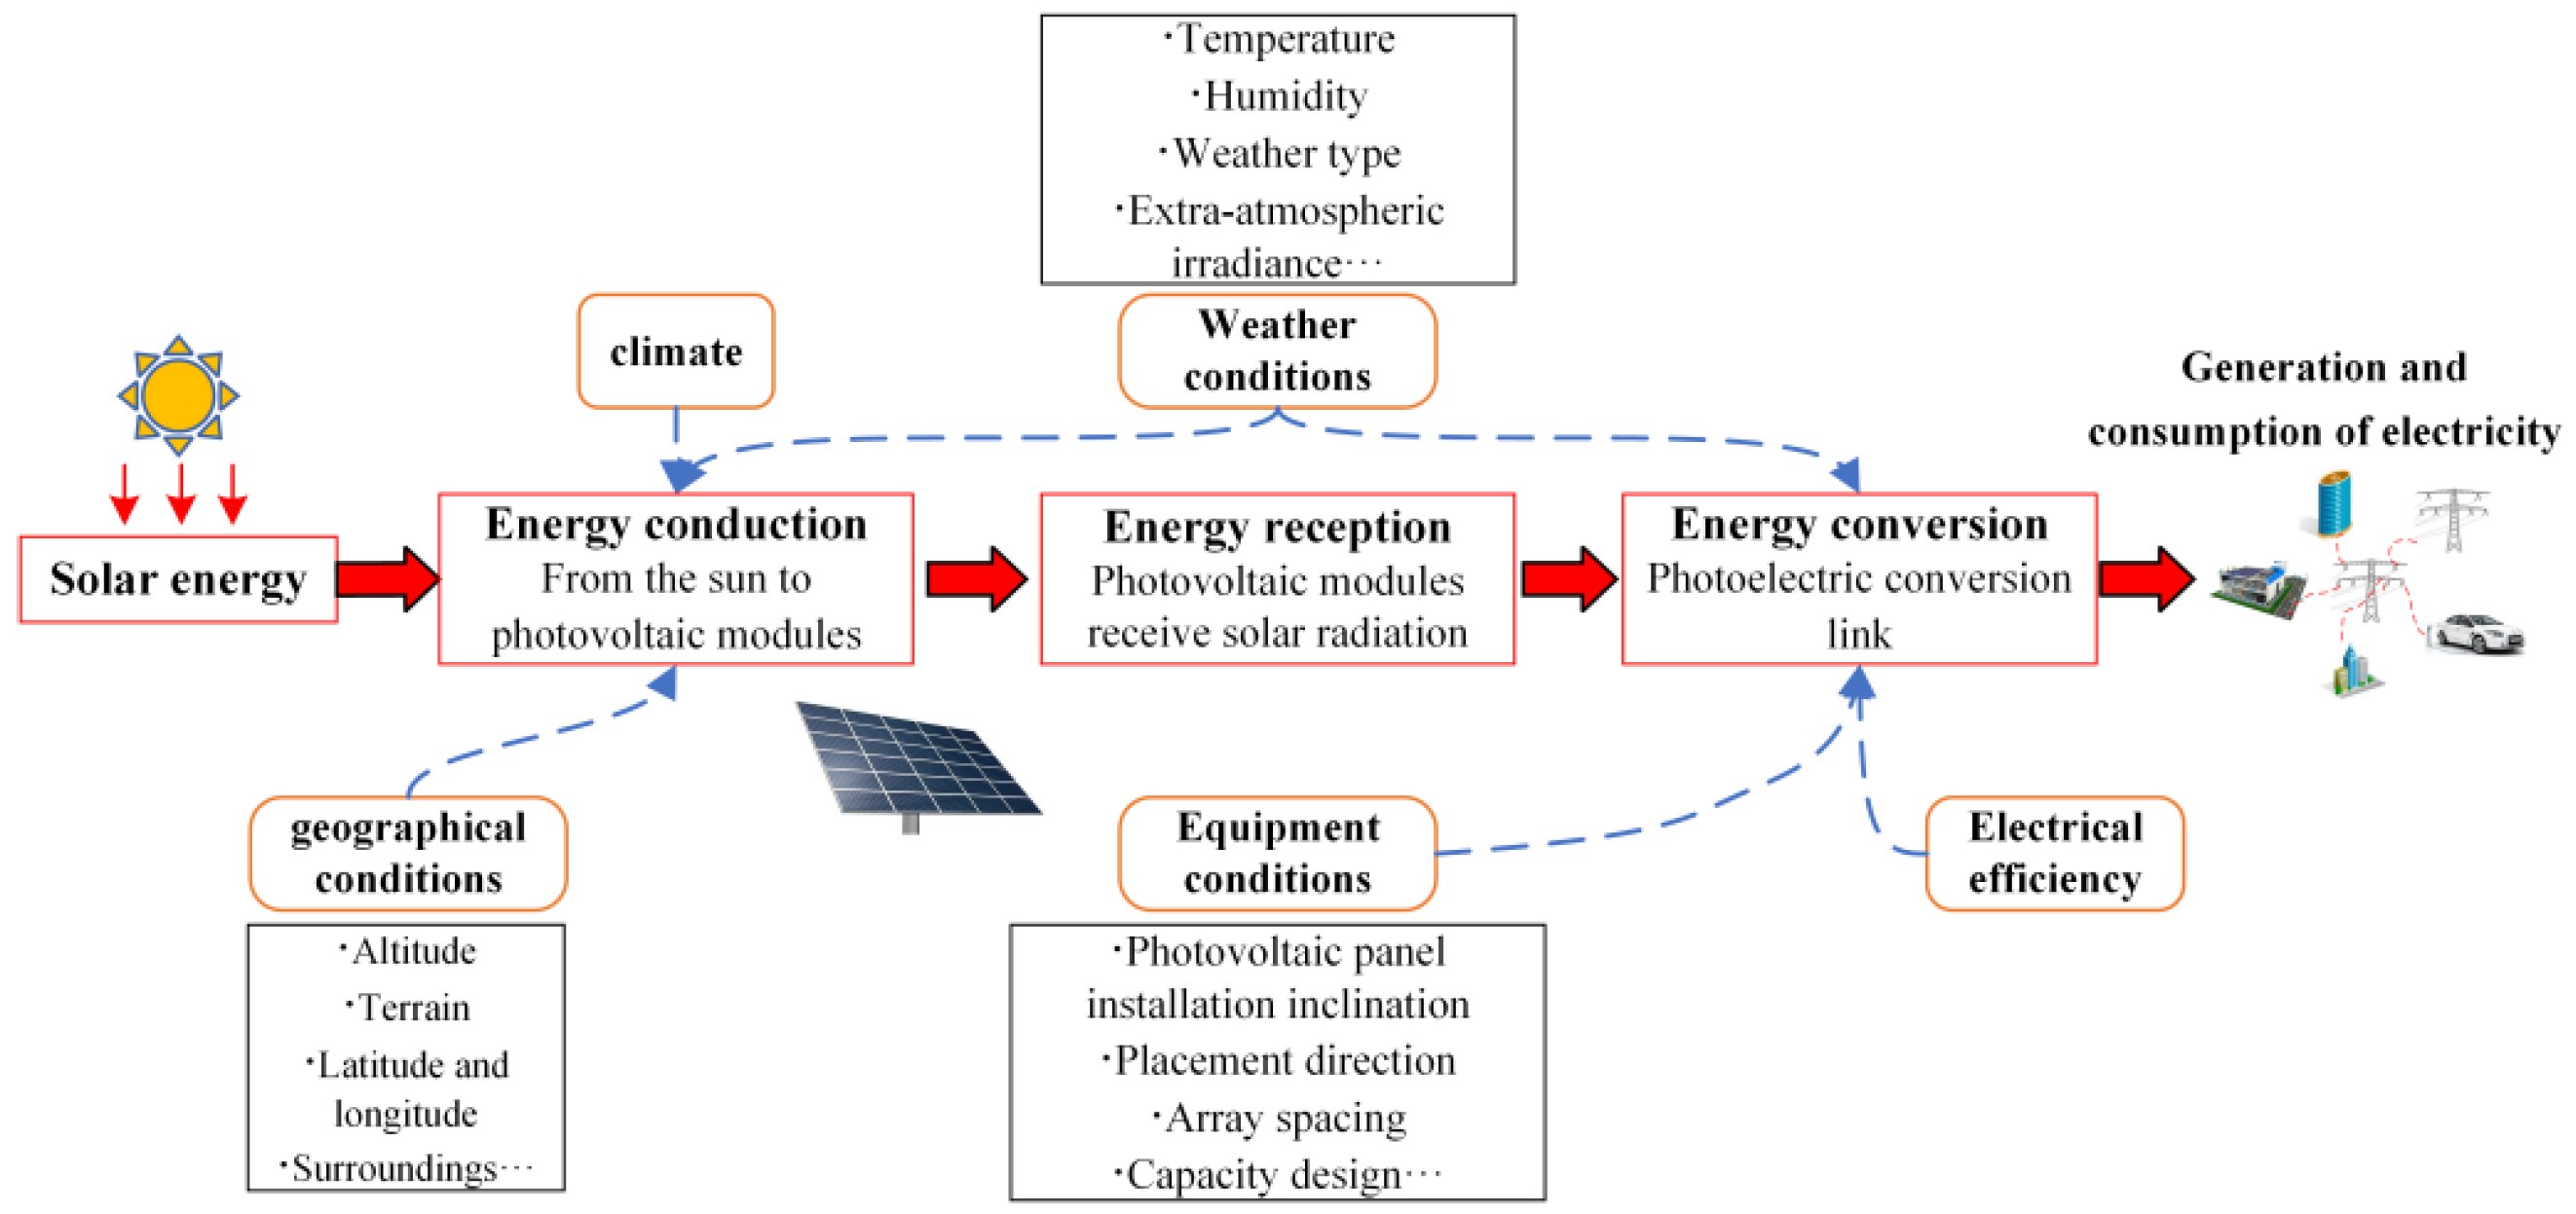
[6]. The main factors influencing the solar energy conversion process are shown in
Figure 5. It can be seen that the degree of solar irradiance received by the PV module is significantly influenced by the geographical location and meteorological conditions. The climate is the comprehensive pattern in the general state of the atmosphere and weather processes in a certain area on a long timescale, which is an important factor affecting the level of light resources, and meteorology refers to the physical phenomena of the atmosphere on a short time scale, such as temperature, clouds, etc. Secondly, the link of solar irradiance to power for conversion is closely related to the selection of equipment, the design of the station, and electrical efficiency. After the series of the energy conversion process mentioned above, the final PV power output is obtained. Therefore, similarity analysis can be performed from two perspectives: influencing factors (causes) and power output trends (results). However, from the perspective of influencing factors, it is difficult to analyze the similarity due to the large number of factors affecting PV output, the significant difference between the dimensions, and the complex types of characteristics. From the perspective of the PV output trend, the trend changes are complicated, and the time scale is long, which makes it challenging to analyze the trend characteristics.
Figure 5. Factors affecting DPVS power output.
The importance of data similarity is also reflected in many areas of research. In Ref.
[7], an anomaly identification and reconstruction model based on curve similarity analysis with a BP neural network is proposed for detecting anomalous and compensating missing PV historical data. Similar to the virtual collection, the method also requires the power of neighboring PV stations. Considering the periodicity of PV power, Ref.
[8] proposes a data cleaning method based on approximate periodic time series, effectively improving the quality of PV data. Considering the uncertainty of PV power generation due to the variation in weather conditions, Ref.
[9] proposes a prediction framework combining similar day selection techniques. In this framework, the authors first screen external variables that can accurately capture the similarity between different days and select dates with higher similarity based on these external variables for the historical day and the day to be predicted, thus improving the prediction accuracy. Although the research methods of the above studies are different, they all desire to obtain higher-quality data.
3.2. RPS Selection for Virtual Collection
Selecting the RPSs is the most crucial step in the virtual collection process. The RPSs’ real-time power data will be input into the computational intelligence algorithm as multidimensional features to estimate the output of all regional DPVS. Researchers aim to select the subset of DPVS among the regional DPVS that can estimate the data of other stations with higher accuracy. The key to this step is to identify selective sensor locations where the most important data is collected to monitor the status of all DPVS. Therefore, researchers will analyze the differences and associations between the RPS selection step and other methods from the perspectives of input data and equipment placement.
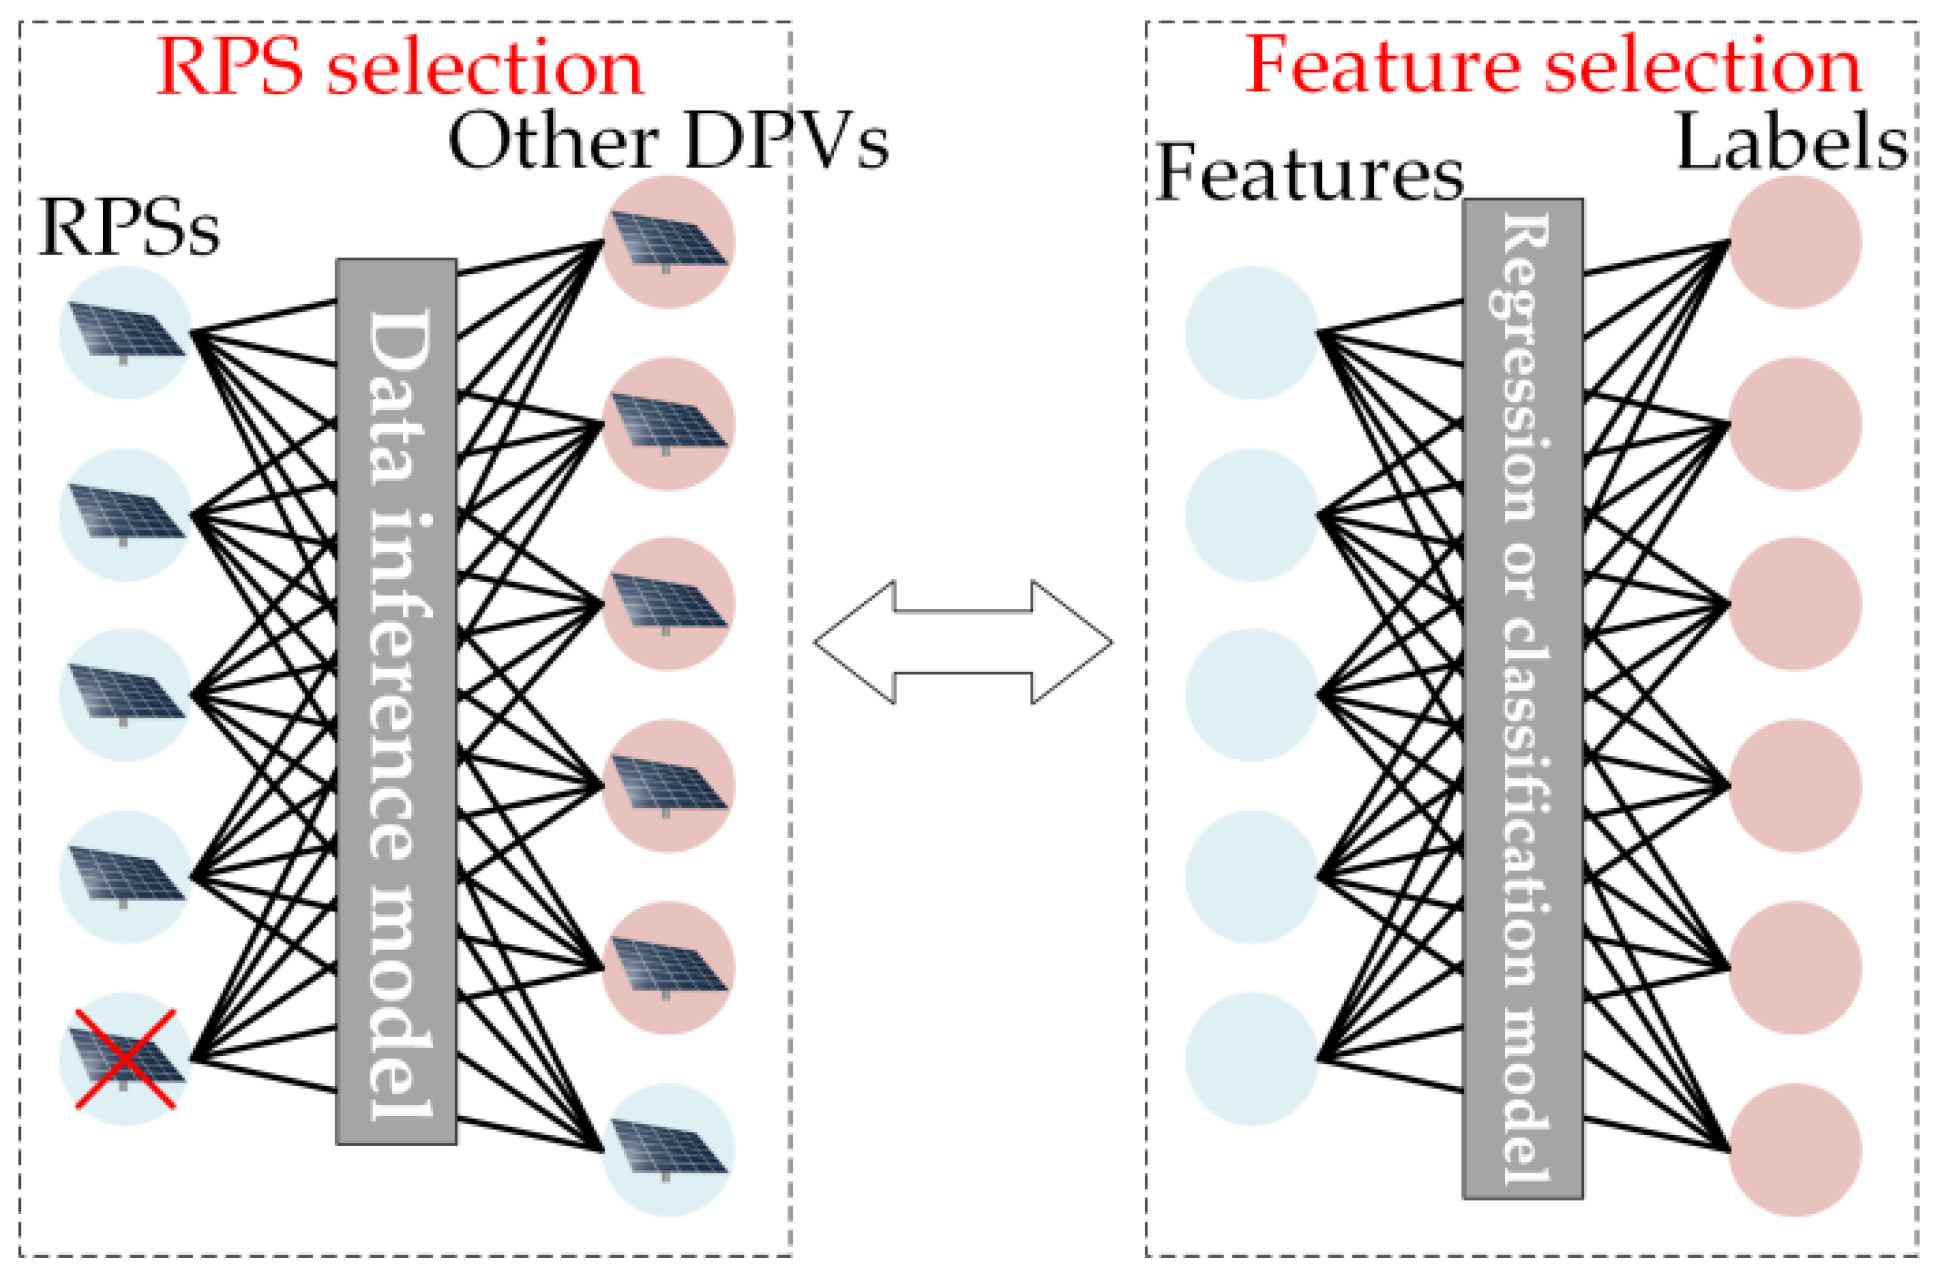
As shown in
Figure 6, from the perspective of input data, the selection of RPSs can be approximated as the feature selection problem of machine learning. Both aim to improve the accuracy of the results as much as possible by selecting RPSs (features). Therefore, although there are few studies on the selection of reference power stations, the relatively mature feature selection theory can also provide researchers with inspiration. For data mining techniques, the feature quality of input data seriously affects the model’s performance, so many scholars have researched the feature selection problem. Ref.
[10] systematically examined the existing sparse learning models for feature selection from the perspective of individual sparse feature selection and group sparse feature selection. It analyzed the differences and connections among various sparse learning models. Ref.
[11] proposes a new incremental feature selection that makes the method robust to dynamically ordered data. Ref.
[12] proposes a grasshopper optimization algorithm that can solve the binary optimization problem by selecting a subset of features that can better characterize the data attributes from a large set of original features, thus improving the classification accuracy. The above studies proposed effective processing for the feature selection problem, which can provide some theoretical reference for selecting RPSs, such as transforming the RPS selection into a combinatorial optimization problem. However, it is worth noting that if a power station is selected as the RPS, it is used as the input feature, and the remaining power stations are used as the power stations to be collected. It can be seen that the RPS selection problem for virtual collection is similar to the high-dimensional feature selection problem
[13] yet different from the feature selection in the traditional regression and classification
[14] problems. Therefore, choosing reasonable RPSs is more challenging than feature selection.
Figure 6. RPS selection and feature selection process.
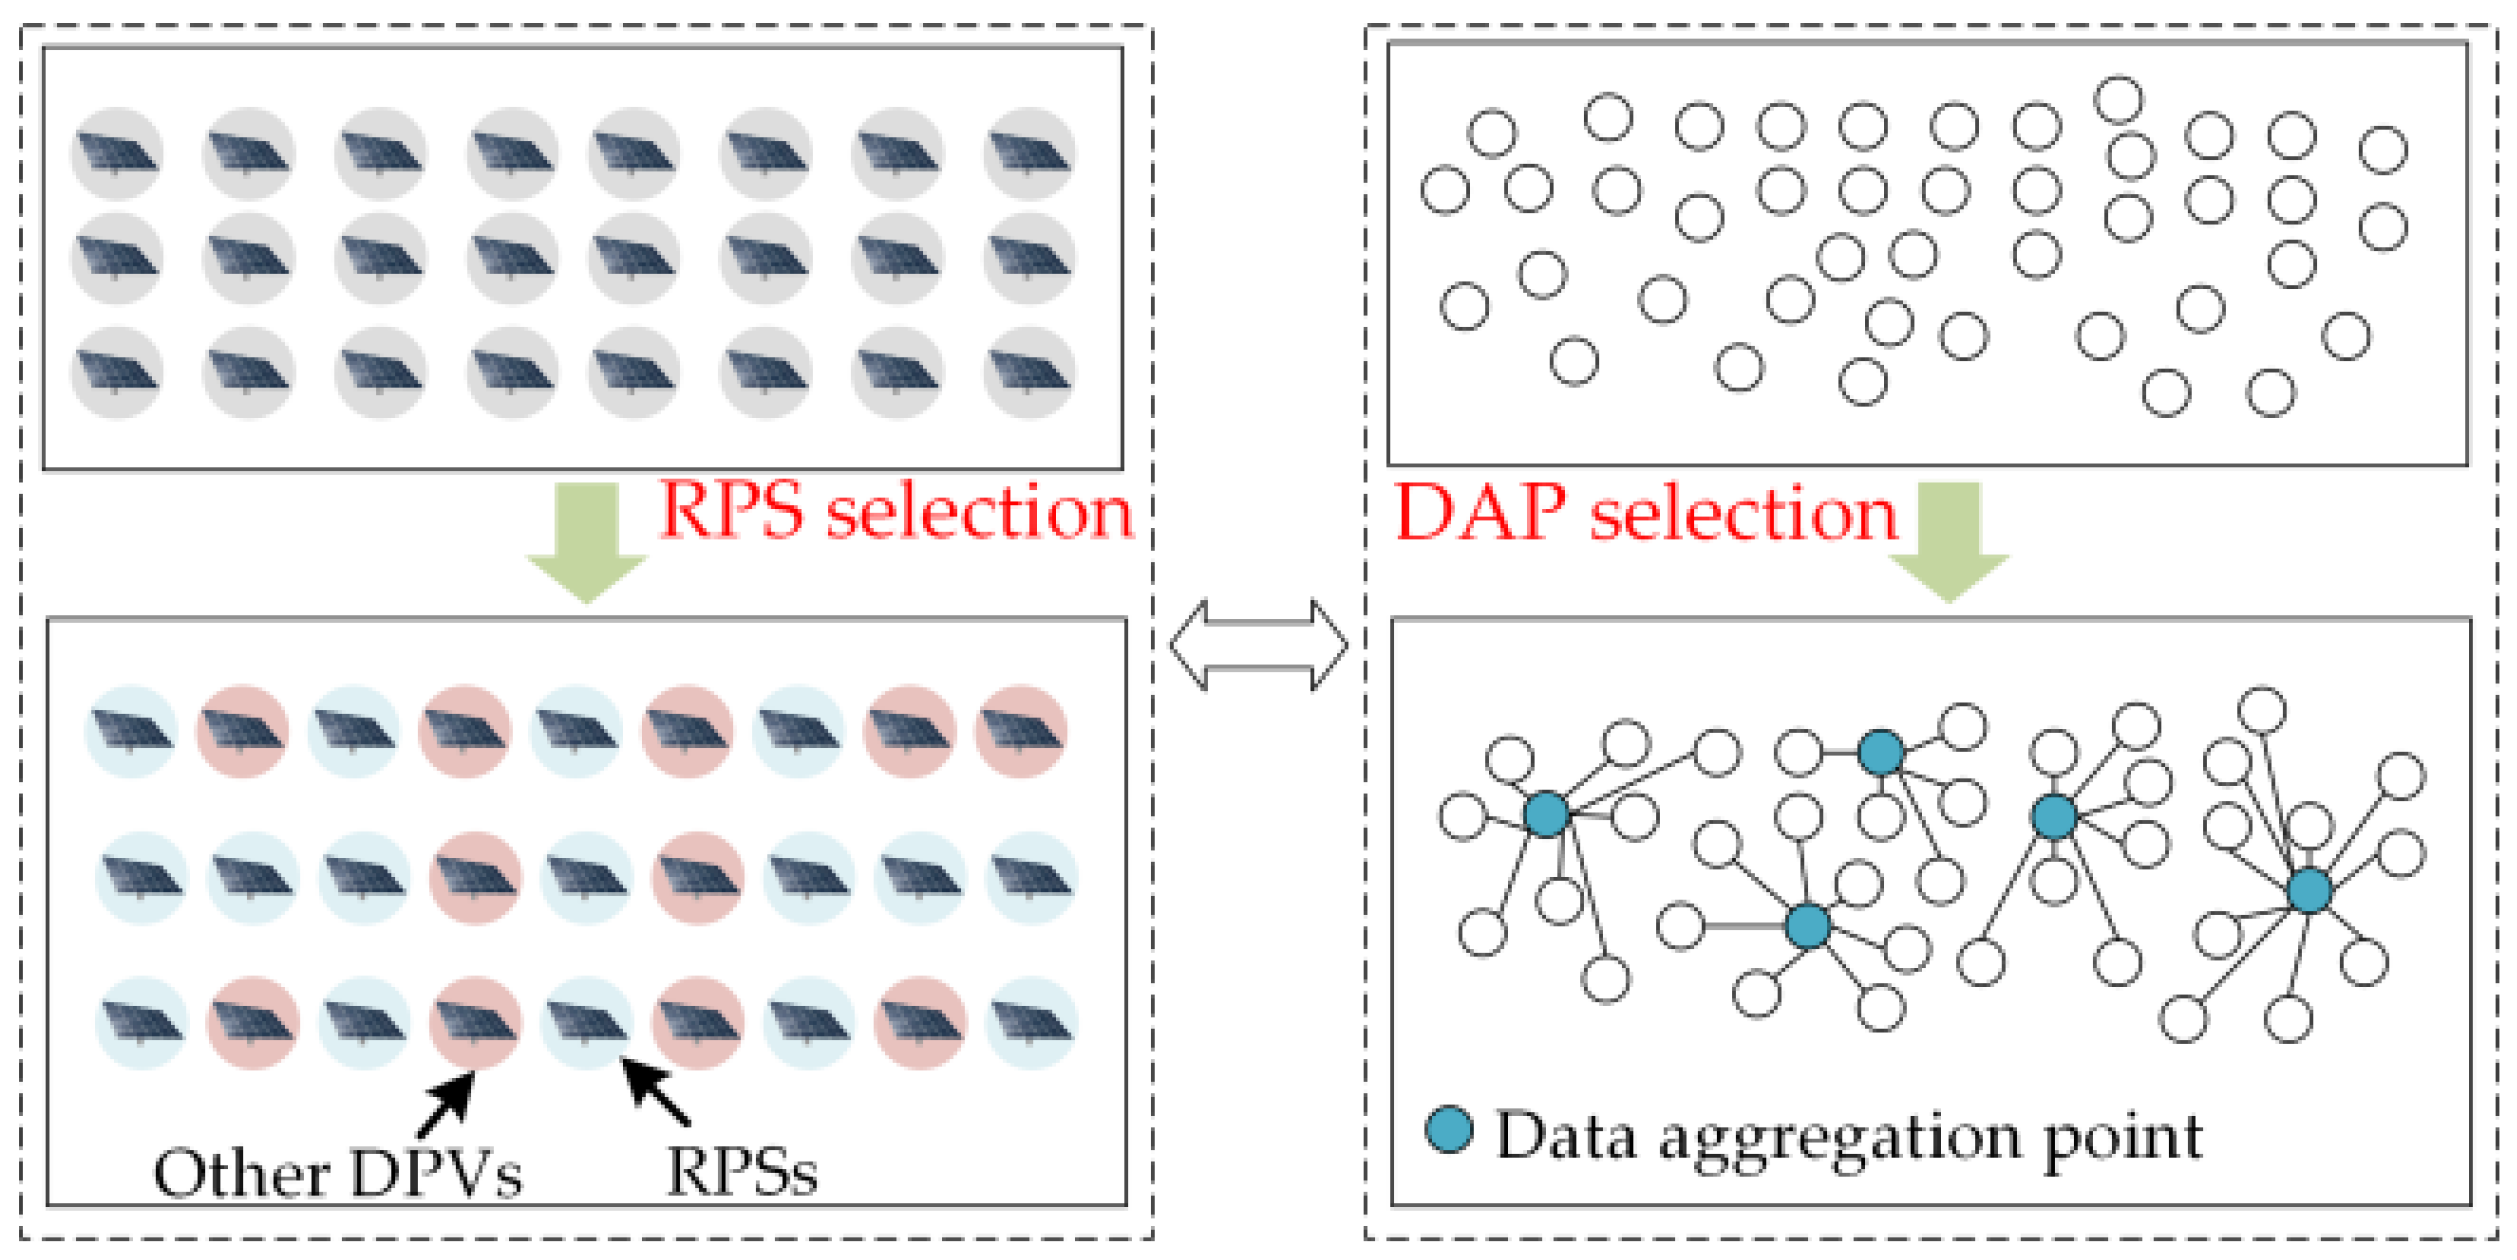
From a sensor placement perspective, the selection of RPSs can also be inspired by the data aggregation point (DAP) selection problem in smart meters. As shown in
Figure 7, both DAP selection and RPS selection can be regarded as the optimal configuration of transmission nodes in the system. DAPs are selected to reduce data redundancy and bandwidth requirements by aggregating data locally at the sensor or intermediate nodes to form high-quality information and reduce the quality of packets sent to the base station, thus saving energy and bandwidth. Ref.
[15] treats DAP placement as a mixed integer programming problem and proposes a new heuristic algorithm to minimize installation, transmission, and delay costs to select the optimal DAP placement location. Ref.
[16] proposes an improved k-means clustering algorithm to assign DAPs, significantly reducing the number of DAPs installed.
Figure 7. RPS selection and DAP selection process.
Although there are certain commonalities between the selection of DAPs and RPSs, there are still many challenges that need to be studied. Data aggregation points are obtained with the objective of determining the lowest transmission and delay cost among all SM layout points to achieve aggregation and transmission of data for the whole system. The RPS is selected by selecting a subset of PVs among the regional PV systems to achieve a data estimation of the whole system. Therefore, the elements considered in the selection of RPSs are more diversified. In addition to communication and equipment costs, the accuracy of data estimation for the whole system from different RPS sets needs to be considered, as well as the time and space coupling characteristics.
3.3. Data Inference for Regional DPVS
The final step of the virtual collection technique is to infer the operational data of the whole DPVS through an artificial intelligence algorithm. This step maps the relationship between the RPS and the whole system by building a computational intelligence model between the RPSs and the power stations to be collected in the region, using the data from the RPSs selected in the second step as the input. This step is similar to the method used in PV prediction techniques, both of which require certain historical data as a driver to obtain the unknown PV output power.
There is relatively little research in the industry on DPVS virtual data inference, with most studies focusing only on PV power prediction, using historical data, real-time weather, and other environmental information to predict PV power output. Thankfully, the current DPVS power prediction algorithms are relatively mature and can provide some theoretical references for virtual DPVS data collection. However, it is worth noting that data inference in virtual collection differs from traditional PV prediction in model construction and use. Virtual data collection estimates the current PV power output in real time through a data inference model, whereas the PV predictor estimates the future power output. The input to the virtual collection model is real-time PV data from the RPSs, and the input to the PV predictor is historical operational data and environmental information. This real-time nature makes it necessary that the data inference model for virtual collection has better robustness and higher accuracy requirements than that for PV prediction.
4. Methods for DPVS Virtual Collection
The previous section introduces the specific implementation steps of virtual collection and its purpose, and pinpoints the urgent need to provide solutions to the challenges faced by the above steps. Therefore, this section provides theoretical support for the development of virtual collection technology by summarizing the methods applicable to DPVS similarity analysis, RPS selection, and DPVS data inference in various fields. Various methods for DPVS virtual collection are summarized in Figure 8.
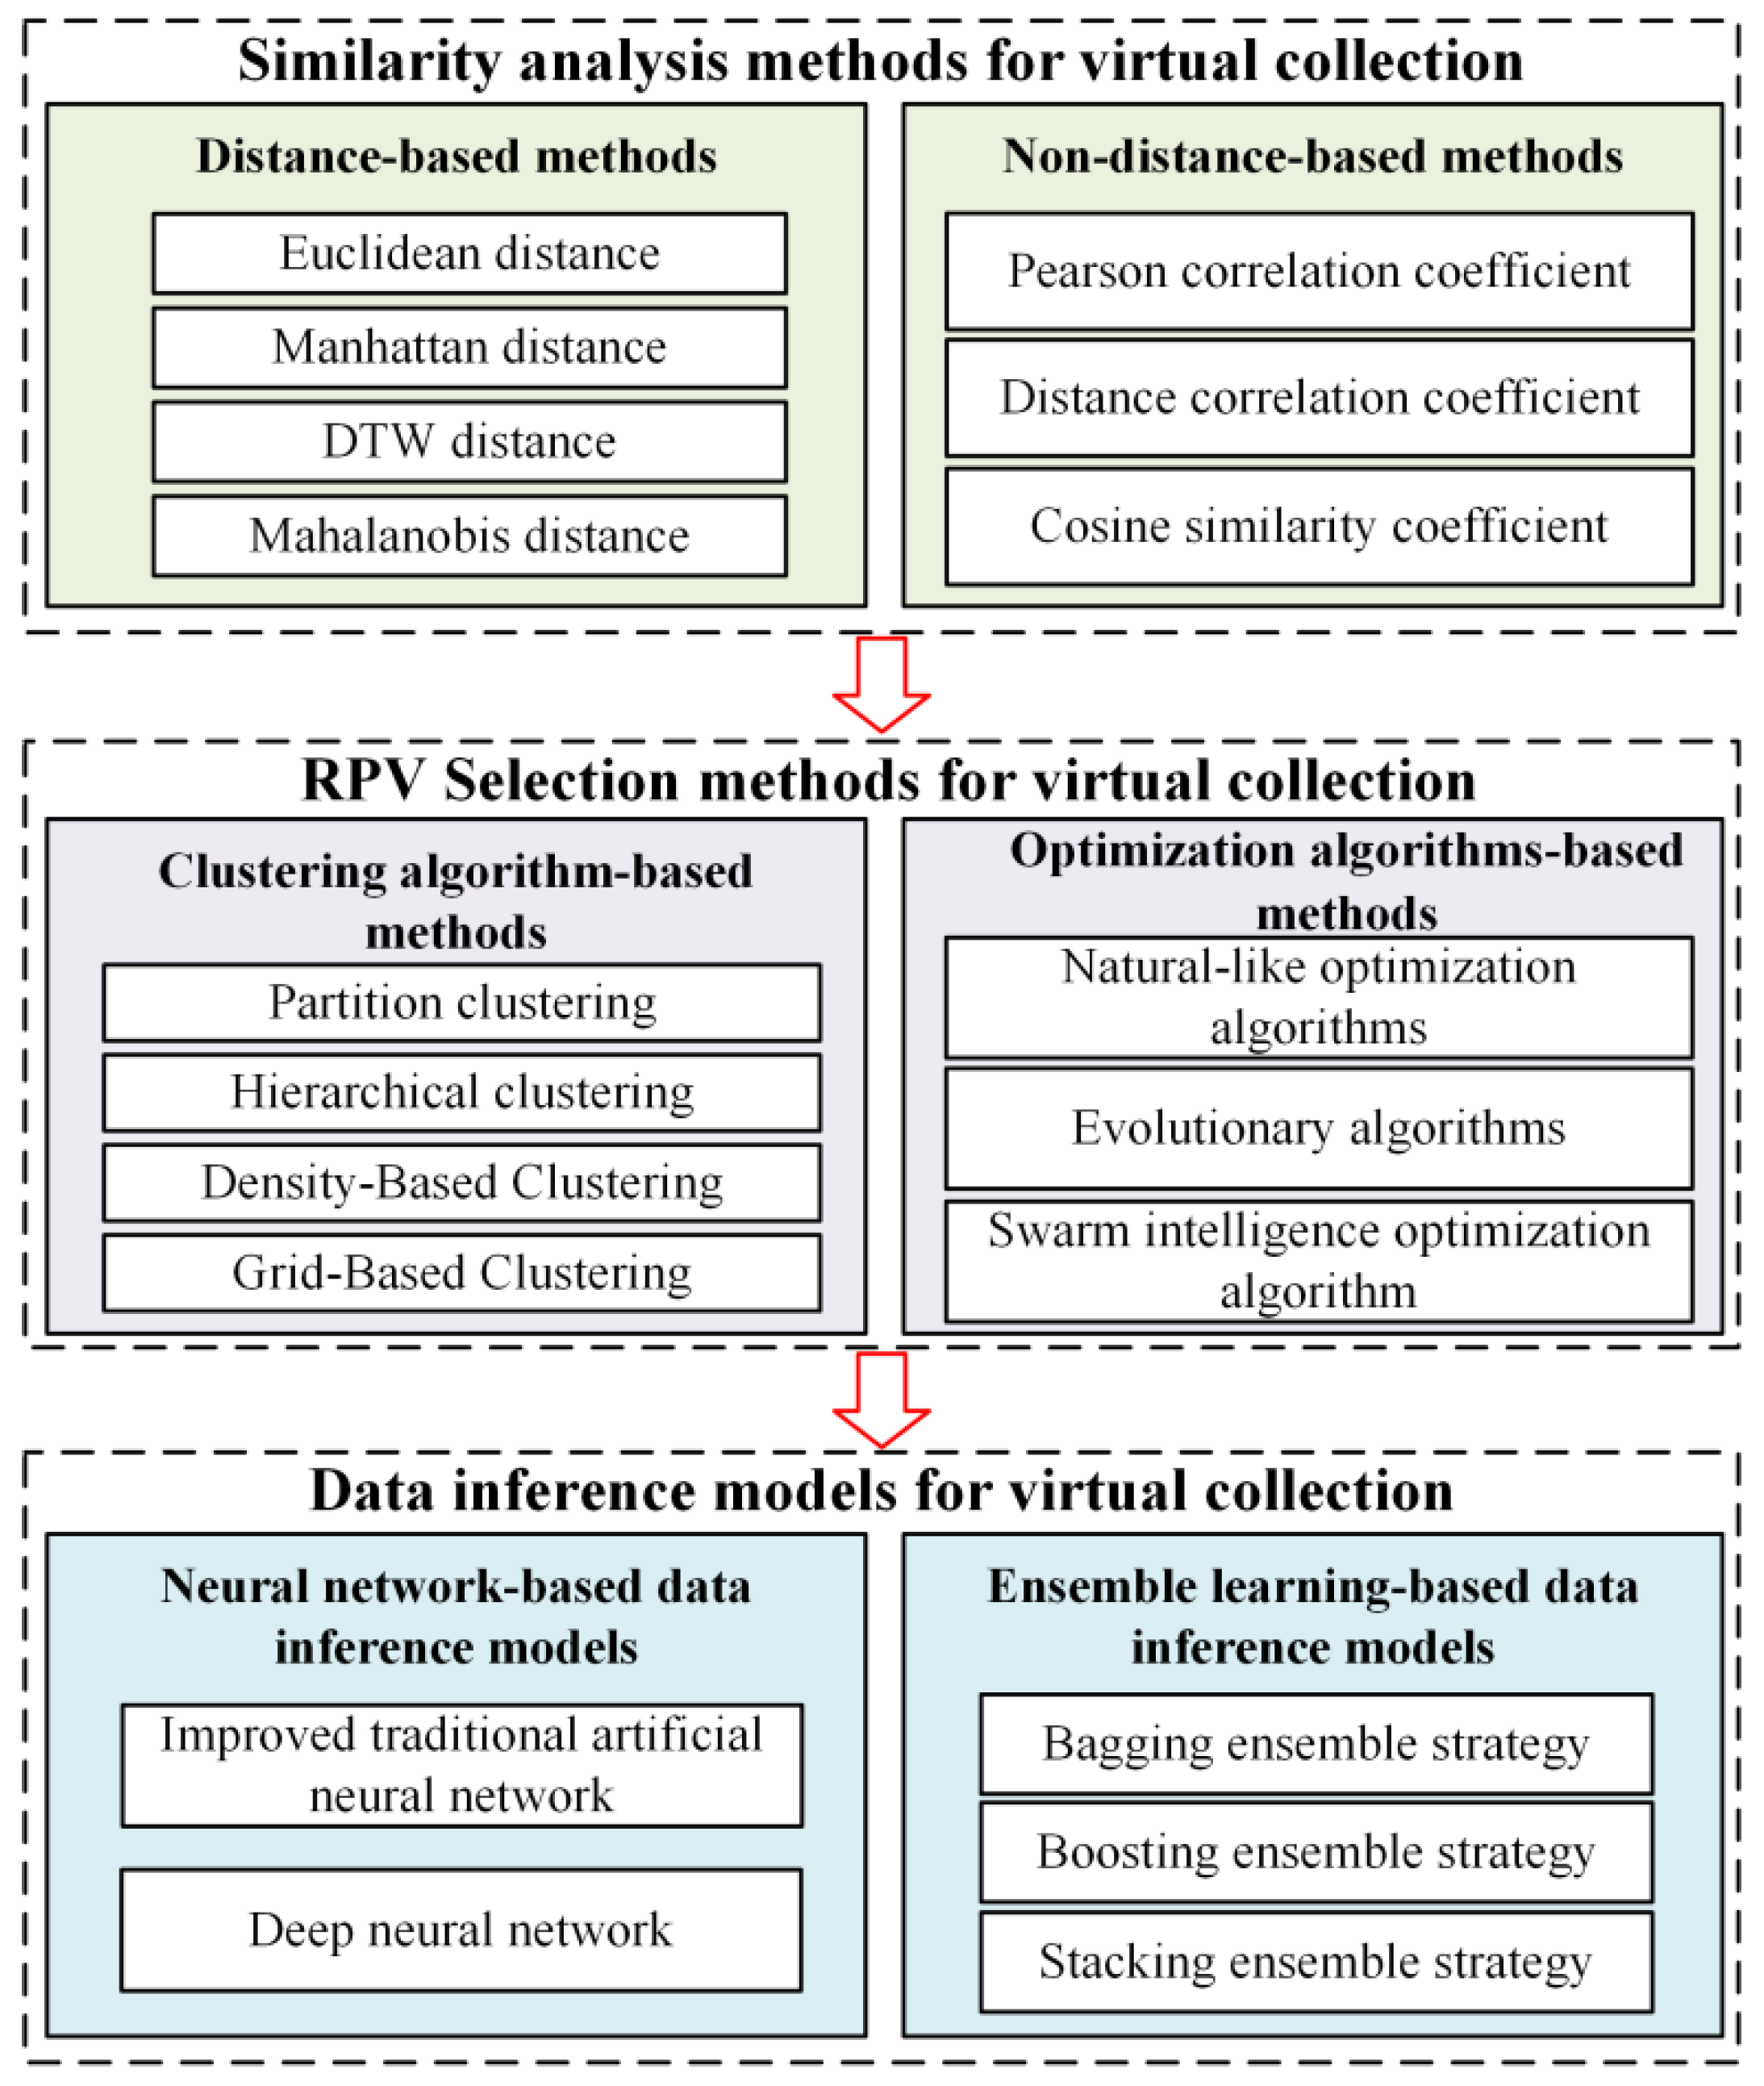
Figure 8. Summary of methods for virtual collection.
5. Application Scenarios of Virtual Collection Technology
With the scale expansion of DPVS, the DPVS application scenarios are more and more complex and variable. The acquisition of operation and maintenance information often suffers from incomplete data collection, transmission blockage, and high collection and transmission costs. Therefore, to bring more scholars’ attention to the practical application value of virtual collection, a variety of application scenarios for virtual collection based on multi-source information, including but not limited to the following:
- DPVSoperation data anomaly detection;
- DPVS fault diagnosis;
- DPVSmissing data recovery;
- DPVSreal-time operation data collection;
Figure 9 summarizes the four application scenarios and the significance of DPVS virtual collection technology.
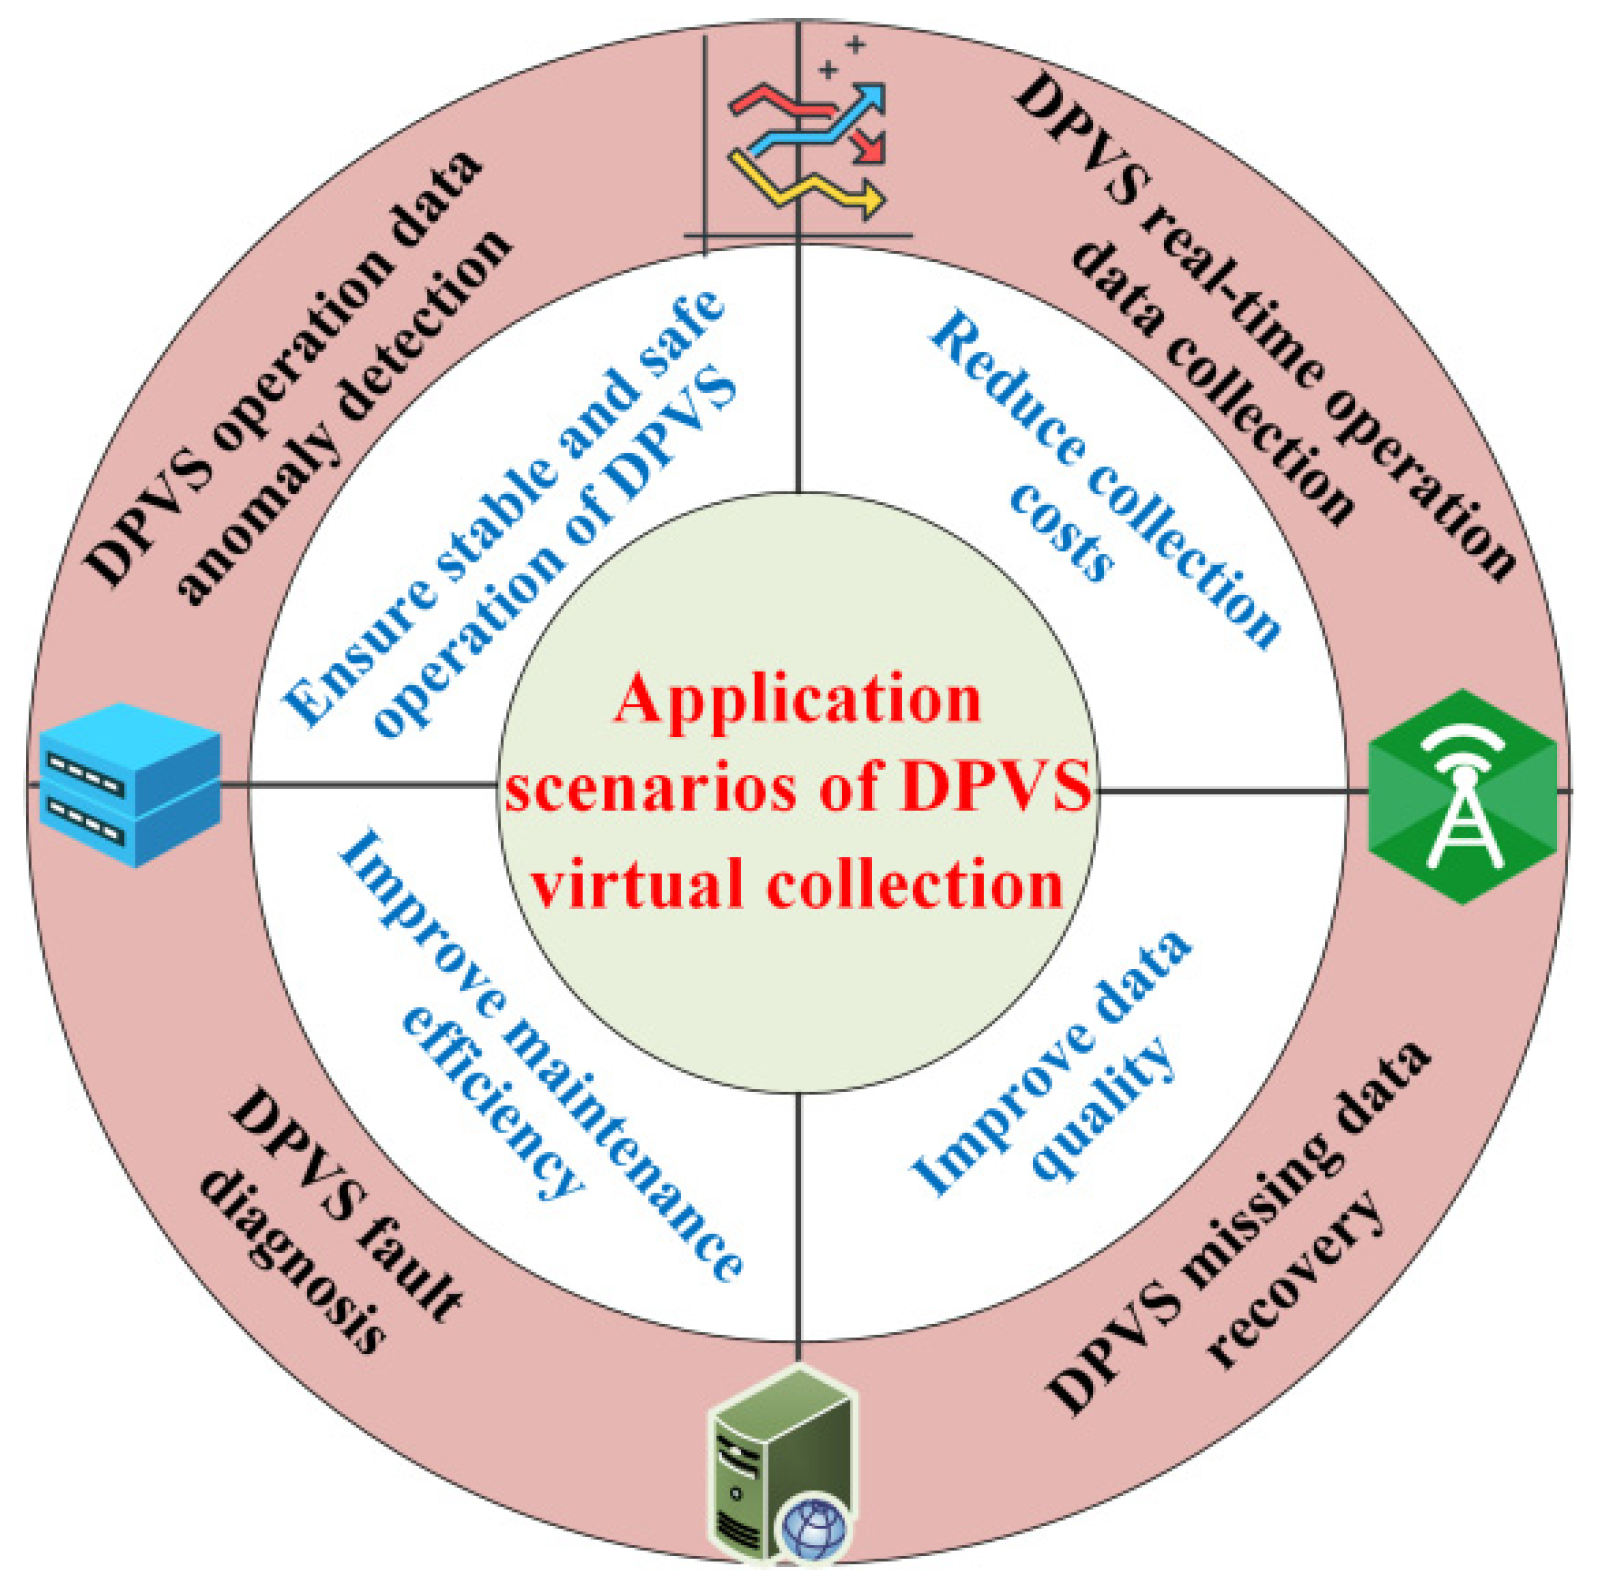
Figure 9. Application scenarios of DPVS virtual collection technology.
 +1 credit