随着分布式光伏系统(DPVS)的快速发展,数据监测设备的短缺和测量设备全面覆盖的难度变得更加突出,给DPVS的高效管理和维护带来了巨大的挑战。虚拟采集是一种新型的DPVS数据采集方案,具有成本效益和计算效率,满足分布式能源管理的需求,但缺乏关注和研究。为了填补当前研究领域的空白,本文对DPVS虚拟馆藏进行了全面系统的综述。
With the rapid development of distributed photovoltaic systems (DPVS), the shortage of data monitoring devices and the difficulty of comprehensive coverage of measurement equipment has become more significant, bringing great challenges to the efficient management and maintenance of DPVS. Virtual collection is a new DPVS data collection scheme with cost-effectiveness and computational efficiency that meets the needs of distributed energy management but lacks attention and research.
- distributed photovoltaic
- virtual collection
- similarity analysis
- artificial intelligence
1. 简介
Introduction
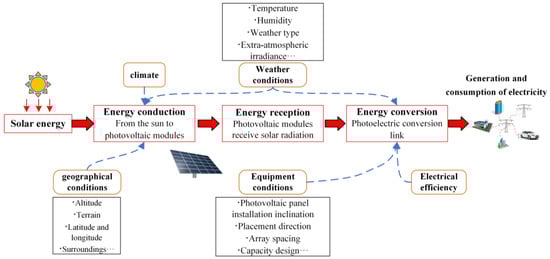
In the context of the current global energy crisis and increasing environmental pollution, photovoltaic (PV)发电因其高效率和清洁性而得到了世界各国的大力支持,迅速成为仅次于水电和风力发电的第三大可再生能源) power generation has received strong support from countries worldwide due to its high efficiency and cleanliness, rapidly becoming the third largest renewable energy source after hydropower and wind power [1]。根据国际能源署(. According to the reports of the International Energy Agency (IEA)的报告,2021年全球新增光伏装机容量超过175吉瓦,占新增可再生能源装机容量的一半以上。截至2021年底,全球累计光伏装机容量已超过942吉瓦。图1说明了全球光伏市场的变化动态以及中国光伏市场的重大影响), more than 175 GW of new PV capacity was installed worldwide in 2021, accounting for more than half of the new renewable energy capacity. By the end of 2021, the cumulative installed PV capacity worldwide had exceeded 942 GW. Figure 1 illustrates the changing dynamics of the global PV market and the substantial influence of the Chinese PV market [1]。.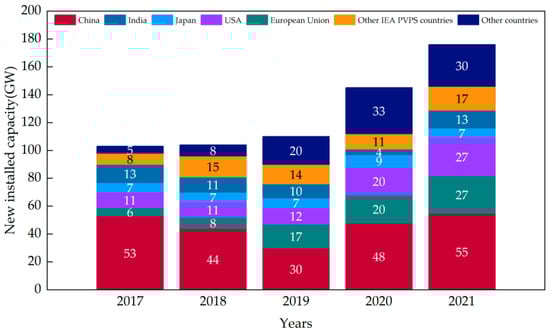
2. Overview of DPVS 虚拟馆藏概述Virtual Collection
虚拟采集中的The word “虚拟”一词表示该技术不通过现场的传感器、集热器和聚光器等采集设备收集光伏数据。虚拟采集是一种新型的推理技术,用于无法实时采集或难以采集的数据。其本质是由多个子系统组成的大型系统的系统识别和状态估计virtual” in the virtual collection indicates that the technology does not collect PV data through collection equipment such as sensors, collectors, and concentrators in the field. The virtual collection is a new type of inference technology for data that cannot be collected in real-time or is difficult to collect. Its essence is the system identification and state estimation of a large system composed of multiple subsystems [5]。. 如图As shown in Figure 3所示,本文根据, this paper divides the virtual collection process into three steps according to the implementation conditions of DPVS虚拟采集的实现条件,将虚拟采集过程分为三个步骤: virtual collection: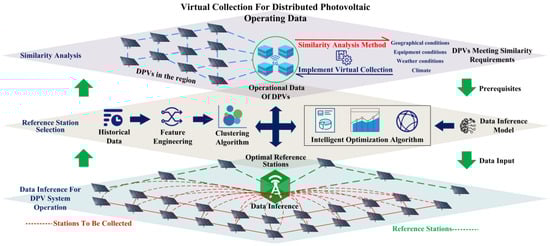
-
Similarity analysis of DPVS在虚拟采集区域的相似性分析。 in the virtual collection region.
-
选择用于虚拟采集的参考电站Selection of reference power stations (RPS)。(RPSs) for virtual collection.
-
Data inference of DPVS的数据推断,即通过计算智能准确估计该地区所有电站的输出。, i.e., accurate estimation of the output of all power stations in the region through computational intelligence.
3. Process and Challenges of DPVS虚拟采集的过程与挑战 Virtual Collection
The virtual collection of DPVS data is a new field that few scholars have studied. Therefore, in this section, to facilitate understanding, we compare and analyze the similarities and differences between the steps of virtual collection and other methods. Focusing on their similarities, we give directions for DPVS virtual collection research, and then focusing on their differences, we summarize the challenges faced by DPVS virtual collection. It is worth noting that this approach to elaboration is novel for the review literature and can help the reader understand the connections and differences clearly between virtual collection and other studies.3.1. 区域Similarity Analysis of Regional DPVS的相似性分析
光伏数据与外部条件以及安装地点的地理位置等因素密切相关。环境因素对虚拟馆藏模型的准确性有重大影响。因此,实现虚拟采集的前提之一是要采集的站点和PV data is most closely correlated with external conditions, and factors such as the geographic location of the installation site. Environmental factors have a significant impact on the accuracy of the virtual collection model. Therefore, one of the prerequisites assumed for the realization of virtual collection is that the station to be collected and the RPS具有相似的外部因素。从数据的角度来看,我们希望数据集尽可能遵循相似的分布模式,从而为监督学习提供更高质量的输入数据。这种相似性可以使虚拟馆藏更加健壮,并确保虚拟馆藏数据即使在天气变化的情况下也能准确无误。 have similar external factors. From the data point of view, we want the data set to obey similar distribution patterns as much as possible, thus providing higher-quality input data for supervised learning. This similarity can make the virtual collection more robust and ensure the virtual collection data’s accuracy even in weather changes. 举例来说,中国湖北省西南部的巴东县和江苏省南京市的江宁区,由于地形、地形、气象和其他条件的不同,产生的电力数据差异很大。图To illustrate, Badong County in southwestern Hubei Province, China, and Jiangning District in Nanjing City, Jiangsu Province, produce widely different power data due to different terrain, topography, meteorology and other conditions. Figure 4显示了典型夏日巴东县和江宁区光伏电站的功率输出。对于江宁区的 shows the power output of PV stations in Badong County and Jiangning District on a typical summer day. For the DPVS来说,使用巴东区的DPVS运行数据进行数据推断,由于两者之间的相似度极低,会严重降低虚拟采集的准确性。因此,有必要通过相似性分析提前定义满足相似性要求的光伏电站集群。 of Jiangning district, using the DPVS operation data of Badong district for data inference would seriously reduce the accuracy of the virtual collection because of the extremely low similarity between them. Therefore, it is necessary to define clusters of PV stations that satisfy the similarity requirement by similarity analysis in advance.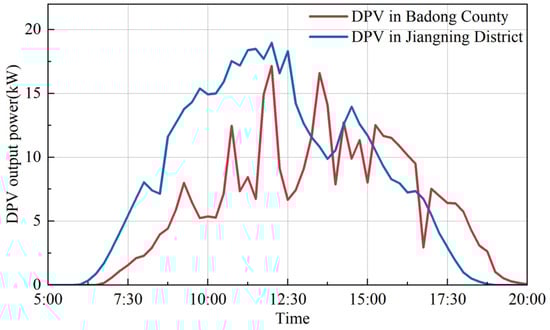
3.2. 虚拟集合的 RPS 选择Selection for Virtual Collection
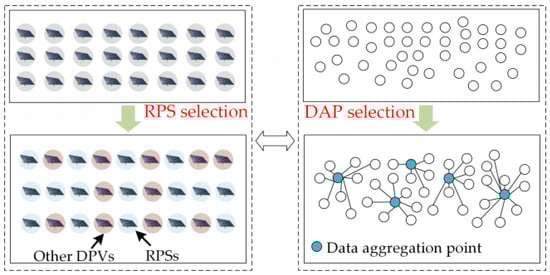
选择Selecting the RPS 是虚拟收集过程中最关键的一步。RPS的实时功率数据将作为多维特征输入计算智能算法,以估计所有区域DPV的输出。我们的目标是在区域DPVS中选择DPVS的子集,这些DPVS可以更准确地估计其他台站的数据。此步骤的关键是确定收集最重要数据的选择性传感器位置,以监控所有DPV的状态。因此,我们将从输入数据和设备放置的角度分析RPS选择步骤与其他方法之间的差异和关联。s is the most crucial step in the virtual collection process. The RPSs’ real-time power data will be input into the computational intelligence algorithm as multidimensional features to estimate the output of all regional DPVS. We aim to select the subset of DPVS among the regional DPVS that can estimate the data of other stations with higher accuracy. The key to this step is to identify selective sensor locations where the most important data is collected to monitor the status of all DPVS. Therefore, we will analyze the differences and associations between the RPS selection step and other methods from the perspectives of input data and equipment placement. 如图As shown in Figure 6所示,从输入数据的角度来看,, from the perspective of input data, the selection of RPS的选择可以近似为机器学习的特征选择问题。两者都旨在通过选择 RPS(特征)尽可能提高结果的准确性。因此,虽然关于参考电站选择的研究很少,但相对成熟的特征选择理论也可以为我们提供启示。对于数据挖掘技术,输入数据的特征质量严重影响模型的性能,因此许多学者都研究了特征选择问题。参考文献s can be approximated as the feature selection problem of machine learning. Both aim to improve the accuracy of the results as much as possible by selecting RPSs (features). Therefore, although there are few studies on the selection of reference power stations, the relatively mature feature selection theory can also provide us with inspiration. For data mining techniques, the feature quality of input data seriously affects the model’s performance, so many scholars have researched the feature selection problem. Ref. [10]从单个稀疏特征选择和组稀疏特征选择的角度系统地研究了现有的稀疏学习模型的特征选择。它分析了各种稀疏学习模型之间的差异和联系。参考文献 systematically examined the existing sparse learning models for feature selection from the perspective of individual sparse feature selection and group sparse feature selection. It analyzed the differences and connections among various sparse learning models. Ref. [11]提出了一种新的增量特征选择,使该方法对动态排序的数据具有鲁棒性。参考文献 proposes a new incremental feature selection that makes the method robust to dynamically ordered data. Ref. [12]提出了一种蚱蜢优化算法,该算法可以通过从大量原始特征中选择可以更好地表征数据属性的特征子集来解决二元优化问题,从而提高分类精度。上述研究对特征选择问题提出了有效的处理方法,可为选择 proposes a grasshopper optimization algorithm that can solve the binary optimization problem by selecting a subset of features that can better characterize the data attributes from a large set of original features, thus improving the classification accuracy. The above studies proposed effective processing for the feature selection problem, which can provide some theoretical reference for selecting RPS提供一定的理论参考,例如将RPS选择转化为组合优化问题。但值得注意的是,如果选择某电站作为RPS,则将其用作输入要素,其余电站则用作要采集的电站。可以看出,虚拟集合的RPS选择问题类似于高维特征选择问题s, such as transforming the RPS selection into a combinatorial optimization problem. However, it is worth noting that if a power station is selected as the RPS, it is used as the input feature, and the remaining power stations are used as the power stations to be collected. It can be seen that the RPS selection problem for virtual collection is similar to the high-dimensional feature selection problem [13],但与传统回归和分类 yet different from the feature selection in the traditional regression and classification [14]问题中的特征选择不同。因此,选择合理的 problems. Therefore, choosing reasonable RPS比选择功能更具挑战性。s is more challenging than feature selection.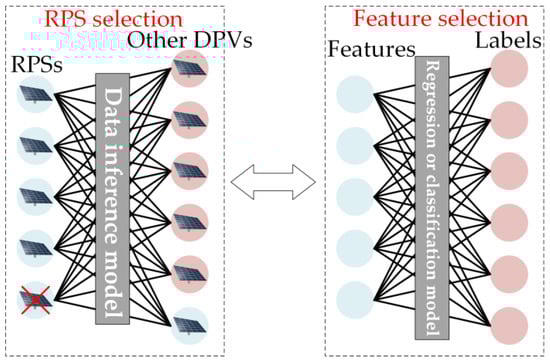
3.3. 区域Data Inference for Regional DPVS 的数据推断
虚拟采集技术的最后一步是通过人工智能算法推断整个The final step of the virtual collection technique is to infer the operational data of the whole DPVS的运行数据。此步骤通过在RPS和要在区域中收集的电站之间构建计算智能模型,使用第二步中选择的RPS数据作为输入,映射RPS与整个系统之间的关系。此步骤类似于PV预测技术中使用的方法,两者都需要一定的历史数据作为驱动因素来获得未知的PV输出功率。 through an artificial intelligence algorithm. This step maps the relationship between the RPS and the whole system by building a computational intelligence model between the RPSs and the power stations to be collected in the region, using the data from the RPSs selected in the second step as the input. This step is similar to the method used in PV prediction techniques, both of which require certain historical data as a driver to obtain the unknown PV output power. 业界对There is relatively little research in the industry on DPVS虚拟数据推断的研究相对较少,大多数研究仅关注光伏发电量预测,利用历史数据、实时天气等环境信息来预测光伏发电量。值得庆幸的是,目前的DPVS功率预测算法相对成熟,可以为虚拟DPVS数据采集提供一些理论参考。但值得注意的是,虚拟采集中的数据推断在模型构建和使用上与传统的PV预测存在差异。虚拟数据收集通过数据推理模型实时估计当前的光伏功率输出,而光伏预测器估计未来的功率输出。虚拟采集模型的输入是来自 RPS 的实时 PV 数据,PV 预测器的输入是历史运行数据和环境信息。这种实时性使得虚拟采集的数据推理模型必须比PV预测模型具有更好的鲁棒性和更高的精度要求。4. DPVS虚拟采集方法
上一节介绍了虚拟采集的具体实施步骤及其目的,并指出了为上述步骤面临的挑战提供解决方案的迫切需要。因此,本节通过总结适用于DPVS相似性分析、RPS选择和DPVS数据推理的方法,为虚拟采集技术的发展提供理论支持。图 8 总结了 DPVS 虚拟采集的各种方法。
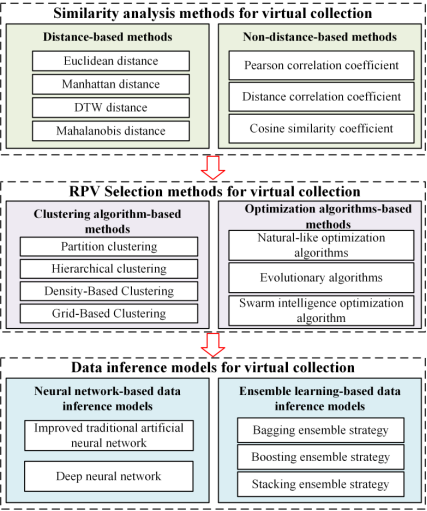
图8.虚拟收集方法摘要。
5. 虚拟采集技术的应用场景
随着DPVS的规模扩大,DPVS的应用场景越来越复杂多变。运维信息的获取往往存在数据采集不完整、传输堵塞、采集传输成本高等问题。因此,为引起更多学者对虚拟馆藏实际应用价值的关注,本文创新性地总结了基于多源信息的虚拟馆藏的多种应用场景,包括但不限于以下内容:
- DPVS操作数据异常检测。
- DPVS 故障诊断。
- DPV缺少数据恢复。
- DPVS实时操作数据收集。
图9总结了四种应用场景以及DPVS虚拟采集技术的意义。
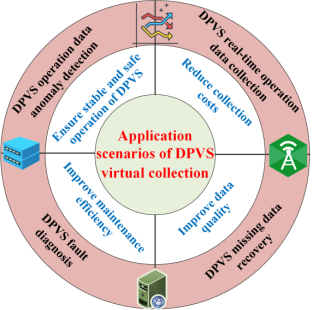
图9.DPVS虚拟采集技术的应用场景。
virtual data inference, with most studies focusing only on PV power prediction, using historical data, real-time weather, and other environmental information to predict PV power output. Thankfully, the current DPVS power prediction algorithms are relatively mature and can provide some theoretical references for virtual DPVS data collection. However, it is worth noting that data inference in virtual collection differs from traditional PV prediction in model construction and use. Virtual data collection estimates the current PV power output in real time through a data inference model, whereas the PV predictor estimates the future power output. The input to the virtual collection model is real-time PV data from the RPSs, and the input to the PV predictor is historical operational data and environmental information. This real-time nature makes it necessary that the data inference model for virtual collection has better robustness and higher accuracy requirements than that for PV prediction.