Your browser does not fully support modern features. Please upgrade for a smoother experience.
Submitted Successfully!
 +1 credit
Thank you for your contribution! You can also upload a video entry or images related to this topic.
For video creation, please contact our Academic Video Service.
| Version | Summary | Created by | Modification | Content Size | Created at | Operation |
|---|---|---|---|---|---|---|
| 1 | Lenka Česlová | -- | 3043 | 2022-11-11 09:29:47 | | | |
| 2 | Lindsay Dong | Meta information modification | 3043 | 2022-11-14 02:35:28 | | | | |
| 3 | Lenka Česlová | -19 word(s) | 3024 | 2022-11-14 07:26:43 | | |
Video Upload Options
We provide professional Academic Video Service to translate complex research into visually appealing presentations. Would you like to try it?
Cite
If you have any further questions, please contact Encyclopedia Editorial Office.
Klikarová, J.; Česlová, L. High-Performance Liquid Chromatography Analysis of Coffee-Based Products. Encyclopedia. Available online: https://encyclopedia.pub/entry/34183 (accessed on 23 July 2026).
Klikarová J, Česlová L. High-Performance Liquid Chromatography Analysis of Coffee-Based Products. Encyclopedia. Available at: https://encyclopedia.pub/entry/34183. Accessed July 23, 2026.
Klikarová, Jitka, Lenka Česlová. "High-Performance Liquid Chromatography Analysis of Coffee-Based Products" Encyclopedia, https://encyclopedia.pub/entry/34183 (accessed July 23, 2026).
Klikarová, J., & Česlová, L. (2022, November 11). High-Performance Liquid Chromatography Analysis of Coffee-Based Products. In Encyclopedia. https://encyclopedia.pub/entry/34183
Klikarová, Jitka and Lenka Česlová. "High-Performance Liquid Chromatography Analysis of Coffee-Based Products." Encyclopedia. Web. 11 November, 2022.
Copy Citation
Coffee is a very popular beverage worldwide. However, its composition and characteristics are affected by a number of factors, such as geographical and botanical origin, harvesting and roasting conditions, and brewing method used. As coffee consumption rises, the demands on its high quality and authenticity naturally grows as well. Unfortunately, at the same time, various tricks of coffee adulteration occur more frequently, with the intention of quick economic profit. Many analytical methods have already been developed to verify the coffee authenticity, in which the high-performance liquid chromatography (HPLC) plays a crucial role, especially thanks to its high selectivity and sensitivity.
coffee
targeted analysis
non-targeted fingerprint
HPLC
1. Introduction
The coffee tree belongs to the Coffea genus of the Rubiaceae family, including more than 100 species, of which Coffea Arabica (Arabica) and Coffea Canephora (Robusta) are the most consumed, and therefore the most economically important [1][2][3]. Arabica differs from Robusta in several aspects, such as morphology, size and colour of the beans, chemical composition, and sensory properties [4][5][6], as well as growing, cultivation, and brewing properties [7]. Robusta provides very good body and foam, is richer in chlorogenic acids, and contains approximately 40–50% more caffeine than Arabica, which accounts for 65% of global production, is more acidic, less bitter, and has a more refined and pronounced taste and aroma [7][8][9][10][11]. For this reason, Arabica is much more appreciated by coffee consumers, hence its market price is approximately 20–25% higher compared to Robusta [12].
The phytochemical profile of green coffee beans is currently known to be very complex and provides a wide range of health benefits [13][14]. Coffee has been valued for years for its stimulating effect on the central nervous system, associated primarily with caffeine [15][16][17]. Nevertheless, studies show that consumption of two to three coffee cups a day brings many other potential health benefits, including prevention of cancer, type 2 diabetes, cardiovascular and liver diseases, and Alzheimer’s and Parkinson’s diseases [16][17][18][19][20][21][22][23][24][25][26]. In addition to caffeine, the most important bioactive compounds responsible for these effects are mainly polyphenols [13][27][28][29], of which esters of caffeic and quinic acids, known as chlorogenic acid isomers, are the most abundant [15][16]. While caffeic acid has anticancer effects [30], chlorogenic acids (CGA, Figure 1), including the isomers of caffeoylquinic (CafQA), dicaffeoylquinic (diCafQA), feruloylquinic (FQA), and p-coumaroylquinic (pCoQA) acids, exhibit antibacterial, antifungal, antiviral, antioxidant, and chemoprotective properties [26][31][32]. Coffee polyphenols, together with caffeine, also balance cholesterol and arrhythmia, reduce lipid oxidation and risk of obesity, hypertension, hyperglycemia, or heart and liver failure [22][33][34][35][36][37]. However, caffeine is also associated with stomach irritation, insomnia, and increased breathing and heart rate [26]. As regards the organoleptic characteristics of the coffee beverage, polyphenols are considered to be responsible for its acidity, bitterness, and astringency [38][39].

Figure 1. Structures of the most important chlorogenic acids present in coffee.
2. Coffee Adulteration
According to the European Commission, food products are adulterated if their composition and/or quality do not match their description or labelling [40]. Adulterated food products are usually not harmful to health (sometimes the nutritional value may even be increased), but consumers have a right to know what exactly they are buying and consuming. Moreover, a potential risk of food allergies caused by additives has to be considered [41].
Coffee has been adulterated since time immemorial and today even ranks high at the top of the list of the most adulterated foods [42]. A very common method of coffee adulteration is to mix beans of different economic value. The undeclared, and thus illegal, addition of cheaper Robusta to Arabica is therefore considered a fraud. Therefore, many researchers have successfully studied the distinction between Arabica and Robusta in coffee blends [1][5][10][12][43][44][45][46][47][48][49][50][51][52][53][54][55][56][57][58][59]. As coffee quality is linked to specific growing areas, incorrect geographical indications are also considered illegal and have been verified by several teams of scientists [10][44][60][61][62][63][64][65][66][67][68][69]. The last common way of coffee adulteration is the blending of roasted coffee with undeclared materials. The list of coffee adulterants is very long and includes roasted and unroasted coffee husks and stalks, cereals (e.g., chicory, corn, barley, wheat, rye, oats, rice, buckwheat, triticale, bran, and malt), legumes (e.g., soybeans, peas, chickpeas, and carob), roots (e.g., chicory or dandelion), vegetables (e.g., potatoes, carrots, and beetroots), fruits (e.g., figs, bananas, acai, and prunes), nuts (e.g., almonds, peanuts, and chestnuts), and seeds (especially cocoa and sunflower seeds). Several techniques have also been developed to detect these impurities [10][41][68][70][71][72][73][74][75][76][77][78][79][80].
As indicated, adulteration practices are diverse and include many tricks to reduce production costs and thus increase the profit from the final product [78][81][82]. However, adulterated coffee products not only mislead consumers, but can also affect their health [71][73]. Therefore, it is essential that analytical techniques are able to detect various forms of adulteration (the use of poor-quality coffee beans, such as unripe, burnt, defective, etc. [10], presence of specific adulterants, degree of dilution, and unauthorized use of geographic origin of coffee beans [78][81][82]) to find whether the product label claims are based on the truth. For these reasons, various spectroscopic [12][50][60][62][63][67][68][69][79][83][84][85][86][87][88][89][90][91][92][93], electrophoretic [74][75], electrochemical [76][80], and biological [56][75][77][94] techniques have already been developed, but chromatographic techniques, especially high performance liquid chromatography (HPLC), have become the most dominant [1][39][45][46][51][66][72][73][95][96][97][98][99] for their more versatile use, reliability, reproducibility of results, possibility of automatization, identification of a large number of qualitative biomarkers in complex matrices, and low sample consumption [13][95][98][100][101].
3. Analysis of Antioxidants in Coffee Products Using HPLC
3.1. Sample Preparation
Prior to chromatographic analysis, the samples of green, as well as roasted coffee beans, have to be always grinded to a powder from which the target analytes can be subsequently extracted. The contact surface, particle size, weight of the sieve, extraction technique used, as well as time, temperature, and pressure of extraction, are the most significant extraction variables [102]. Depending on the analyte, various extraction methods have already been developed. A simple solid–liquid infusion using hot water [11][26][39][96][102][103][104][105][106][107] or organic solvents [32][99][108][109] is the most common technique of PPs and caffeine isolation. Other extraction techniques, namely percolation [110], ultrasound-assisted [108][111][112] or microwave-assisted extractions [111], QuEChERS [108], and deep eutectic solvent-based extraction [113] have been used rarely. Since the coffee brewing method plays an essential role in the composition and health properties of the resulting beverage, many studies dealing with this issue have already been published [11][106][114][115][116]. In the study of Budryn et al. [114], the influence of coffee genotypes (Arabica vs. Robusta) on the efficiency of various extraction methods (brewing with boiling water and boiling in water at normal and elevated pressure) was investigated. The most efficient extraction methods of chlorogenic acid isomers from ground Arabica and Robusta green coffee beans were boiling with water at normal and elevated pressure, respectively.
3.2. Targeted Analysis
HPLC with spectrophotometric detection (HPLC-UV/VIS), combined with multivariate data treatment, was used to distinguish between specialty and traditional coffee beans in the study by Alcantara et al. [39]. Using PCA, all seventeen samples were very successfully divided into two groups (special versus traditional coffee) according to the quantity of caffeine, chlorogenic, nicotinic, and caffeic acids. This recognition of samples is useful for consumer protection because traditional coffees are of lower quality and, therefore, these can be purchased more cheaply. The main difference was the number and amounts of compounds that were responsible for the organoleptic properties of coffee. Traditional coffees, usually representing blends of Arabica and Robusta, contained higher caffeine and lower polyphenol contents than specialty coffees, which are typically composed of entirely 100% Arabica and roasted to a lower degree, resulting in less degradation of biologically active substances and, consequently, less loss of sensory properties.
The assessment and the comparison of antioxidant potential and content of selected biologically active substances (caffeine and coumaric, ferulic, caffeic, and chlorogenic acids) between green coffee samples and food supplements, based on green coffee extracts, was the aim of the work of Brzezicha et al. [112]. In fact, food supplements are not subject to any quality control or analytical verification of their composition before they are placed on the market. There are not even uniform procedures for verifying their authenticity. For this reason, many questions arise about their quality, efficacy, and safety, as well as whether a supplement or a food is a better source of biologically active substances. Brzezicha et al. [112] ascertained that green coffee samples have comparable or even higher antioxidant properties than dietary supplements. The amount of 5-CafQA in food supplements was very diverse (0.33–329 mg/g) compared to green coffee samples (32.7–47.6 mg/g). Moreover, the green coffee samples contained lower levels of caffeine. The scholars found discrepancies between the determined and the manufacturer’s declared values (the amount of chlorogenic acid was in all cases below the declared value and, conversely, the amount of caffeine was higher in some samples than indicated on the packaging). The quality of food supplements could therefore be summarized as unsatisfactory.
The effect of the coffee roasting process on selected compounds was investigated by Macheiner et al. [109] and Schouten et al. [105] using HPLC-UV/VIS and HPLC-MS/MS instrumentation, respectively. Macheiner et al. [109] examined changes of CafQA and diCafQA isomers present in Arabica and Robusta coffee samples during different degrees and temperatures of roasting, batch size, and roaster designs, while Schouten et al. [105] focused on changes in antioxidant capacity (FRAP, DPPH, and ABTS methods), total phenolic content (Folin-Ciocalteu method), weight loss, water activity, density, moisture, and colour, as well as concentration changes of acrylamide, trigonelline, and nicotinic and caffeic acids in Arabica and Robusta coffee samples roasted to five different roasting degrees (light, medium-light, medium, medium-dark, and dark). Regardless of the botanical origin of the sample, the antioxidant capacity was highest in the first two stages of coffee roasting. With a higher degree of roasting, the antioxidant capacity decreased, but because of the formation of other antioxidant molecules, such as free quinic acid, melanoidins, or other low molecular weight phenolic compounds, the decline was only moderate [105]. Analogous findings concerning isomerization and other compositional changes occurring during the roasting process were also reported in the study by Klikarová et al. [96]. Further, Schouten et al. [105] presented that the total CGA content was higher in green and light roasted samples. The most abundant CGAs were 5-CafQA (about 80%), followed by 3-CafQA and 3,5-diCafQA. The content of 3-CafQA was increased by light roasting, while 5-CafQA was reduced or stagnated. Decreases in 5-CafQA, 3-CafQA, and 3,5-diCafQA of about 90%, 70%, and 70%, respectively, were observed in dark roasted samples. No significant differences in antioxidant capacity were found between the Robusta and Arabica green samples. However, after roasting, Robusta samples showed considerably higher values, probably due to higher caffeine content. In contrast, total CGA and trigonelline levels were higher in Arabica samples [105]. According to Macheiner et al. [109], chlorogenic acid isomerization reactions were detected at comparable stages of the coffee roasting process, regardless of species, variety, batch size, or roaster design. Degradation of 3-CafQA and 4-CafQA due to isomerization reactions were slower and occurred later in Robusta beans than in Arabica beans. Concentrations of 3,4-diCafQA and 4,5-diCafQA remained almost unchanged until the first crack, while 3,5-diCafQA degraded very rapidly regardless of Coffea species, batch size, and roaster designs. Thereafter, the concentrations of all diCafQA isomers observed continued to decrease until the end of the roasting process.

3.3. Non-Targeted Analysis
Recently, numerous non-targeted analysis approaches have been developed, dealing not only with the HPLC fingerprints [1][117][118][119][120][121][122][123][124][125][126][127], but also, less frequently, with profiling using techniques such as gas chromatography coupled to mass spectrometry [101][128][129], nuclear magnetic resonance (NMR) [57][81], UV/VIS spectroscopy [130], or inductively coupled plasma optical emission spectrometry [61][62]. These techniques are predominantly combined with multidimensional statistical methods, such as PCA, factor analysis (FA), discriminant analysis (DA), partial least squares regression (PLS), and their combinations (e.g., PLS-DA), in order to obtain as much information from the measured data as possible.
Strategies of non-targeted chromatographic fingerprinting are based on recording instrumental signals as a function of retention time, but without knowing any further information (identification or quantification) about the compounds providing these signals. For this purpose, simple sample processing procedures are usually used to obtain as many compounds of different families as possible [118]. Thus, non-targeted analysis represents a very simple, rapid, and inexpensive method that could be advantageously used to verify the authenticity and quality of coffee.
Non-targeted HPLC-MS metabolic profiling was effectively used to elucidate the relationship between metabolites and the cupping score indicating the beverage quality [119]. In total, thirty-six varieties of green beans from Guatemala were subjected to the analysis. Using an orthogonal partial least squares (OPLS) regression model, two metabolites (from a total of 2649 valid peaks) were found to be strongly correlated with a high cupping score, and can therefore be utilised as universal quality indicators. The metabolites were first purified and then spectroscopically identified as isomers of 3-methylbutanoyl disaccharides (i.e., precursors of 3-methylbutanoic acid that is known to enhance the coffee quality).
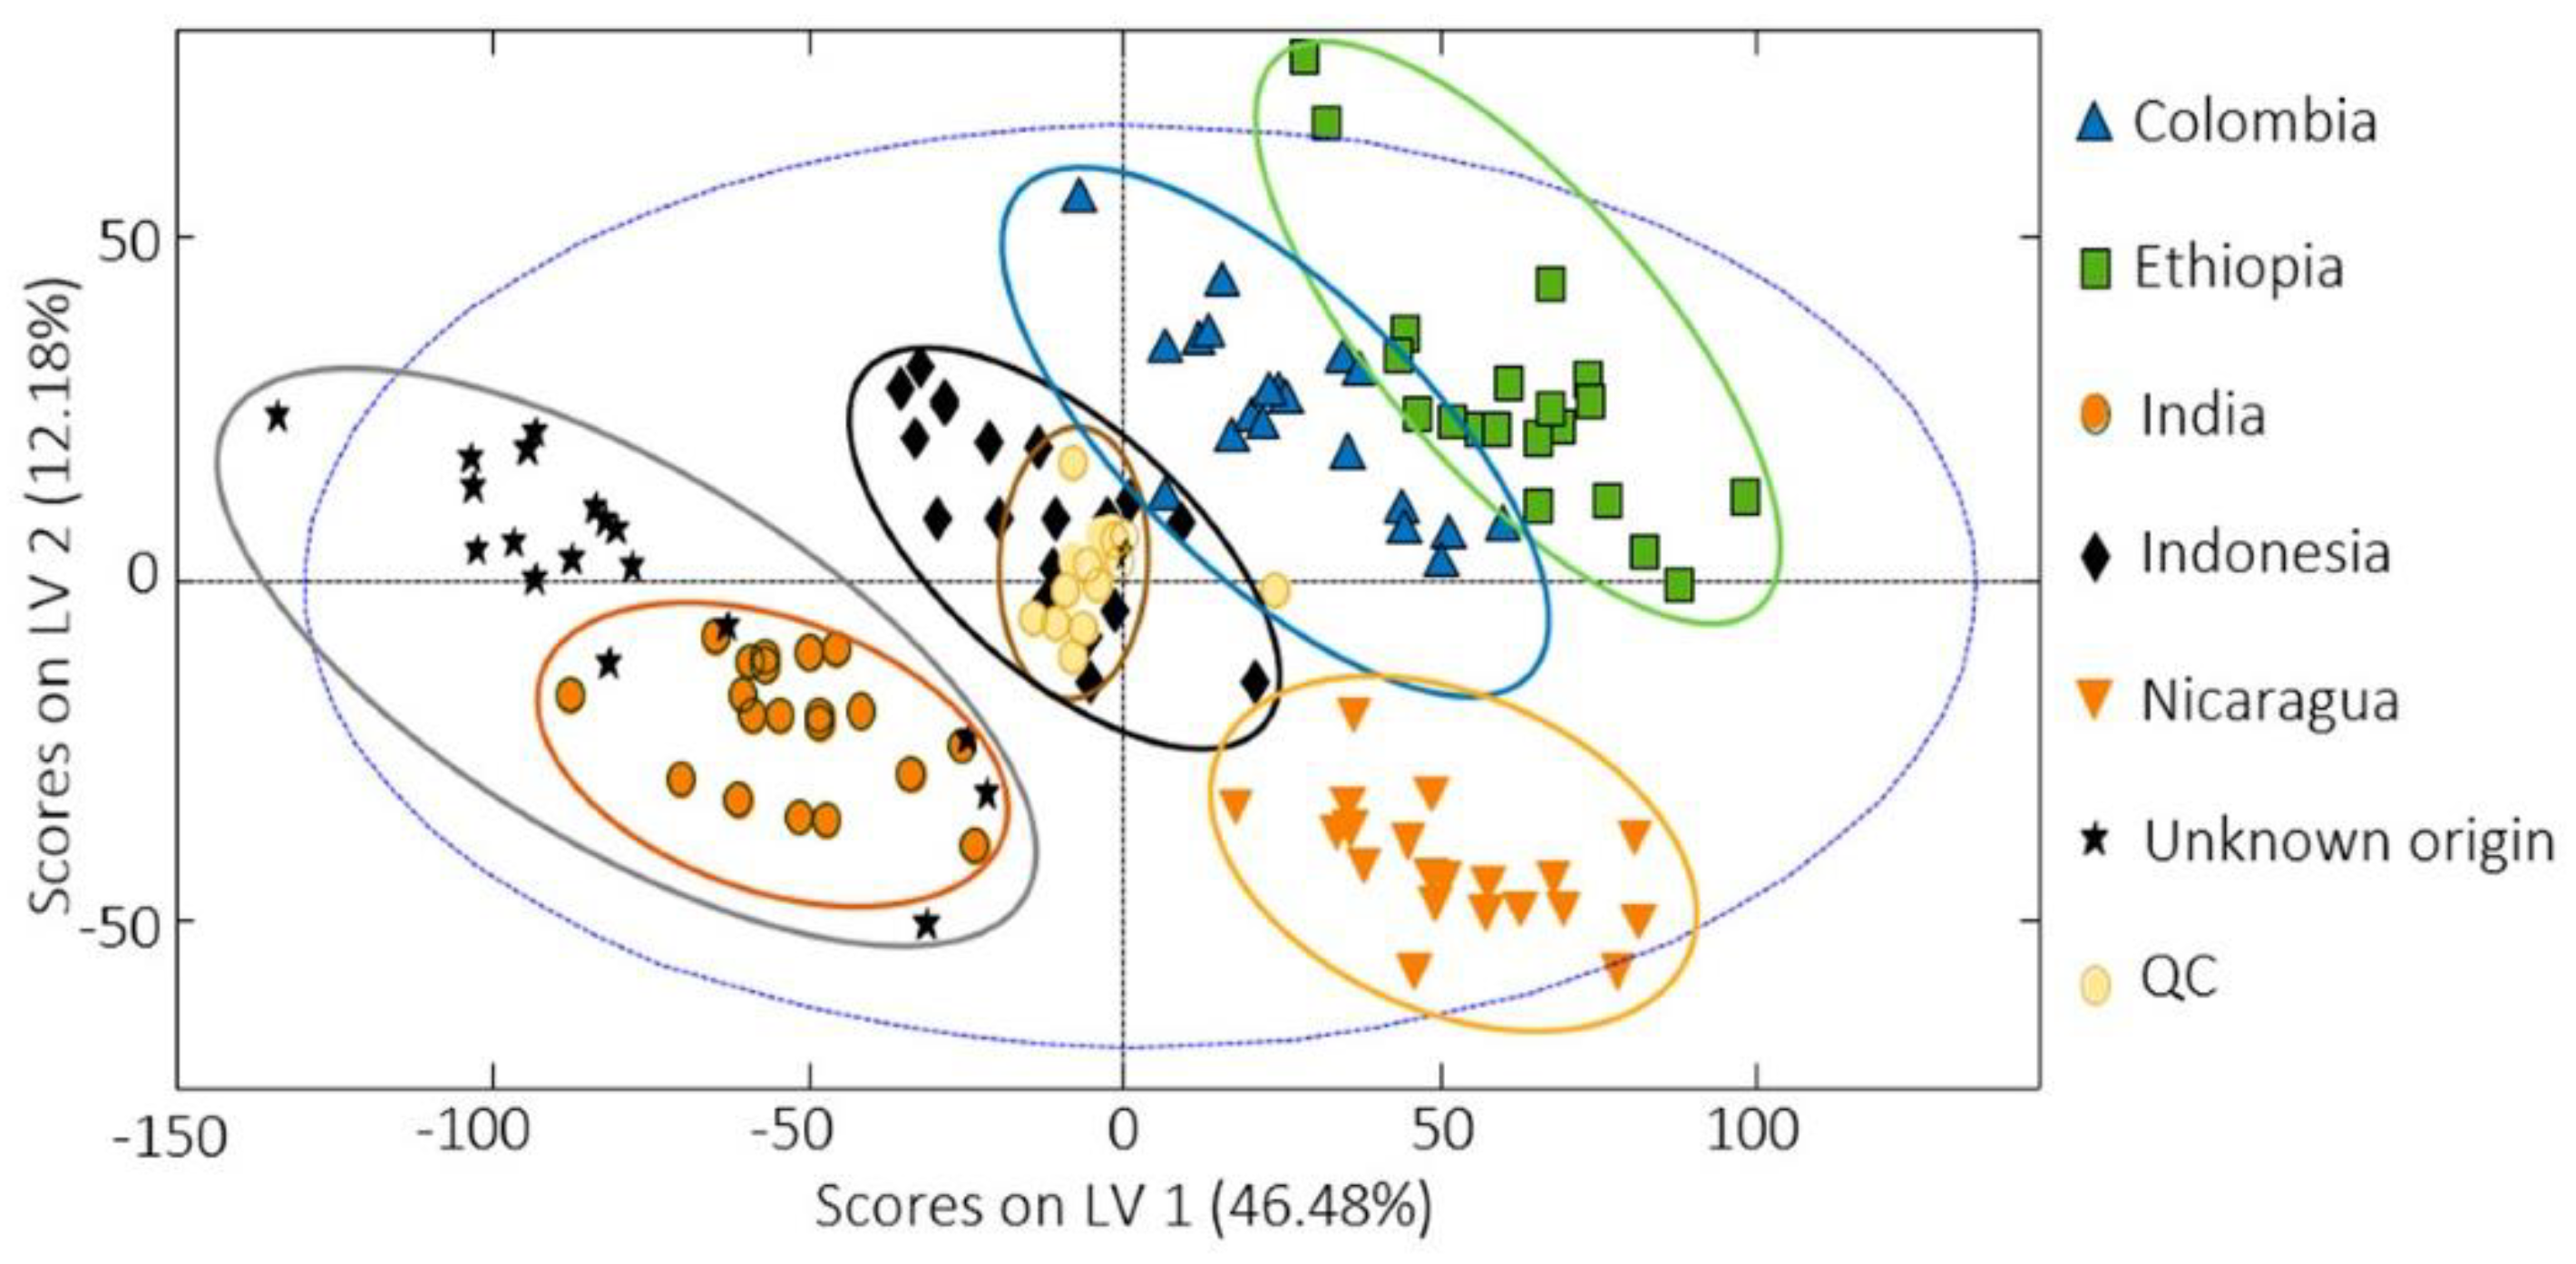
For characterisation and evaluation of the coffee authenticity and quality, a total of five papers concerning the non-targeted HPLC fingerprint strategies using UV/VIS or fluorescent detection (FLD), combined with chemometrics, were published by the Spanish researchers in 2020–2021 [1][118][122][123][124]. In 2020, they analysed a total of 306 commercially available coffee samples, of which 240 were Nespresso-type products of various origins (Nicaragua, Brazil, India, Uganda, Ethiopia, Central/South America, Columbia, or Indonesia), purchased in supermarkets in Barcelona (Spain), and brewed directly by using an espresso machine [1]. The next 66 samples were purchased in bean form in Vietnam and Cambodia and, after grinding, these were brewed using a moka pot coffee maker. All samples differed in variety (Arabica, Robusta, or their mixture) and degree of roasting (1–5). Selected samples were also used for adulteration studies where the original coffee was mixed with “adulterant” coffee (Colombia vs. Ethiopia, Colombia vs. Nicaragua, India vs. Indonesia, Vietnam-Arabica vs. Vietnam-Robusta, Vietnam-Arabica vs. Cambodia, and Vietnam-Robusta vs. Cambodia) in various ratios ranging between 100:0–0:100 (original coffee: adulterant coffee; w/w). HPLC-UV/VIS fingerprints were subjected to statistical analysis (PCA, PLS-DA, and PLS regression) and found to be sufficient chemical descriptors to classify coffee by geographical origin (even for nearby countries such as Vietnam and Cambodia), varieties, and degree of roasting (Figure 2). Regarding botanical origin (variety), the differences are mainly based on the relative intensities of the peak signals, as the fingerprint profiles are similar. Additionally, PLS regression could reveal coffee adulteration down to 15% of adulterant coffee (coffee of a different geographical or botanical origin than declared) [1]. All 66 Vietnamese and Cambodian samples, together with half of the Nespresso-type samples, both processed as before, were also analysed by HPLC-FLD to obtain fingerprints that were consequently subjected to PCA and PLS-DA statistical analysis as well [122]. HPLC-FLD fingerprints of only two Vietnamese, one Cambodian, and five Nespresso-type coffee samples were again used to reveal adulteration cases related to different production regions. For this purpose, the same pairs of original coffee and adulterant coffee (Colombia vs. Ethiopia, Colombia vs. Nicaragua, India vs. Indonesia, Vietnam-Arabica vs. Vietnam-Robusta, Vietnam-Arabica vs. Cambodia, and Vietnam-Robusta vs. Cambodia) were compared [123]. From these two papers, the identical conclusions as in the previous work published in 2020 were interpreted.
Figure 2. PLS-DA differentiation of coffee samples based on their geographical origin [1].
Further, both HPLC-UV/VIS and HPLC-FLD fingerprints of only 54 previous samples of Vietnamese and Cambodian coffee, together with 69 samples of chicory, flour (wheat, rice, cornmeal, rye, and oatmeal), and barley, which were subsequently mixed into coffee as adulterant in ratios ranging between 100:0–0:100 (coffee:impurity; w/w), were evaluated using PLS-DA to determine the adulteration level [118]. Various extraction solvents (water, methanol, ethanol, acetonitrile, acetone, and organic-aqueous mixtures containing 20, 50, and 80% of each organic component examined) were tested to obtain the maximum number of signals. The highest extraction capacity was achieved by using H2O:acetonitrile (50:50, v/v) and H2O:methanol (50:50, v/v) for FLD and UV/VIS detection, respectively. Coffee adulterants provided completely different fingerprints than coffee samples, and their amount could be detected down to 15%. Comparing both fingerprint techniques (Figure 3), HPLC-FLD fingerprints did not completely distinguish coffee from barley samples, while all samples were perfectly discriminated by HPLC-UV/VIS fingerprints [118].
Figure 3. PLS-DA classification of the samples using HPLC-UV/VIS (a) and HPLC-FLD (b) fingerprints [118].
A simple HPLC fingerprint method, together with simultaneous determination of selected bioactive compounds, was developed to evaluate the quality of twenty-four C. arabica samples of different geographical origin [125]. About 50 peaks were observed in the fingerprint. However, only thirteen intense peaks with good resolution characterizing the sample were selected. Correlation analysis and PCA analysis proved that the combination of HPLC fingerprint and quantitative analysis can be an effective tool for the evaluation of coffee quality.

4. Conclusions
Figure 4 clearly illustrates the key benefits and drawbacks of targeted and non-targeted analysis. Regarding targeted analysis, it provides very valuable information about the occurrence and concentration of selected (usually significant) analytes in the sample, even without statistical processing of the data obtained. Unfortunately, this qualitative and quantitative determination cannot be performed without the acquisition of frequently expensive analytical standards and the application of any quantitative method requiring additional analyses associated with increased consumption of chemicals. If scholars consider also the time-consuming development of an extraction method suitable for selected analytes (with high recovery), and the long optimization of HPLC separation, which must provide sufficiently separated peaks with good resolution, targeted analysis then represents a relatively time-, financially-, and manually demanding multi-step approach. Although technological progress has made it possible to detect fraudulent practices in coffee by determining specific chemical or biological markers with higher sensitivity than ever before, it can be argued that targeted analysis is unable to reveal all common counterfeiting practices, and thus its application is only limited in this field.
Figure 4. Principal benefits and drawbacks of targeted and non-targeted analysis.
On the other hand, in non-targeted analysis (sample fingerprinting/profiling), the traditional procedure of determining analytes in the sample is skipped because it is not crucial to know which analytes the sample contains, let alone in what quantity. This indicates that scholars do not need any analytical standards for the identification of given peaks, nor for their subsequent quantification by some quantitative method (e.g., calibration curve method, multiple standard addition method, method of direct comparison, etc.). In non-targeted analysis, even the optimization of extraction and separation differs from that one used in standard targeted analysis. In this case, the goal is simply to get as many peaks as possible and thus the richest possible chromatogram. Thanks to the easy and rapid optimization of sample pre-treatment and separation, no preparation of calibration solutions, and no identification and quantification of peaks, it significantly reduces the final costs and time.
References
- Núñez, N.; Collado, X.; Martínez, C.; Saurina, J.; Núñez, O. Authentication of the origin, variety and roasting degree of coffee samples by non-targeted HPLC-UV fingerprinting and chemometrics. Application to the detection and quantitation of adulterated coffee samples. Foods 2020, 9, 378.
- International Coffee Organization (ICO). Total Production by All Exporting Countries. Available online: http://www.ico.org/prices/po-production.pdf (accessed on 20 June 2022).
- Diviš, P.; Pořízka, J.; Kříkala, J. The effect of coffee beans roasting on its chemical composition. Potravinarstvo 2019, 13, 344–350.
- Davis, A.P.; Govaerts, R.; Bridson, D.M.; Stoffelen, P. An annotated taxonomic conspectus of the Genus Coffea (Rubiaceae). Bot. J. Linn. Soc. 2006, 152, 465–512.
- Keidel, A.; von Stetten, D.; Rodrigues, C.; Máguas, C.; Hildebrandt, P. Discrimination of Green Arabica and Robusta coffee beans by raman spectroscopy. J. Agric. Food Chem. 2010, 58, 11187–11192.
- Feria-Morales, A.M. Examining the case of green coffee to illustrate the limitations of grading systems/expert tasters in sensory evaluation for quality control. Food Qual. Prefer. 2002, 13, 355–367.
- Van der Vossen, H.; Bertrand, B.; Charrier, A. Next generation variety development for sustainable production of arabica coffee (Coffea arabica L.): A review. Euphytica 2015, 204, 243–256.
- Wongsa, P.; Khampa, N.; Horadee, S.; Chaiwarith, J.; Rattanapanone, N. Quality and bioactive compounds of blends of Arabica and Robusta spray-dried coffee. Food Chem. 2019, 283, 579–587.
- Clarke, R.; Macrae, J.R. (Eds.) Coffee Volume 1: Chemistry, 1st ed.; Springer: Dordrecht, The Netherlands, 2012.
- Toledo, P.; Pezza, L.; Pezza, H.R.; Toci, A.T. Relationship between the different aspects related to coffee quality and their volatile compounds. Compr. Rev. Food Sci. Food Saf. 2016, 15, 705–719.
- Bobková, A.; Jakabová, S.; Belej, Ľ.; Jurčaga, L.; Čapla, J.; Bobko, M.; Demianová, A. Analysis of caffeine and chlorogenic acids content regarding the preparation method of coffee beverage. Int. J. Food Eng. 2021, 17, 403–410.
- Esteban-Díez, I.; González-Sáiz, J.M.; Sáenz-González, C.; Pizarro, C. Coffee varietal differentiation based on near infrared spectroscopy. Talanta 2007, 71, 221–229.
- Jeszka-Skowron, M.; Zgoła-Grześkowiak, A.; Grześkowiak, T. Analytical methods applied for the characterization and the determination of bioactive compounds in coffee. Eur. Food Res. Technol. 2015, 240, 19–31.
- Prihadi, A.R.; Maimulyanti, A. Chemical Compounds of Coffee Ground and Spent Coffee Ground for Pharmaceutical Products. Pharm. Biomed. Sci. J. 2020, 2, 1–4.
- Butt, M.S.; Sultan, M.T. Coffee and its consumption: Benefits and risks. Crit. Rev. Food Sci. Nutr. 2011, 51, 363–373.
- George, S.E.; Ramalakshmi, K.; Mohan Rao, L.J. A perception on health benefits of coffee. Crit. Rev. Food Sci. Nutr. 2008, 48, 464–486.
- Prediger, R.D.S. Effects of caffeine in Parkinson’s disease: From neuroprotection to the management of motor and non-motor symptoms. J. Alzheimers Dis. 2010, 20, 205–220.
- Kwon, S.-H.; Lee, H.-K.; Kim, J.-A.; Hong, S.-I.; Kim, H.-C.; Jo, T.-H.; Park, Y.-I.; Lee, C.-K.; Kim, Y.-B.; Lee, S.-Y.; et al. Neuroprotective effects of chlorogenic acid on scopolamine-induced amnesia via anti-acetylcholinesterase and anti-oxidative activities in mice. Eur. J. Pharmacol. 2010, 649, 210–217.
- Chu, Y.-F.; Chang, W.-H.; Black, R.M.; Liu, J.-R.; Sompol, P.; Chen, Y.; Wei, H.; Zhao, Q.; Cheng, I.H. Crude caffeine reduces memory impairment and amyloid β1-42 levels in an Alzheimer’s mouse model. Food Chem. 2012, 135, 2095–2102.
- Arendash, G.W.; Mori, T.; Cao, C.; Mamcarz, M.; Runfeldt, M.; Dickson, A.; Rezai-Zadeh, K.; Tan, J.; Citron, B.A.; Lin, X.; et al. Caffeine reverses cognitive impairment and decreases brain amyloid-β levels in aged alzheimer’s disease mice. J. Alzheimers Dis. 2009, 17, 661–680.
- Arendash, G.W.; Cao, C. Caffeine and coffee as therapeutics against Alzheimer’s Disease. J. Alzheimers Dis. 2010, 20, S117–S126.
- Gokcen, B.B.; Sanlier, N. Coffee consumption and disease correlations. Crit. Rev. Food Sci. Nutr. 2019, 59, 336–348.
- Johnson, S.; Koh, W.-P.; Wang, R.; Govindarajan, S.; Yu, M.C.; Yuan, J.-M. Coffee consumption and reduced risk of hepatocellular carcinoma: Fndings from the Singapore Chinese Health Study. Cancer Causes Control 2011, 22, 503–510.
- Esquivel, P.; Jimenez, V.M. Functional properties of coffee and coffee by-products. Food Res. Int. 2012, 46, 488–495.
- Ludwig, I.A.; Clifford, M.N.; Lean, M.E.J.; Ashihara, H.; Crozier, A. Coffee: Biochemistry and potential impact on health. Food Funct. 2014, 5, 1695–1717.
- Muchtaridi, M.; Lestari, D.; Ikram, N.K.K.; Gazzali, A.M.; Hariono, M.; Wahab, H.A. Decaffeination and Neuraminidase Inhibitory Activity of Arabica Green Coffee (Coffea arabica) Beans: Chlorogenic Acid as a Potential Bioactive Compound. Molecules 2021, 26, 3402.
- Bułdak, R.J.; Hejmo, T.; Osowski, M.; Bułdak, Ł.; Kukla, M.; Polaniak, R.; Birkner, E. The impact of coffee and its selected bioactive compounds on the development and progression of colorectal cancer in vivo and in vitro. Molecules 2018, 23, 3309.
- Farah, A.; Donangelo, C.M. Phenolic compounds in coffee. Braz. J. Plant Physiol. 2006, 18, 23–36.
- Jeszka-Skowron, M.; Stanisz, E.; De Peña, M.P. Relationship between antioxidant capacity, chlorogenic acids and elemental composition of green coffee. LWT 2016, 73, 243–250.
- Yu, X.; Bao, Z.; Zou, J.; Dong, J. Coffee consumption and risk of cancers: A meta-analysis of cohort studies. BMC Cancer 2011, 11, 96–106.
- Hayakawa, S.; Ohishi, T.; Miyoshi, N.; Oishi, Y.; Nakamura, Y.; Isemura, M. Anti-cancer effects of green tea epigallocatchin-3-gallate and coffee chlorogenic acid. Molecules 2020, 25, 4553.
- Regazzoni, L.; Saligari, F.; Marinello, C.; Rossoni, G.; Aldini, G.; Carini, M.; Orioli, M. Coffee silver skin as a source of polyphenols: High resolution mass spectrometric profiling of components and antioxidant activity. J. Funct. Foods 2016, 20, 472–485.
- Cano-Marquina, A.; Tarín, J.J.; Cano, A. The impact of coffee on health. Maturitas 2013, 75, 7–21.
- Nieber, K. The impact of coffee on health. Planta Med. 2017, 83, 1256–1263.
- Lai, G.Y.; Weinstein, S.J.; Albanes, D.; Taylor, P.R.; McGlynn, K.A.; Virtamo, J.; Sinha, R.; Freedman, N.D. The association of coffee intake with liver cancer incidence and chronic liver disease mortality in male smokers. Br. J. Cancer 2013, 109, 1344–1351.
- Herawati, D.; Giriwono, P.E.; Dewi, F.N.A.; Kashiwagi, T.; Andarwulan, N. Three major compounds showing significant antioxidative, α-glucosidase inhibition, and antiglycation activities in Robusta coffee brew. Int. J. Food Prop. 2019, 22, 994–1010.
- Ohishi, T.; Fukutomi, R.; Shoji, Y.; Goto, S.; Isemura, M. The beneficial effects of principal polyphenols from green tea, coffee, wine, and curry on obesity. Molecules 2021, 26, 453.
- Pinheiro, P.F.; Pinheiro, C.A.; Osório, V.M.; Pereira, L.L. Chemical Constituents of Coffee. In Quality Determinants in Coffee Production; Food Engineering Series; Louzada Pereira, L., Rizzo Moreira, T., Eds.; Springer: Cham, Switzerland, 2021; pp. 209–254.
- Alcantara, G.M.R.N.; Dresch, D.; Melchert, W.R. Use of non-volatile compounds for the classification of specialty and traditional Brazilian coffees using principal component analysis. Food Chem. 2021, 360, 130088.
- European Commission. Knowledge Centre for Food Fraud and Quality. Available online: https://knowledge4policy.ec.europa.eu/food-fraud-quality/topic/food-fraud_en (accessed on 20 June 2022).
- Ferreira, T.; Galluzzi, L.; de Paulis, T.; Farah, A. Three centuries on the science of coffee authenticity control. Food Res. Int. 2021, 149, 110690.
- De Lange, E. Draft Report on the Food Crisis, Fraud in the Food Chain and Control Thereof (2013/2091 (INI)); The European Parliament, Committee on the Environment, Public Health and Food Safety: Brussels, Belgium, 2013; Available online: https://www.europarl.europa.eu/doceo/document/ENVI-PR-519759_EN.pdf?redirect (accessed on 20 June 2022).
- Alves, R.C.; Casal, S.; Alves, M.R.; Oliveira, M.B. Discrimination between Arabica and robusta coffee species on the basis of their tocopherol profiles. Food Chem. 2009, 114, 295–299.
- Bertrand, B.; Villarreal, D.; Laffargue, A.; Posada, H.; Lashermes, P.; Dussert, S. Comparison of the effectiveness of fatty acids, chlorogenic acids, and elements for the chemometric discrimination of coffee (Coffea arabica L.) varieties and growing origins. J. Agric. Food Chem. 2008, 56, 2273–2280.
- González, A.G.; Pablos, F.; Martín, M.J.; Leon-Camacho, M.; Valdenebro, M.S. HPLC analysis of tocopherols and triglycerides in coffee and their use as authentication parameters. Food Chem. 2001, 73, 93–101.
- Górnaś, P.; Siger, A.; Pugajeva, I.; Czubinski, J.; Waśkiewicz, A.; Polewski, K. New insights regarding tocopherols in Arabica and Robusta species coffee beans: RP-UPLC-ESI/MSn and NP-HPLC/FLD study. J. Food Compos. Anal. 2014, 36, 117–123.
- Cagliani, L.R.; Pellegrino, G.; Giugno, G.; Consonni, R. Quantifcation of Coffea arabica and Coffea canephora var. robusta in roasted and ground coffee blends. Talanta 2013, 106, 169–173.
- Dias, R.C.E.; Benassi, M.D.T. Discrimination between Arabica and Robusta coffees using hydrosoluble compounds: Is the efficiency of the parameters dependent on the roast degree? Beverages 2015, 1, 127–139.
- Casal, S.; Oliveira, M.B.P.P.; Alves, M.R.; Ferreira, M.A. Discriminate analysis of roasted coffee varieties for trigonelline, nicotinic acid, and caffeine content. J. Agric. Food Chem. 2000, 48, 3420–3424.
- Fintello, C.; Forzato, C.; Gasparini, A.; Mammi, S.; Navarini, L.; Schievano, E. NMR quantification of 16-O-methylcafestol and kahweol in Coffea canephora var. robusta beans from different geographical origins. Food Control 2017, 75, 62–69.
- De Luca, S.; Ciotoli, E.; Biancolillo, A.; Bucci, R.; Magrì, A.D.; Marini, F. Simultaneous quantification of caffeine and chlorogenic acid in coffee green beans and varietal classification of the samples by HPLC-DAD coupled with chemometrics. Environ. Sci. Pollut. Res. Int. 2018, 25, 28748–28759.
- Casal, S.; Alves, M.R.; Mendes, E.; Oliveira, M.B.P.P.; Ferreira, M.A. Discrimination between Arabica and Robusta coffee species on the basis of their amino acid enantiomers. J. Agric. Food Chem. 2003, 51, 6495–6501.
- Martín, M.J.; Pablos, F.; Gonzalez, A.G.; Valdenebro, M.S.; Leon-Camacho, M. Fatty acid profiles as discriminant parameters for coffee varieties differentiation. Talanta 2001, 54, 291–297.
- Rui Alves, M.; Casal, S.; Oliveira, M.B.P.P.; Ferreira, M.A. Contribution of FA profile obtained by high-resolution GC/chemometric techniques to the authenticity of green and roasted coffee varieties. J. Am. Oil Chem. Soc. 2003, 80, 511–517.
- Romano, R.; Santini, A.; Le Grottaglie, L.; Manzo, N.; Visconti, A.; Ritieni, A. Identification markers based on fatty acid composition to differentiate between roasted Arabica and Canephora (Robusta) coffee varieties in mixtures. J. Food Comp. Anal. 2014, 35, 1–9.
- Combes, M.C.; Joët, T.; Lashermes, P. Development of a rapid and efficient DNA-based method to detect and quantify adulterations in coffee (Arabica versus Robusta). Food Control 2018, 88, 198–206.
- Monakhova, Y.B.; Ruge, W.; Kuballa, T.; Ilse, M.; Winkelmann, O.; Diehl, B.; Thomas, F.; Lachenmeier, D.W. Rapid approach to identify the presence of Arabica and Robusta species in coffee using 1H NMR spectroscopy. Food Chem. 2015, 182, 178–184.
- Casal, S.; Mendes, E.; Alves, M.R.; Alves, R.C.; Beatriz, M.; Oliveira, P.P.; Ferreira, M.A. Free and conjugated biogenic amines in green and roasted coffee beans. J. Agric. Food Chem. 2004, 52, 6188–6192.
- Martín, M.J.; Pablos, F.; González, A.G. Discrimination between Arabica and Robusta green coffee varieties according to their chemical composition. Talanta 1998, 46, 1259–1264.
- Antoine, J.M.R.; Hoo Fung, L.A.; Grant, C.N. Geographic determination of the growing origins of Jamaican and international coffee using instrumental neutron activation analysis and other methods. J. Radioanal. Nucl. Chem. 2016, 309, 525–534.
- Anderson, K.A.; Smith, B.W. Chemical profiling to differentiate geographic growing origins of coffee. J. Agric. Food Chem. 2002, 50, 2068–2075.
- Mehari, B.; Redi-Abshiro, M.; Chandravanshi, B.S.; Combrinck, S.; McCrindle, R. Characterization of the Cultivation Region of Ethiopian Coffee by Elemental Analysis. Anal. Lett. 2016, 49, 2474–2489.
- Mendes, G.D.A.; de Oliveira, M.A.L.; Rodarte, M.P.; de Carvalho dos Anjos, V.; Bell, M.J.V. Origin geographical classification of green coffee beans (Coffea arabica L.) produced in different regions of the Minas Gerais state by FT-MIR and chemometric. Curr. Res. Food Sci. 2022, 5, 298–305.
- Mullen, W.; Nemzer, B.; Stalmach, A.; Ali, S.; Combet, E. Polyphenolic and hydroxycinnamate contents of whole coffee fruits from China, India, and Mexico. J. Agric. Food Chem. 2013, 61, 5298–5309.
- Mehari, B.; Chandravanshi, B.S.; Redi-Abshiro, M.; Combrinck, S.; McCrindle, R.; Atlabachew, M. Polyphenol contents of green coffee beans from different regions of Ethiopia. Int. J. Food Prop. 2021, 24, 17–27.
- Alonso-Salces, R.M.; Serra, F.; Reniero, F.; Héberger, K. Botanical and geographical characterization of green coffee (Coffea arabica and Coffea canephora): Chemometric evaluation of phenolic and methylxanthine contents. J. Agric. Food Chem. 2009, 57, 4224–4235.
- Consonni, R.; Cagliani, L.R.; Cogliati, C. NMR based geographical characterization of roasted coffee. Talanta 2012, 88, 420–426.
- Marquetti, I.; Link, J.V.; Lemes, A.L.G.; dos Santos Scholz, M.B.; Valderrama, P.; Bona, E. Partial least square with discriminant analysis and near infrared spectroscopy for evaluation of geographic and genotypic origin of Arabica coffee. Comput. Electron. Agric. 2016, 121, 313–319.
- Yener, S.; Romano, A.; Cappellin, L.; Granitto, P.M.; Aprea, E.; Navarini, L.; Märk, T.D.; Gasperi, F.; Biasioli, F. Tracing coffee origin by direct injection headspace analysis with PTR/SRI-MS. Food Res. Int. 2015, 69, 235–243.
- Pauli, E.D.; Barbieri, F.; Garcia, P.S.; Madeira, T.B.; Acquaro, V.R.; Scarminio, I.S.; da Camara, C.A.P.; Nixdorf, S.L. Detection of ground roasted coffee adulteration with roasted soybean and wheat. Food Res. Int. 2014, 61, 112–119.
- Nogueira, T.; do Lago, C.L. Detection of adulterations in processed coffee with cereals and coffee husks using capillary zone electrophoresis. J. Sep. Sci. 2009, 32, 3507–3511.
- Domingues, D.S.; Pauli, E.D.; de Abreu, J.E.M.; Massura, F.W.; Cristiano, V.; Santos, M.J.; Nixdorf, S.L. Detection of roasted and ground coffee Adulteration by HPLC and by amperometric and by post-column derivatization UV-Vis detection. Food Chem. 2014, 146, 353–362.
- Cai, T.; Ting, H.; Jin-Lan, Z. Novel identification strategy for ground coffee adulteration based on UPLC-HRMS oligosaccharide profiling. Food Chem. 2016, 190, 1046–1049.
- Daniel, D.; Lopes, F.S.; dos Santos, V.B.; do Lago, C.L. Detection of coffee adulteration with soybean and corn by capillary electrophoresis-tandem mass spectrometry. Food Chem. 2018, 243, 305–310.
- Uncu, A.T.; Uncu, A.O. Plastid trnH-psbA intergenic spacer serves as a PCRbased marker to detect common grain adulterants of coffee (Coffea arabica L.). Food Control 2018, 91, 32–39.
- De Morais, T.C.B.; Rodrigues, D.R.; de Carvalho Polari Souto, U.T.; Lemos, S.G. A Simple voltammetric electronic tongue for the analysis of coffee adulterations. Food Chem. 2019, 273, 31–38.
- Ferreira, T.; Farah, A.; Oliveira, T.C.; Lima, I.S.; Vitório, F.; Oliveira, E.M.M. Using real-time PCR as a tool for monitoring the authenticity of commercial coffees. Food Chem. 2016, 199, 433–438.
- Toci, A.T.; Farah, A.; Pezza, H.R.; Pezza, L. Coffee adulteration: More than two decades of research. Crit. Rev. Anal. Chem. 2016, 46, 83–92.
- Sezer, B.; Apaydin, H.; Bilge, G.; Boyaci, I.H. Coffee arabica adulteration: Detection of wheat, corn and chickpea. Food Chem. 2018, 264, 142–148.
- Arrieta, A.A.; Arrieta, P.L.; Mendoza, J.M. Analysis of coffee adulterated with roasted corn and roasted soybean using voltammetric electronic tongue. Acta Sci. Pol. Technol. Aliment. 2019, 18, 35–41.
- Toci, A.T.; de Moura Ribeiro, M.V.; de Toledo, P.R.A.B.; Boralle, N.; Pezza, H.R.; Pezza, L. Fingerprint and authenticity roasted coffees by 1H-NMR: The Brazilian coffee case. Food Sci. Biotechnol. 2018, 27, 19–26.
- Burns, D.T.; Walker, M.J. Critical Review of Analytical and Bioanalytical Verification of the Authenticity of Coffee. J. AOAC Int. 2020, 103, 283–294.
- Barbosa, R.M.; Batisa, B.L.; Varrique, R.M.; Coelho, V.A.; Campiglia, A.D.; Barbosa, F., Jr. The use of advanced chemometric techniques and trace element levels for controlling the authenticity of organic coffee. Food Res. Int. 2014, 61, 246–251.
- Carter, J.F. Food Forensics: Stable Isotopes as a Guide to Authenticity and Origin, 1st ed.; Carter, J.F., Chesson, L.A., Eds.; CRC Press: Boca Raton, FL, USA, 2017; pp. 169–173.
- Muñiz-Valencia, R.; Jurado, J.M.; Ceballos-Magña, S.G.; Alcázar, A.; Hernández-Díaz, J. Characterization of Mexican coffee according to mineral contents by means of multilayer perceptrons artificial neural networks. J. Food Comp. Anal. 2014, 34, 7–11.
- Oliveira, M.; Ramos, S.; Delerue-Matos, C.; Morais, S. Expresso beverages of pure origin coffee: Mineral characterization, contribution for mineral intake and geographical origin discrimination. Food Chem. 2015, 177, 330–338.
- Valentin, J.L.; Watling, R.J. Provenance establishment of coffee using solution ICP-MS and ICP-AES. Food Chem. 2013, 141, 98–104.
- Gunning, Y.; Defernez, M.; Watson, A.D.; Beadman, N.; Colquhoun, I.J.; Le Gall, G.; Philo, M.; Garwood, H.; Williamson, D.; Davis, A.P.; et al. 16-O-methylcafestol is present in ground roast Arabica coffees: Implications for authenticity testing. Food Chem. 2018, 248, 52–60.
- Schievano, E.; Finotello, C.; de Angelis, E.; Mammi, S.; Navarini, L. Rapid Authentication of Coffee Blends and Quantification of 16-OMethylcafestol in Roasted Coffee Beans by Nuclear Magnetic Resonance. J. Agric. Food Chem. 2014, 62, 12309–12314.
- Tolessa, K.; Rademaker, M.; Baets, B.D.; Boeckx, P. Prediction of specialty coffee cup quality based on near infrared spectra of green coffee beans. Talanta 2016, 150, 367–374.
- Bertone, E.; Venturelo, A.; Giraudo, A.; Pellegrino, G.; Geobaldo, F. Simultaneous determination by NIR spectroscopy of the roasting degree and Arabic/Robusta ratio in roasted and ground coffee. Food Control 2016, 59, 683–689.
- Wermelinger, T.; D’Ambrosio, L.; Klopprogge, B.; Yeretzian, C. Quantification of the Robusta fraction in a coffee blend via Raman spectroscopy: Proof of principle. J. Agric. Food Chem. 2011, 59, 9074–9079.
- Mees, C.; Souard, F.; Delporte, C.; Deconinck, E.; Stoffelen, P.; Stévigny, C.; Kauffmann, J.-M.; De Braekeleer, K. Identification of coffee leaves using FT-NIR spectroscopy and SIMCA. Talanta 2018, 177, 4–11.
- Martellossi, C.; Taylor, E.J.; Lee, D.; Graziosi, G.; Donni, P. DNA Extraction and Analysis from Processed Coffee Beans. J. Agric. Food Chem. 2005, 53, 8432–8438.
- De Carvalho Martins, V.; de Oliveira Godoy, R.L.; Gouvêa, A.C.M.S.; de Araujo Santiago, M.C.P.; Borguini, R.G.; de Oliveira Braga, E.C.; Pacheco, S.; do Nascimento, L.D.S.D.M. Fraud investigation in commercial coffee by chromatography. Food Qual. Saf. 2018, 2, 121–133.
- Klikarová, J.; Řeháková, B.; Česlová, L. Evaluation of regular and decaffeinated (un)roasted coffee beans using HPLC and multivariate statistical methods. J. Food Compos. Anal. 2022, 114, 104841.
- Wang, X.; Lim, L.-T.; Fu, Y. Review of analytical methods to detect adulteration in coffee. J. AOAC Int. 2020, 103, 295–305.
- Cheah, W.L.; Fang, M. HPLC-based chemometric analysis for coffee adulteration. Foods 2020, 9, 880.
- Silva, A.R.; Santos, J.R.; Almeida, P.J.; Rodrigues, J.A. Screening of Antioxidant Compounds in Green Coffee by Low Pressure Chromatography with Amperometric Detection. Food Anal. Methods 2021, 14, 2175–2185.
- Perez, M.; Domínguez-López, I.; López-Yerena, A.; Vallverdú Queralt, A. Current strategies to guarantee the authenticity of coffee. Crit. Rev. Food Sci. Nutr. 2021, 61, 1–16.
- Putri, S.P.; Irifune, T.; Fukusaki, E. GC/MS based metabolite profiling of Indonesian specialty coffee from different species and geographical origin. Metabolomics 2019, 15, 1–11.
- Dos Santos, H.D.; Boffo, E.F. Coffee beyond the cup: Analytical techniques used in chemical composition research—A review. Eur. Food Res. Technol. 2021, 247, 749–775.
- Demianová, A.; Bobková, A.; Jurčaga, L.; Bobko, M.; Belej, Ľ.; Árvay, J. Determination of Geographical Origin of Green and Roasted Coffee Based on Selected Chemical Parameters. J. Microbiol. Biotechnol. Food Sci. 2021, 10, 706–710.
- Angelino, D.; Tassotti, M.; Brighenti, F.; Del Rio, D.; Mena, P. Niacin, alkaloids and (poly)phenolic compounds in the most widespread Italian capsule-brewed coffees. Sci. Rep. 2018, 8, 17874.
- Schouten, M.A.; Tappi, S.; Angeloni, S.; Cortese, M.; Caprioli, G.; Vittori, S.; Romani, S. Acrylamide formation and antioxidant activity in coffee during roasting—A systematic study. Food Chem. 2021, 343, 128514.
- Miłek, M.; Młodecki, Ł.; Dżugan, M. Caffeine Content and Antioxidant Activity of Various Brews of Specialty Grade Coffee. Acta Sci. Pol. Technol. Aliment. 2021, 20, 179–188.
- Gutiérrez Ortiz, A.L.; Berti, F.; Solano Sánchez, W.; Navarini, L.; Colomban, S.; Crisafulli, P.; Forzato, C. Distribution of p-coumaroylquinic acids in commercial Coffea spp. of different geographical origin and in other wild coffee species. Food Chem. 2019, 286, 459–466.
- Atlabachew, M.; Abebe, A.; Wubieneh, T.A.; Habtemariam, T.Y. Rapid and simultaneous determination of trigonelline, caffeine, and chlorogenic acid in green coffee bean extract. Food Sci. Nutr. 2021, 9, 5028–5035.
- Macheiner, L.; Schmidt, A.; Mayer, H.K. A novel basis for monitoring the coffee roasting process: Isomerization reactions of 3-caffeoylquinic and 4-caffeoylquinic acids. LWT 2021, 152, 112343.
- Faria, W.C.S.; Petry, F.C.; De Barros, W.M.; de Melo Moura, W.; da Conceição, E.C.; Bragagnolo, N. Effect of solid–liquid extraction on the bioactive content and reducing capacity of the green coffee fruit. Sep. Sci. Technol. 2020, 56, 1211–1224.
- Montenegro, J.; dos Santos, L.S.; de Souza, R.G.G.; Lima, L.G.B.; Mattos, D.S.; Viana, B.P.P.B.; da Fonseca Bastos, A.C.S.; Muzzi, L.; Conte-Júnior, C.A.; Gimba, E.R.P.; et al. Bioactive compounds, antioxidant activity and antiproliferative effects in prostate cancer cells of green and roasted coffee extracts obtained by microwave-assisted extraction (MAE). Food Res. Int. 2021, 140, 110014.
- Brzezicha, J.; Błazejewicz, D.; Brzezinska, J.; Grembecka, M. Green coffee VS dietary supplements: A comparative analysis of bioactive compounds and antioxidant activity. Food Chem. Toxicol. 2021, 155, 112377.
- Ahmad, I.; Syakfanaya, A.M.; Azminah, A.; Saputri, F.C.; Mun’im, A. Optimization of betaine-sorbitol natural deep eutectic solvent-based ultrasound-assisted extraction and pancreatic lipase inhibitory activity of chlorogenic acid and caffeine content from robusta green coffee beans. Heliyon 2021, 7, e07702.
- Budryn, G.; Nebesny, E.; Podsędek, A.; Żyżelewicz, D.; Materska, M.; Jankowski, S.; Janda, B. Effect of different extraction methods on the recovery of chlorogenic acids, caffeine and Maillard reaction products in coffee beans. Eur. Food Res. Technol. 2009, 228, 913–922.
- Ludwig, I.A.; Sanchez, L.; Caemmerer, B.; Kroh, L.W.; De Peña, M.P.; Cid, C. Extraction of coffee antioxidants: Impact of brewing time and method. Food Res. Int. 2012, 48, 57–64.
- Rothwell, J.; Loftfeld, E.; Wedekind, R.; Freedman, N.; Kambanis, C.; Scalbert, A.; Sinha, R. A metabolomic study of the variability of the chemical composition of commonly consumed coffee brews. Metabolites 2019, 9, 17.
- De Luca, S.; De Filippis, M.; Bucci, R.; Magrì, A.D.; Magrì, A.L.; Marini, F. Characterization of the effects of different roasting conditions on coffee samples of different geographical origins by HPLC-DAD, NIR and chemometrics. Microchem. J. 2016, 129, 348–361.
- Núñez, N.; Saurina, J.; Núñez, O. Authenticity Assessment and Fraud Quantitation of Coffee Adulterated with Chicory, Barley, and Flours by Untargeted HPLC-UV-FLD Fingerprinting and Chemometrics. Foods 2021, 10, 840.
- Iwasa, K.; Setoyama, D.; Shimizu, H.; Seta, H.; Fujimura, Y.; Miura, D.; Wariishi, H.; Nagai, C.; Nakahara, K. Identification of 3-methylbutanoyl glycosides in green Coffea arabica beans as causative determinants for the quality of coffee flavors. J. Agric. Food Chem. 2015, 63, 3742–3751.
- Sittipod, S.; Schwartz, E.; Paravisini, L.; Peterson, D.G. Identification of flavor modulating compounds that positively impact coffee quality. Food Chem. 2019, 301, 125250.
- Xu, L.; Lao, F.; Xu, Z.; Wang, X.; Chen, F.; Liao, X.; Chen, A.; Yang, S. Use of liquid chromatography quadrupole time-of-flight mass spectrometry and metabolomic approach to discriminate coffee brewed by different methods. Food Chem. 2019, 286, 106–112.
- Núñez, N.; Martínez, C.; Saurina, J.; Núñez, O. High-performance liquid chromatography with fluorescence detection fingerprints as chemical descriptors to authenticate the origin, variety and roasting degree of coffee by multivariate chemometric methods. J. Sci. Food Agric. 2021, 101, 65–73.
- Núñez, N.; Saurina, J.; Núñez, O. Non-targeted HPLC-FLD fingerprinting for the detection and quantitation of adulterated coffee samples by chemometrics. Food Control 2021, 124, 107912.
- Núñez, N.; Pons, J.; Saurina, J.; Núñez, O. Non-targeted high-performance liquid chromatography with ultraviolet and fluorescence detection fingerprinting for the classification, authentication, and fraud quantitation of instant coffee and chicory by multivariate chemometric methods. LWT 2021, 147, 111646.
- Viapiana, A.; Maggi, F.; Kaszuba, M.; Konieczynski, P.; Wesolowski, M. Quality assessment of Coffea arabica commercial samples. Nat. Prod. Res. 2020, 34, 3154–3157.
- Moreira, I.; Scarminio, I.S. Chemometric discrimination of genetically modified Coffea arabica cultivars using spectroscopic and chromatographic fingerprints. Talanta 2013, 107, 416–422.
- Guizellini, F.C.; Marcheafave, G.G.; Rakocevic, M.; Bruns, R.E.; Scarminio, I.S.; Soares, P.K. PARAFAC HPLC-DAD metabolomic fingerprint investigation of reference and crossed coffees. Food Res. Int. 2018, 113, 9–17.
- Bertrand, B.; Boulanger, R.; Dussert, S.; Ribeyre, F.; Berthiot, L.; Descroix, F.; Joët, T. Climatic factors directly impact the volatile organic compound fingerprint in green Arabica coffee bean as well as coffee beverage quality. Food Chem. 2012, 135, 2575–2583.
- Abdelwareth, A.; Zayed, A.; Farag, M.A. Chemometrics-based aroma profiling for revealing origin, roasting indices, and brewing method in coffee seeds and its commercial blends in the Middle East. Food Chem. 2021, 349, 129162.
- Marcheafave, G.G.; Pauli, E.D.; Tormena, C.D.; Ortiz, M.C.V.; de Almeida, A.G.; Rakocevic, M.; Bruns, R.E.; Scarminio, I.S. Factorial design fingerprint discrimination of Coffea arabica beans under elevated carbon dioxide and limited water conditions. Talanta 2020, 209, 120591.
More
Information
Subjects:
Chemistry, Applied
Contributors
MDPI registered users' name will be linked to their SciProfiles pages. To register with us, please refer to https://encyclopedia.pub/register
:
View Times:
2.2K
Revisions:
3 times
(View History)
Update Date:
14 Nov 2022
Table of Contents


Notice
You are not a member of the advisory board for this topic. If you want to update advisory board member profile, please contact office@encyclopedia.pub.
OK
Confirm
Only members of the Encyclopedia advisory board for this topic are allowed to note entries. Would you like to become an advisory board member of the Encyclopedia?
Yes
No
${ textCharacter }/${ maxCharacter }
Submit
Cancel
Back
Comments
${ item }
|
${ item.createdUser.fullName }
${ item.createdAt }
${ item.vote }
${ item.reply }
Delete
${ reply.createdUser.fullName }
${ reply.createdAt }
${ reply.vote }
Delete
There is no reply to this comment~
${ item.replyTextCharacter }/${ item.replyMaxCharacter }
Submit
Cancel
More
No more~
There is no comment~
${ textCharacter }/${ maxCharacter }
Submit
Cancel
${ selectedItem.replyTextCharacter }/${ selectedItem.replyMaxCharacter }
Submit
Cancel
Confirm
Are you sure to Delete?
Yes
No