Coffee is a very popular beverage worldwide. However, its composition and characteristics are affected by a number of factors, such as geographical and botanical origin, harvesting and roasting conditions, and brewing method used. As coffee consumption rises, the demands on its high quality and authenticity naturally grows as well. Unfortunately, at the same time, various tricks of coffee adulteration occur more frequently, with the intention of quick economic profit. Many analytical methods have already been developed to verify the coffee authenticity, in which the high-performance liquid chromatography (HPLC) plays a crucial role, especially thanks to its high selectivity and sensitivity. Thus, this review summarizes the results of targeted and non-targeted HPLC analysis of coffee-based products over the last 10 years.
- coffee
- targeted analysis
- non-targeted fingerprint
- HPLC
1. Introduction
2. Coffee Adulteration
3. Analysis of Antioxidants in Coffee Products Using HPLC
3.1. Sample Preparation
3.2. Targeted Analysis
4.2. Targeted Analysis
HPLC with spectrophotometric detection (HPLC-UV/VIS), combined with multivariate data treatment, was used to distinguish between specialty and traditional coffee beans in the study by Alcantara et al. [39]. Using PCA, all seventeen samples were very successfully divided into two groups (special versus traditional coffee) according to the quantity of caffeine, chlorogenic, nicotinic, and caffeic acids. This recognition of samples is useful for consumer protection because traditional coffees are of lower quality and, therefore, these can be purchased more cheaply. The main difference was the number and amounts of compounds that were responsible for the organoleptic properties of coffee. Traditional coffees, usually representing blends of Arabica and Robusta, contained higher caffeine and lower polyphenol contents than specialty coffees, which are typically composed of entirely 100% Arabica and roasted to a lower degree, resulting in less degradation of biologically active substances and, consequently, less loss of sensory properties. The assessment and the comparison of antioxidant potential and content of selected biologically active substances (caffeine and coumaric, ferulic, caffeic, and chlorogenic acids) between green coffee samples and food supplements, based on green coffee extracts, was the aim of the work of Brzezicha et al. [112]. In fact, food supplements are not subject to any quality control or analytical verification of their composition before they are placed on the market. There are not even uniform procedures for verifying their authenticity. For this reason, many questions arise about their quality, efficacy, and safety, as well as whether a supplement or a food is a better source of biologically active substances. Brzezicha et al. [112] ascertained that green coffee samples have comparable or even higher antioxidant properties than dietary supplements. The amount of 5-CafQA in food supplements was very diverse (0.33–329 mg/g) compared to green coffee samples (32.7–47.6 mg/g). Moreover, the green coffee samples contained lower levels of caffeine. The scholarauthors found discrepancies between the determined and the manufacturer’s declared values (the amount of chlorogenic acid was in all cases below the declared value and, conversely, the amount of caffeine was higher in some samples than indicated on the packaging). The quality of food supplements could therefore be summarized as unsatisfactory.3.3. Non-Targeted Analysis

4. Conclusions
References
- Núñez, N.; Collado, X.; Martínez, C.; Saurina, J.; Núñez, O. Authentication of the origin, variety and roasting degree of coffee samples by non-targeted HPLC-UV fingerprinting and chemometrics. Application to the detection and quantitation of adulterated coffee samples. Foods 2020, 9, 378.
- International Coffee Organization (ICO). Total Production by All Exporting Countries. Available online: http://www.ico.org/prices/po-production.pdf (accessed on 20 June 2022).
- Diviš, P.; Pořízka, J.; Kříkala, J. The effect of coffee beans roasting on its chemical composition. Potravinarstvo 2019, 13, 344–350.
- Davis, A.P.; Govaerts, R.; Bridson, D.M.; Stoffelen, P. An annotated taxonomic conspectus of the Genus Coffea (Rubiaceae). Bot. J. Linn. Soc. 2006, 152, 465–512.
- Keidel, A.; von Stetten, D.; Rodrigues, C.; Máguas, C.; Hildebrandt, P. Discrimination of Green Arabica and Robusta coffee beans by raman spectroscopy. J. Agric. Food Chem. 2010, 58, 11187–11192.
- Feria-Morales, A.M. Examining the case of green coffee to illustrate the limitations of grading systems/expert tasters in sensory evaluation for quality control. Food Qual. Prefer. 2002, 13, 355–367.
- Van der Vossen, H.; Bertrand, B.; Charrier, A. Next generation variety development for sustainable production of arabica coffee (Coffea arabica L.): A review. Euphytica 2015, 204, 243–256.
- Wongsa, P.; Khampa, N.; Horadee, S.; Chaiwarith, J.; Rattanapanone, N. Quality and bioactive compounds of blends of Arabica and Robusta spray-dried coffee. Food Chem. 2019, 283, 579–587.
- Clarke, R.; Macrae, J.R. (Eds.) Coffee Volume 1: Chemistry, 1st ed.; Springer: Dordrecht, The Netherlands, 2012.
- Toledo, P.; Pezza, L.; Pezza, H.R.; Toci, A.T. Relationship between the different aspects related to coffee quality and their volatile compounds. Compr. Rev. Food Sci. Food Saf. 2016, 15, 705–719.
- Bobková, A.; Jakabová, S.; Belej, Ľ.; Jurčaga, L.; Čapla, J.; Bobko, M.; Demianová, A. Analysis of caffeine and chlorogenic acids content regarding the preparation method of coffee beverage. Int. J. Food Eng. 2021, 17, 403–410.
- Esteban-Díez, I.; González-Sáiz, J.M.; Sáenz-González, C.; Pizarro, C. Coffee varietal differentiation based on near infrared spectroscopy. Talanta 2007, 71, 221–229.
- Jeszka-Skowron, M.; Zgoła-Grześkowiak, A.; Grześkowiak, T. Analytical methods applied for the characterization and the determination of bioactive compounds in coffee. Eur. Food Res. Technol. 2015, 240, 19–31.
- Prihadi, A.R.; Maimulyanti, A. Chemical Compounds of Coffee Ground and Spent Coffee Ground for Pharmaceutical Products. Pharm. Biomed. Sci. J. 2020, 2, 1–4.
- Butt, M.S.; Sultan, M.T. Coffee and its consumption: Benefits and risks. Crit. Rev. Food Sci. Nutr. 2011, 51, 363–373.
- George, S.E.; Ramalakshmi, K.; Mohan Rao, L.J. A perception on health benefits of coffee. Crit. Rev. Food Sci. Nutr. 2008, 48, 464–486.
- Prediger, R.D.S. Effects of caffeine in Parkinson’s disease: From neuroprotection to the management of motor and non-motor symptoms. J. Alzheimers Dis. 2010, 20, 205–220.
- Kwon, S.-H.; Lee, H.-K.; Kim, J.-A.; Hong, S.-I.; Kim, H.-C.; Jo, T.-H.; Park, Y.-I.; Lee, C.-K.; Kim, Y.-B.; Lee, S.-Y.; et al. Neuroprotective effects of chlorogenic acid on scopolamine-induced amnesia via anti-acetylcholinesterase and anti-oxidative activities in mice. Eur. J. Pharmacol. 2010, 649, 210–217.
- Chu, Y.-F.; Chang, W.-H.; Black, R.M.; Liu, J.-R.; Sompol, P.; Chen, Y.; Wei, H.; Zhao, Q.; Cheng, I.H. Crude caffeine reduces memory impairment and amyloid β1-42 levels in an Alzheimer’s mouse model. Food Chem. 2012, 135, 2095–2102.
- Arendash, G.W.; Mori, T.; Cao, C.; Mamcarz, M.; Runfeldt, M.; Dickson, A.; Rezai-Zadeh, K.; Tan, J.; Citron, B.A.; Lin, X.; et al. Caffeine reverses cognitive impairment and decreases brain amyloid-β levels in aged alzheimer’s disease mice. J. Alzheimers Dis. 2009, 17, 661–680.
- Arendash, G.W.; Cao, C. Caffeine and coffee as therapeutics against Alzheimer’s Disease. J. Alzheimers Dis. 2010, 20, S117–S126.
- Gokcen, B.B.; Sanlier, N. Coffee consumption and disease correlations. Crit. Rev. Food Sci. Nutr. 2019, 59, 336–348.
- Johnson, S.; Koh, W.-P.; Wang, R.; Govindarajan, S.; Yu, M.C.; Yuan, J.-M. Coffee consumption and reduced risk of hepatocellular carcinoma: Fndings from the Singapore Chinese Health Study. Cancer Causes Control 2011, 22, 503–510.
- Esquivel, P.; Jimenez, V.M. Functional properties of coffee and coffee by-products. Food Res. Int. 2012, 46, 488–495.
- Ludwig, I.A.; Clifford, M.N.; Lean, M.E.J.; Ashihara, H.; Crozier, A. Coffee: Biochemistry and potential impact on health. Food Funct. 2014, 5, 1695–1717.
- Muchtaridi, M.; Lestari, D.; Ikram, N.K.K.; Gazzali, A.M.; Hariono, M.; Wahab, H.A. Decaffeination and Neuraminidase Inhibitory Activity of Arabica Green Coffee (Coffea arabica) Beans: Chlorogenic Acid as a Potential Bioactive Compound. Molecules 2021, 26, 3402.
- Bułdak, R.J.; Hejmo, T.; Osowski, M.; Bułdak, Ł.; Kukla, M.; Polaniak, R.; Birkner, E. The impact of coffee and its selected bioactive compounds on the development and progression of colorectal cancer in vivo and in vitro. Molecules 2018, 23, 3309.
- Farah, A.; Donangelo, C.M. Phenolic compounds in coffee. Braz. J. Plant Physiol. 2006, 18, 23–36.
- Jeszka-Skowron, M.; Stanisz, E.; De Peña, M.P. Relationship between antioxidant capacity, chlorogenic acids and elemental composition of green coffee. LWT 2016, 73, 243–250.
- Yu, X.; Bao, Z.; Zou, J.; Dong, J. Coffee consumption and risk of cancers: A meta-analysis of cohort studies. BMC Cancer 2011, 11, 96–106.
- Hayakawa, S.; Ohishi, T.; Miyoshi, N.; Oishi, Y.; Nakamura, Y.; Isemura, M. Anti-cancer effects of green tea epigallocatchin-3-gallate and coffee chlorogenic acid. Molecules 2020, 25, 4553.
- Regazzoni, L.; Saligari, F.; Marinello, C.; Rossoni, G.; Aldini, G.; Carini, M.; Orioli, M. Coffee silver skin as a source of polyphenols: High resolution mass spectrometric profiling of components and antioxidant activity. J. Funct. Foods 2016, 20, 472–485.
- Cano-Marquina, A.; Tarín, J.J.; Cano, A. The impact of coffee on health. Maturitas 2013, 75, 7–21.
- Nieber, K. The impact of coffee on health. Planta Med. 2017, 83, 1256–1263.
- Lai, G.Y.; Weinstein, S.J.; Albanes, D.; Taylor, P.R.; McGlynn, K.A.; Virtamo, J.; Sinha, R.; Freedman, N.D. The association of coffee intake with liver cancer incidence and chronic liver disease mortality in male smokers. Br. J. Cancer 2013, 109, 1344–1351.
- Herawati, D.; Giriwono, P.E.; Dewi, F.N.A.; Kashiwagi, T.; Andarwulan, N. Three major compounds showing significant antioxidative, α-glucosidase inhibition, and antiglycation activities in Robusta coffee brew. Int. J. Food Prop. 2019, 22, 994–1010.
- Ohishi, T.; Fukutomi, R.; Shoji, Y.; Goto, S.; Isemura, M. The beneficial effects of principal polyphenols from green tea, coffee, wine, and curry on obesity. Molecules 2021, 26, 453.
- Pinheiro, P.F.; Pinheiro, C.A.; Osório, V.M.; Pereira, L.L. Chemical Constituents of Coffee. In Quality Determinants in Coffee Production; Food Engineering Series; Louzada Pereira, L., Rizzo Moreira, T., Eds.; Springer: Cham, Switzerland, 2021; pp. 209–254.
- Alcantara, G.M.R.N.; Dresch, D.; Melchert, W.R. Use of non-volatile compounds for the classification of specialty and traditional Brazilian coffees using principal component analysis. Food Chem. 2021, 360, 130088.
- European Commission. Knowledge Centre for Food Fraud and Quality. Available online: https://knowledge4policy.ec.europa.eu/food-fraud-quality/topic/food-fraud_en (accessed on 20 June 2022).
- Ferreira, T.; Galluzzi, L.; de Paulis, T.; Farah, A. Three centuries on the science of coffee authenticity control. Food Res. Int. 2021, 149, 110690.
- De Lange, E. Draft Report on the Food Crisis, Fraud in the Food Chain and Control Thereof (2013/2091 (INI)); The European Parliament, Committee on the Environment, Public Health and Food Safety: Brussels, Belgium, 2013; Available online: https://www.europarl.europa.eu/doceo/document/ENVI-PR-519759_EN.pdf?redirect (accessed on 20 June 2022).
- Alves, R.C.; Casal, S.; Alves, M.R.; Oliveira, M.B. Discrimination between Arabica and robusta coffee species on the basis of their tocopherol profiles. Food Chem. 2009, 114, 295–299.
- Bertrand, B.; Villarreal, D.; Laffargue, A.; Posada, H.; Lashermes, P.; Dussert, S. Comparison of the effectiveness of fatty acids, chlorogenic acids, and elements for the chemometric discrimination of coffee (Coffea arabica L.) varieties and growing origins. J. Agric. Food Chem. 2008, 56, 2273–2280.
- González, A.G.; Pablos, F.; Martín, M.J.; Leon-Camacho, M.; Valdenebro, M.S. HPLC analysis of tocopherols and triglycerides in coffee and their use as authentication parameters. Food Chem. 2001, 73, 93–101.
- Górnaś, P.; Siger, A.; Pugajeva, I.; Czubinski, J.; Waśkiewicz, A.; Polewski, K. New insights regarding tocopherols in Arabica and Robusta species coffee beans: RP-UPLC-ESI/MSn and NP-HPLC/FLD study. J. Food Compos. Anal. 2014, 36, 117–123.
- Cagliani, L.R.; Pellegrino, G.; Giugno, G.; Consonni, R. Quantifcation of Coffea arabica and Coffea canephora var. robusta in roasted and ground coffee blends. Talanta 2013, 106, 169–173.
- Dias, R.C.E.; Benassi, M.D.T. Discrimination between Arabica and Robusta coffees using hydrosoluble compounds: Is the efficiency of the parameters dependent on the roast degree? Beverages 2015, 1, 127–139.
- Casal, S.; Oliveira, M.B.P.P.; Alves, M.R.; Ferreira, M.A. Discriminate analysis of roasted coffee varieties for trigonelline, nicotinic acid, and caffeine content. J. Agric. Food Chem. 2000, 48, 3420–3424.
- Fintello, C.; Forzato, C.; Gasparini, A.; Mammi, S.; Navarini, L.; Schievano, E. NMR quantification of 16-O-methylcafestol and kahweol in Coffea canephora var. robusta beans from different geographical origins. Food Control 2017, 75, 62–69.
- De Luca, S.; Ciotoli, E.; Biancolillo, A.; Bucci, R.; Magrì, A.D.; Marini, F. Simultaneous quantification of caffeine and chlorogenic acid in coffee green beans and varietal classification of the samples by HPLC-DAD coupled with chemometrics. Environ. Sci. Pollut. Res. Int. 2018, 25, 28748–28759.
- Casal, S.; Alves, M.R.; Mendes, E.; Oliveira, M.B.P.P.; Ferreira, M.A. Discrimination between Arabica and Robusta coffee species on the basis of their amino acid enantiomers. J. Agric. Food Chem. 2003, 51, 6495–6501.
- Martín, M.J.; Pablos, F.; Gonzalez, A.G.; Valdenebro, M.S.; Leon-Camacho, M. Fatty acid profiles as discriminant parameters for coffee varieties differentiation. Talanta 2001, 54, 291–297.
- Rui Alves, M.; Casal, S.; Oliveira, M.B.P.P.; Ferreira, M.A. Contribution of FA profile obtained by high-resolution GC/chemometric techniques to the authenticity of green and roasted coffee varieties. J. Am. Oil Chem. Soc. 2003, 80, 511–517.
- Romano, R.; Santini, A.; Le Grottaglie, L.; Manzo, N.; Visconti, A.; Ritieni, A. Identification markers based on fatty acid composition to differentiate between roasted Arabica and Canephora (Robusta) coffee varieties in mixtures. J. Food Comp. Anal. 2014, 35, 1–9.
- Combes, M.C.; Joët, T.; Lashermes, P. Development of a rapid and efficient DNA-based method to detect and quantify adulterations in coffee (Arabica versus Robusta). Food Control 2018, 88, 198–206.
- Monakhova, Y.B.; Ruge, W.; Kuballa, T.; Ilse, M.; Winkelmann, O.; Diehl, B.; Thomas, F.; Lachenmeier, D.W. Rapid approach to identify the presence of Arabica and Robusta species in coffee using 1H NMR spectroscopy. Food Chem. 2015, 182, 178–184.
- Casal, S.; Mendes, E.; Alves, M.R.; Alves, R.C.; Beatriz, M.; Oliveira, P.P.; Ferreira, M.A. Free and conjugated biogenic amines in green and roasted coffee beans. J. Agric. Food Chem. 2004, 52, 6188–6192.
- Martín, M.J.; Pablos, F.; González, A.G. Discrimination between Arabica and Robusta green coffee varieties according to their chemical composition. Talanta 1998, 46, 1259–1264.
- Antoine, J.M.R.; Hoo Fung, L.A.; Grant, C.N. Geographic determination of the growing origins of Jamaican and international coffee using instrumental neutron activation analysis and other methods. J. Radioanal. Nucl. Chem. 2016, 309, 525–534.
- Anderson, K.A.; Smith, B.W. Chemical profiling to differentiate geographic growing origins of coffee. J. Agric. Food Chem. 2002, 50, 2068–2075.
- Mehari, B.; Redi-Abshiro, M.; Chandravanshi, B.S.; Combrinck, S.; McCrindle, R. Characterization of the Cultivation Region of Ethiopian Coffee by Elemental Analysis. Anal. Lett. 2016, 49, 2474–2489.
- Mendes, G.D.A.; de Oliveira, M.A.L.; Rodarte, M.P.; de Carvalho dos Anjos, V.; Bell, M.J.V. Origin geographical classification of green coffee beans (Coffea arabica L.) produced in different regions of the Minas Gerais state by FT-MIR and chemometric. Curr. Res. Food Sci. 2022, 5, 298–305.
- Mullen, W.; Nemzer, B.; Stalmach, A.; Ali, S.; Combet, E. Polyphenolic and hydroxycinnamate contents of whole coffee fruits from China, India, and Mexico. J. Agric. Food Chem. 2013, 61, 5298–5309.
- Mehari, B.; Chandravanshi, B.S.; Redi-Abshiro, M.; Combrinck, S.; McCrindle, R.; Atlabachew, M. Polyphenol contents of green coffee beans from different regions of Ethiopia. Int. J. Food Prop. 2021, 24, 17–27.
- Alonso-Salces, R.M.; Serra, F.; Reniero, F.; Héberger, K. Botanical and geographical characterization of green coffee (Coffea arabica and Coffea canephora): Chemometric evaluation of phenolic and methylxanthine contents. J. Agric. Food Chem. 2009, 57, 4224–4235.
- Consonni, R.; Cagliani, L.R.; Cogliati, C. NMR based geographical characterization of roasted coffee. Talanta 2012, 88, 420–426.
- Marquetti, I.; Link, J.V.; Lemes, A.L.G.; dos Santos Scholz, M.B.; Valderrama, P.; Bona, E. Partial least square with discriminant analysis and near infrared spectroscopy for evaluation of geographic and genotypic origin of Arabica coffee. Comput. Electron. Agric. 2016, 121, 313–319.
- Yener, S.; Romano, A.; Cappellin, L.; Granitto, P.M.; Aprea, E.; Navarini, L.; Märk, T.D.; Gasperi, F.; Biasioli, F. Tracing coffee origin by direct injection headspace analysis with PTR/SRI-MS. Food Res. Int. 2015, 69, 235–243.
- Pauli, E.D.; Barbieri, F.; Garcia, P.S.; Madeira, T.B.; Acquaro, V.R.; Scarminio, I.S.; da Camara, C.A.P.; Nixdorf, S.L. Detection of ground roasted coffee adulteration with roasted soybean and wheat. Food Res. Int. 2014, 61, 112–119.
- Nogueira, T.; do Lago, C.L. Detection of adulterations in processed coffee with cereals and coffee husks using capillary zone electrophoresis. J. Sep. Sci. 2009, 32, 3507–3511.
- Domingues, D.S.; Pauli, E.D.; de Abreu, J.E.M.; Massura, F.W.; Cristiano, V.; Santos, M.J.; Nixdorf, S.L. Detection of roasted and ground coffee Adulteration by HPLC and by amperometric and by post-column derivatization UV-Vis detection. Food Chem. 2014, 146, 353–362.
- Cai, T.; Ting, H.; Jin-Lan, Z. Novel identification strategy for ground coffee adulteration based on UPLC-HRMS oligosaccharide profiling. Food Chem. 2016, 190, 1046–1049.
- Daniel, D.; Lopes, F.S.; dos Santos, V.B.; do Lago, C.L. Detection of coffee adulteration with soybean and corn by capillary electrophoresis-tandem mass spectrometry. Food Chem. 2018, 243, 305–310.
- Uncu, A.T.; Uncu, A.O. Plastid trnH-psbA intergenic spacer serves as a PCRbased marker to detect common grain adulterants of coffee (Coffea arabica L.). Food Control 2018, 91, 32–39.
- De Morais, T.C.B.; Rodrigues, D.R.; de Carvalho Polari Souto, U.T.; Lemos, S.G. A Simple voltammetric electronic tongue for the analysis of coffee adulterations. Food Chem. 2019, 273, 31–38.
- Ferreira, T.; Farah, A.; Oliveira, T.C.; Lima, I.S.; Vitório, F.; Oliveira, E.M.M. Using real-time PCR as a tool for monitoring the authenticity of commercial coffees. Food Chem. 2016, 199, 433–438.
- Toci, A.T.; Farah, A.; Pezza, H.R.; Pezza, L. Coffee adulteration: More than two decades of research. Crit. Rev. Anal. Chem. 2016, 46, 83–92.
- Sezer, B.; Apaydin, H.; Bilge, G.; Boyaci, I.H. Coffee arabica adulteration: Detection of wheat, corn and chickpea. Food Chem. 2018, 264, 142–148.
- Arrieta, A.A.; Arrieta, P.L.; Mendoza, J.M. Analysis of coffee adulterated with roasted corn and roasted soybean using voltammetric electronic tongue. Acta Sci. Pol. Technol. Aliment. 2019, 18, 35–41.
- Toci, A.T.; de Moura Ribeiro, M.V.; de Toledo, P.R.A.B.; Boralle, N.; Pezza, H.R.; Pezza, L. Fingerprint and authenticity roasted coffees by 1H-NMR: The Brazilian coffee case. Food Sci. Biotechnol. 2018, 27, 19–26.
- Burns, D.T.; Walker, M.J. Critical Review of Analytical and Bioanalytical Verification of the Authenticity of Coffee. J. AOAC Int. 2020, 103, 283–294.
- Barbosa, R.M.; Batisa, B.L.; Varrique, R.M.; Coelho, V.A.; Campiglia, A.D.; Barbosa, F., Jr. The use of advanced chemometric techniques and trace element levels for controlling the authenticity of organic coffee. Food Res. Int. 2014, 61, 246–251.
- Carter, J.F. Food Forensics: Stable Isotopes as a Guide to Authenticity and Origin, 1st ed.; Carter, J.F., Chesson, L.A., Eds.; CRC Press: Boca Raton, FL, USA, 2017; pp. 169–173.
- Muñiz-Valencia, R.; Jurado, J.M.; Ceballos-Magña, S.G.; Alcázar, A.; Hernández-Díaz, J. Characterization of Mexican coffee according to mineral contents by means of multilayer perceptrons artificial neural networks. J. Food Comp. Anal. 2014, 34, 7–11.
- Oliveira, M.; Ramos, S.; Delerue-Matos, C.; Morais, S. Expresso beverages of pure origin coffee: Mineral characterization, contribution for mineral intake and geographical origin discrimination. Food Chem. 2015, 177, 330–338.
- Valentin, J.L.; Watling, R.J. Provenance establishment of coffee using solution ICP-MS and ICP-AES. Food Chem. 2013, 141, 98–104.
- Gunning, Y.; Defernez, M.; Watson, A.D.; Beadman, N.; Colquhoun, I.J.; Le Gall, G.; Philo, M.; Garwood, H.; Williamson, D.; Davis, A.P.; et al. 16-O-methylcafestol is present in ground roast Arabica coffees: Implications for authenticity testing. Food Chem. 2018, 248, 52–60.
- Schievano, E.; Finotello, C.; de Angelis, E.; Mammi, S.; Navarini, L. Rapid Authentication of Coffee Blends and Quantification of 16-OMethylcafestol in Roasted Coffee Beans by Nuclear Magnetic Resonance. J. Agric. Food Chem. 2014, 62, 12309–12314.
- Tolessa, K.; Rademaker, M.; Baets, B.D.; Boeckx, P. Prediction of specialty coffee cup quality based on near infrared spectra of green coffee beans. Talanta 2016, 150, 367–374.
- Bertone, E.; Venturelo, A.; Giraudo, A.; Pellegrino, G.; Geobaldo, F. Simultaneous determination by NIR spectroscopy of the roasting degree and Arabic/Robusta ratio in roasted and ground coffee. Food Control 2016, 59, 683–689.
- Wermelinger, T.; D’Ambrosio, L.; Klopprogge, B.; Yeretzian, C. Quantification of the Robusta fraction in a coffee blend via Raman spectroscopy: Proof of principle. J. Agric. Food Chem. 2011, 59, 9074–9079.
- Mees, C.; Souard, F.; Delporte, C.; Deconinck, E.; Stoffelen, P.; Stévigny, C.; Kauffmann, J.-M.; De Braekeleer, K. Identification of coffee leaves using FT-NIR spectroscopy and SIMCA. Talanta 2018, 177, 4–11.
- Martellossi, C.; Taylor, E.J.; Lee, D.; Graziosi, G.; Donni, P. DNA Extraction and Analysis from Processed Coffee Beans. J. Agric. Food Chem. 2005, 53, 8432–8438.
- De Carvalho Martins, V.; de Oliveira Godoy, R.L.; Gouvêa, A.C.M.S.; de Araujo Santiago, M.C.P.; Borguini, R.G.; de Oliveira Braga, E.C.; Pacheco, S.; do Nascimento, L.D.S.D.M. Fraud investigation in commercial coffee by chromatography. Food Qual. Saf. 2018, 2, 121–133.
- Klikarová, J.; Řeháková, B.; Česlová, L. Evaluation of regular and decaffeinated (un)roasted coffee beans using HPLC and multivariate statistical methods. J. Food Compos. Anal. 2022, 114, 104841.
- Wang, X.; Lim, L.-T.; Fu, Y. Review of analytical methods to detect adulteration in coffee. J. AOAC Int. 2020, 103, 295–305.
- Cheah, W.L.; Fang, M. HPLC-based chemometric analysis for coffee adulteration. Foods 2020, 9, 880.
- Silva, A.R.; Santos, J.R.; Almeida, P.J.; Rodrigues, J.A. Screening of Antioxidant Compounds in Green Coffee by Low Pressure Chromatography with Amperometric Detection. Food Anal. Methods 2021, 14, 2175–2185.
- Perez, M.; Domínguez-López, I.; López-Yerena, A.; Vallverdú Queralt, A. Current strategies to guarantee the authenticity of coffee. Crit. Rev. Food Sci. Nutr. 2021, 61, 1–16.
- Putri, S.P.; Irifune, T.; Fukusaki, E. GC/MS based metabolite profiling of Indonesian specialty coffee from different species and geographical origin. Metabolomics 2019, 15, 1–11.
- Dos Santos, H.D.; Boffo, E.F. Coffee beyond the cup: Analytical techniques used in chemical composition research—A review. Eur. Food Res. Technol. 2021, 247, 749–775.
- Demianová, A.; Bobková, A.; Jurčaga, L.; Bobko, M.; Belej, Ľ.; Árvay, J. Determination of Geographical Origin of Green and Roasted Coffee Based on Selected Chemical Parameters. J. Microbiol. Biotechnol. Food Sci. 2021, 10, 706–710.
- Angelino, D.; Tassotti, M.; Brighenti, F.; Del Rio, D.; Mena, P. Niacin, alkaloids and (poly)phenolic compounds in the most widespread Italian capsule-brewed coffees. Sci. Rep. 2018, 8, 17874.
- Schouten, M.A.; Tappi, S.; Angeloni, S.; Cortese, M.; Caprioli, G.; Vittori, S.; Romani, S. Acrylamide formation and antioxidant activity in coffee during roasting—A systematic study. Food Chem. 2021, 343, 128514.
- Miłek, M.; Młodecki, Ł.; Dżugan, M. Caffeine Content and Antioxidant Activity of Various Brews of Specialty Grade Coffee. Acta Sci. Pol. Technol. Aliment. 2021, 20, 179–188.
- Gutiérrez Ortiz, A.L.; Berti, F.; Solano Sánchez, W.; Navarini, L.; Colomban, S.; Crisafulli, P.; Forzato, C. Distribution of p-coumaroylquinic acids in commercial Coffea spp. of different geographical origin and in other wild coffee species. Food Chem. 2019, 286, 459–466.
- Atlabachew, M.; Abebe, A.; Wubieneh, T.A.; Habtemariam, T.Y. Rapid and simultaneous determination of trigonelline, caffeine, and chlorogenic acid in green coffee bean extract. Food Sci. Nutr. 2021, 9, 5028–5035.
- Macheiner, L.; Schmidt, A.; Mayer, H.K. A novel basis for monitoring the coffee roasting process: Isomerization reactions of 3-caffeoylquinic and 4-caffeoylquinic acids. LWT 2021, 152, 112343.
- Faria, W.C.S.; Petry, F.C.; De Barros, W.M.; de Melo Moura, W.; da Conceição, E.C.; Bragagnolo, N. Effect of solid–liquid extraction on the bioactive content and reducing capacity of the green coffee fruit. Sep. Sci. Technol. 2020, 56, 1211–1224.
- Montenegro, J.; dos Santos, L.S.; de Souza, R.G.G.; Lima, L.G.B.; Mattos, D.S.; Viana, B.P.P.B.; da Fonseca Bastos, A.C.S.; Muzzi, L.; Conte-Júnior, C.A.; Gimba, E.R.P.; et al. Bioactive compounds, antioxidant activity and antiproliferative effects in prostate cancer cells of green and roasted coffee extracts obtained by microwave-assisted extraction (MAE). Food Res. Int. 2021, 140, 110014.
- Brzezicha, J.; Błazejewicz, D.; Brzezinska, J.; Grembecka, M. Green coffee VS dietary supplements: A comparative analysis of bioactive compounds and antioxidant activity. Food Chem. Toxicol. 2021, 155, 112377.
- Ahmad, I.; Syakfanaya, A.M.; Azminah, A.; Saputri, F.C.; Mun’im, A. Optimization of betaine-sorbitol natural deep eutectic solvent-based ultrasound-assisted extraction and pancreatic lipase inhibitory activity of chlorogenic acid and caffeine content from robusta green coffee beans. Heliyon 2021, 7, e07702.
- Budryn, G.; Nebesny, E.; Podsędek, A.; Żyżelewicz, D.; Materska, M.; Jankowski, S.; Janda, B. Effect of different extraction methods on the recovery of chlorogenic acids, caffeine and Maillard reaction products in coffee beans. Eur. Food Res. Technol. 2009, 228, 913–922.
- Ludwig, I.A.; Sanchez, L.; Caemmerer, B.; Kroh, L.W.; De Peña, M.P.; Cid, C. Extraction of coffee antioxidants: Impact of brewing time and method. Food Res. Int. 2012, 48, 57–64.
- Rothwell, J.; Loftfeld, E.; Wedekind, R.; Freedman, N.; Kambanis, C.; Scalbert, A.; Sinha, R. A metabolomic study of the variability of the chemical composition of commonly consumed coffee brews. Metabolites 2019, 9, 17.
- De Luca, S.; De Filippis, M.; Bucci, R.; Magrì, A.D.; Magrì, A.L.; Marini, F. Characterization of the effects of different roasting conditions on coffee samples of different geographical origins by HPLC-DAD, NIR and chemometrics. Microchem. J. 2016, 129, 348–361.
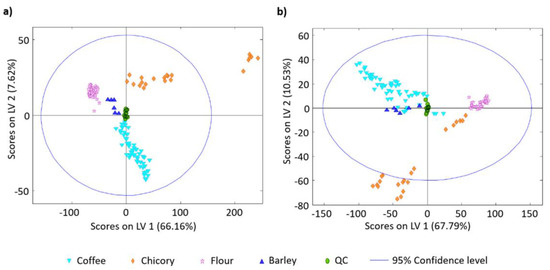
- Núñez, N.; Saurina, J.; Núñez, O. Authenticity Assessment and Fraud Quantitation of Coffee Adulterated with Chicory, Barley, and Flours by Untargeted HPLC-UV-FLD Fingerprinting and Chemometrics. Foods 2021, 10, 840.
- Iwasa, K.; Setoyama, D.; Shimizu, H.; Seta, H.; Fujimura, Y.; Miura, D.; Wariishi, H.; Nagai, C.; Nakahara, K. Identification of 3-methylbutanoyl glycosides in green Coffea arabica beans as causative determinants for the quality of coffee flavors. J. Agric. Food Chem. 2015, 63, 3742–3751.
- Sittipod, S.; Schwartz, E.; Paravisini, L.; Peterson, D.G. Identification of flavor modulating compounds that positively impact coffee quality. Food Chem. 2019, 301, 125250.
- Xu, L.; Lao, F.; Xu, Z.; Wang, X.; Chen, F.; Liao, X.; Chen, A.; Yang, S. Use of liquid chromatography quadrupole time-of-flight mass spectrometry and metabolomic approach to discriminate coffee brewed by different methods. Food Chem. 2019, 286, 106–112.
- Núñez, N.; Martínez, C.; Saurina, J.; Núñez, O. High-performance liquid chromatography with fluorescence detection fingerprints as chemical descriptors to authenticate the origin, variety and roasting degree of coffee by multivariate chemometric methods. J. Sci. Food Agric. 2021, 101, 65–73.
- Núñez, N.; Saurina, J.; Núñez, O. Non-targeted HPLC-FLD fingerprinting for the detection and quantitation of adulterated coffee samples by chemometrics. Food Control 2021, 124, 107912.
- Núñez, N.; Pons, J.; Saurina, J.; Núñez, O. Non-targeted high-performance liquid chromatography with ultraviolet and fluorescence detection fingerprinting for the classification, authentication, and fraud quantitation of instant coffee and chicory by multivariate chemometric methods. LWT 2021, 147, 111646.
- Viapiana, A.; Maggi, F.; Kaszuba, M.; Konieczynski, P.; Wesolowski, M. Quality assessment of Coffea arabica commercial samples. Nat. Prod. Res. 2020, 34, 3154–3157.
- Moreira, I.; Scarminio, I.S. Chemometric discrimination of genetically modified Coffea arabica cultivars using spectroscopic and chromatographic fingerprints. Talanta 2013, 107, 416–422.
- Guizellini, F.C.; Marcheafave, G.G.; Rakocevic, M.; Bruns, R.E.; Scarminio, I.S.; Soares, P.K. PARAFAC HPLC-DAD metabolomic fingerprint investigation of reference and crossed coffees. Food Res. Int. 2018, 113, 9–17.
- Bertrand, B.; Boulanger, R.; Dussert, S.; Ribeyre, F.; Berthiot, L.; Descroix, F.; Joët, T. Climatic factors directly impact the volatile organic compound fingerprint in green Arabica coffee bean as well as coffee beverage quality. Food Chem. 2012, 135, 2575–2583.
- Abdelwareth, A.; Zayed, A.; Farag, M.A. Chemometrics-based aroma profiling for revealing origin, roasting indices, and brewing method in coffee seeds and its commercial blends in the Middle East. Food Chem. 2021, 349, 129162.
- Marcheafave, G.G.; Pauli, E.D.; Tormena, C.D.; Ortiz, M.C.V.; de Almeida, A.G.; Rakocevic, M.; Bruns, R.E.; Scarminio, I.S. Factorial design fingerprint discrimination of Coffea arabica beans under elevated carbon dioxide and limited water conditions. Talanta 2020, 209, 120591.