Your browser does not fully support modern features. Please upgrade for a smoother experience.
Submitted Successfully!
 +1 credit
Thank you for your contribution! You can also upload a video entry or images related to this topic.
For video creation, please contact our Academic Video Service.
| Version | Summary | Created by | Modification | Content Size | Created at | Operation |
|---|---|---|---|---|---|---|
| 1 | Andrzej Szutowicz | -- | 7173 | 2022-09-19 14:16:47 | | | |
| 2 | Conner Chen | -870 word(s) | 6303 | 2022-09-21 08:55:23 | | | | |
| 3 | Conner Chen | Meta information modification | 6303 | 2022-09-21 08:55:51 | | | | |
| 4 | Conner Chen | + 2 word(s) | 6305 | 2022-09-22 07:41:48 | | | | |
| 5 | Conner Chen | Meta information modification | 6305 | 2022-09-22 10:45:48 | | |
Video Upload Options
We provide professional Academic Video Service to translate complex research into visually appealing presentations. Would you like to try it?
Cite
If you have any further questions, please contact Encyclopedia Editorial Office.
Szutowicz, A.; Klimaszewska-Łata, J.; Gul-Hinc, S.; Ronowska, A.; Jankowska-Kulawy, A. The Key Precursors of Brain Acetyl-CoA. Encyclopedia. Available online: https://encyclopedia.pub/entry/27309 (accessed on 24 July 2026).
Szutowicz A, Klimaszewska-Łata J, Gul-Hinc S, Ronowska A, Jankowska-Kulawy A. The Key Precursors of Brain Acetyl-CoA. Encyclopedia. Available at: https://encyclopedia.pub/entry/27309. Accessed July 24, 2026.
Szutowicz, Andrzej, Joanna Klimaszewska-Łata, Sylwia Gul-Hinc, Anna Ronowska, Agnieszka Jankowska-Kulawy. "The Key Precursors of Brain Acetyl-CoA" Encyclopedia, https://encyclopedia.pub/entry/27309 (accessed July 24, 2026).
Szutowicz, A., Klimaszewska-Łata, J., Gul-Hinc, S., Ronowska, A., & Jankowska-Kulawy, A. (2022, September 19). The Key Precursors of Brain Acetyl-CoA. In Encyclopedia. https://encyclopedia.pub/entry/27309
Szutowicz, Andrzej, et al. "The Key Precursors of Brain Acetyl-CoA." Encyclopedia. Web. 19 September, 2022.
Copy Citation
Acetyl-CoA is a principal substrate feeding tricarboxylic acid (TCA). cycle and energy production. Brain displays high demand for energy due to high frequency of neuronal depolarizatio-repolarization cycles. Therefore, adequate provision of acetyl-CoA precursors is critical factor for proper neuronal activity and survival.
acetyl-CoA metabolism
neurodegenerative diseases
zinc dyshomeostasis
thiamine deficiency
1. Introduction
Acetyl-CoA is a direct precursor substrate for the tricarboxylic acid (TCA) cycle coupled with energy production in the respiratory chain. In the brain, the largest fraction of acetyl-CoA is synthesised in mitochondria by the pyruvate dehydrogenase complex (PDHC) from pyruvate originating from glycolytic metabolism of glucose or from lactate oxidation by lactate dehydrogenase 1 (EC 1.1.1.1, LDH 1). The acetoacetate/β-hydroxybutyrate (AcAc/BHB), acetate, fatty acids and branched chain amino acids may provide smaller amounts of this metabolite in a concentration-dependent manner through β-ketothiolase (EC 2.3.1.16), acetyl-CoA synthase (ACCS, EC 6.2.1.1), beta-oxidation and branched ketoacids dehydrogenase pathways, respectively [1][2]. However, unlike peripheral tissues, the brain lacks significant metabolic flexibility, utilising plasma glucose as an obligatory, principal energy substrate. Non-glucose substrates cannot compensate for significant limitations in glucose supply apart from AcAc/BHB in starvation [1][2][3] (Figure 1). Nevertheless, irrespective of the precursor, acetyl-CoA is a merging endpoint metabolite, which enters the TCA cycle through a citrate synthase reaction. In resting conditions, the brain utilises 10 times more glucose and oxygen per weight than peripheral tissues; this is due to the continuous generation of action potentials in neurons in the range of 5–50 Hz. Moreover, restoration of neuronal membrane resting potential during each depolarisation/repolarisation cycle requires large amounts of energy. Hence, human brain neurons that make up 10% of all brain cells utilise 60–80% of glucose and oxygen. On the other hand, glial cells, which constitute 80–90% of human brain cells, produce 10% of the energy pool but export significant amounts of lactate to support neuronal energy metabolism. This is due to the prevalence of glycolysis over oxidative metabolism in astroglia and oligodendroglia [4][5][6]. Recent immunolabelling studies revealed that SOX9, an astrocyte-specific nuclear marker, is co-expressed with GLUT1 in astrocytes, constituting 10–20% of brain cells. However, they may be upregulated in several brain pathologies, including strokes, mini strokes and amyotrophic lateral sclerosis [7]. Moreover, physiological stimuli, such as feeding young mice with a high-fat diet for one month, increased astroglia size, branching and metabolism along with improving behaviour in animal behavioural tests [8].
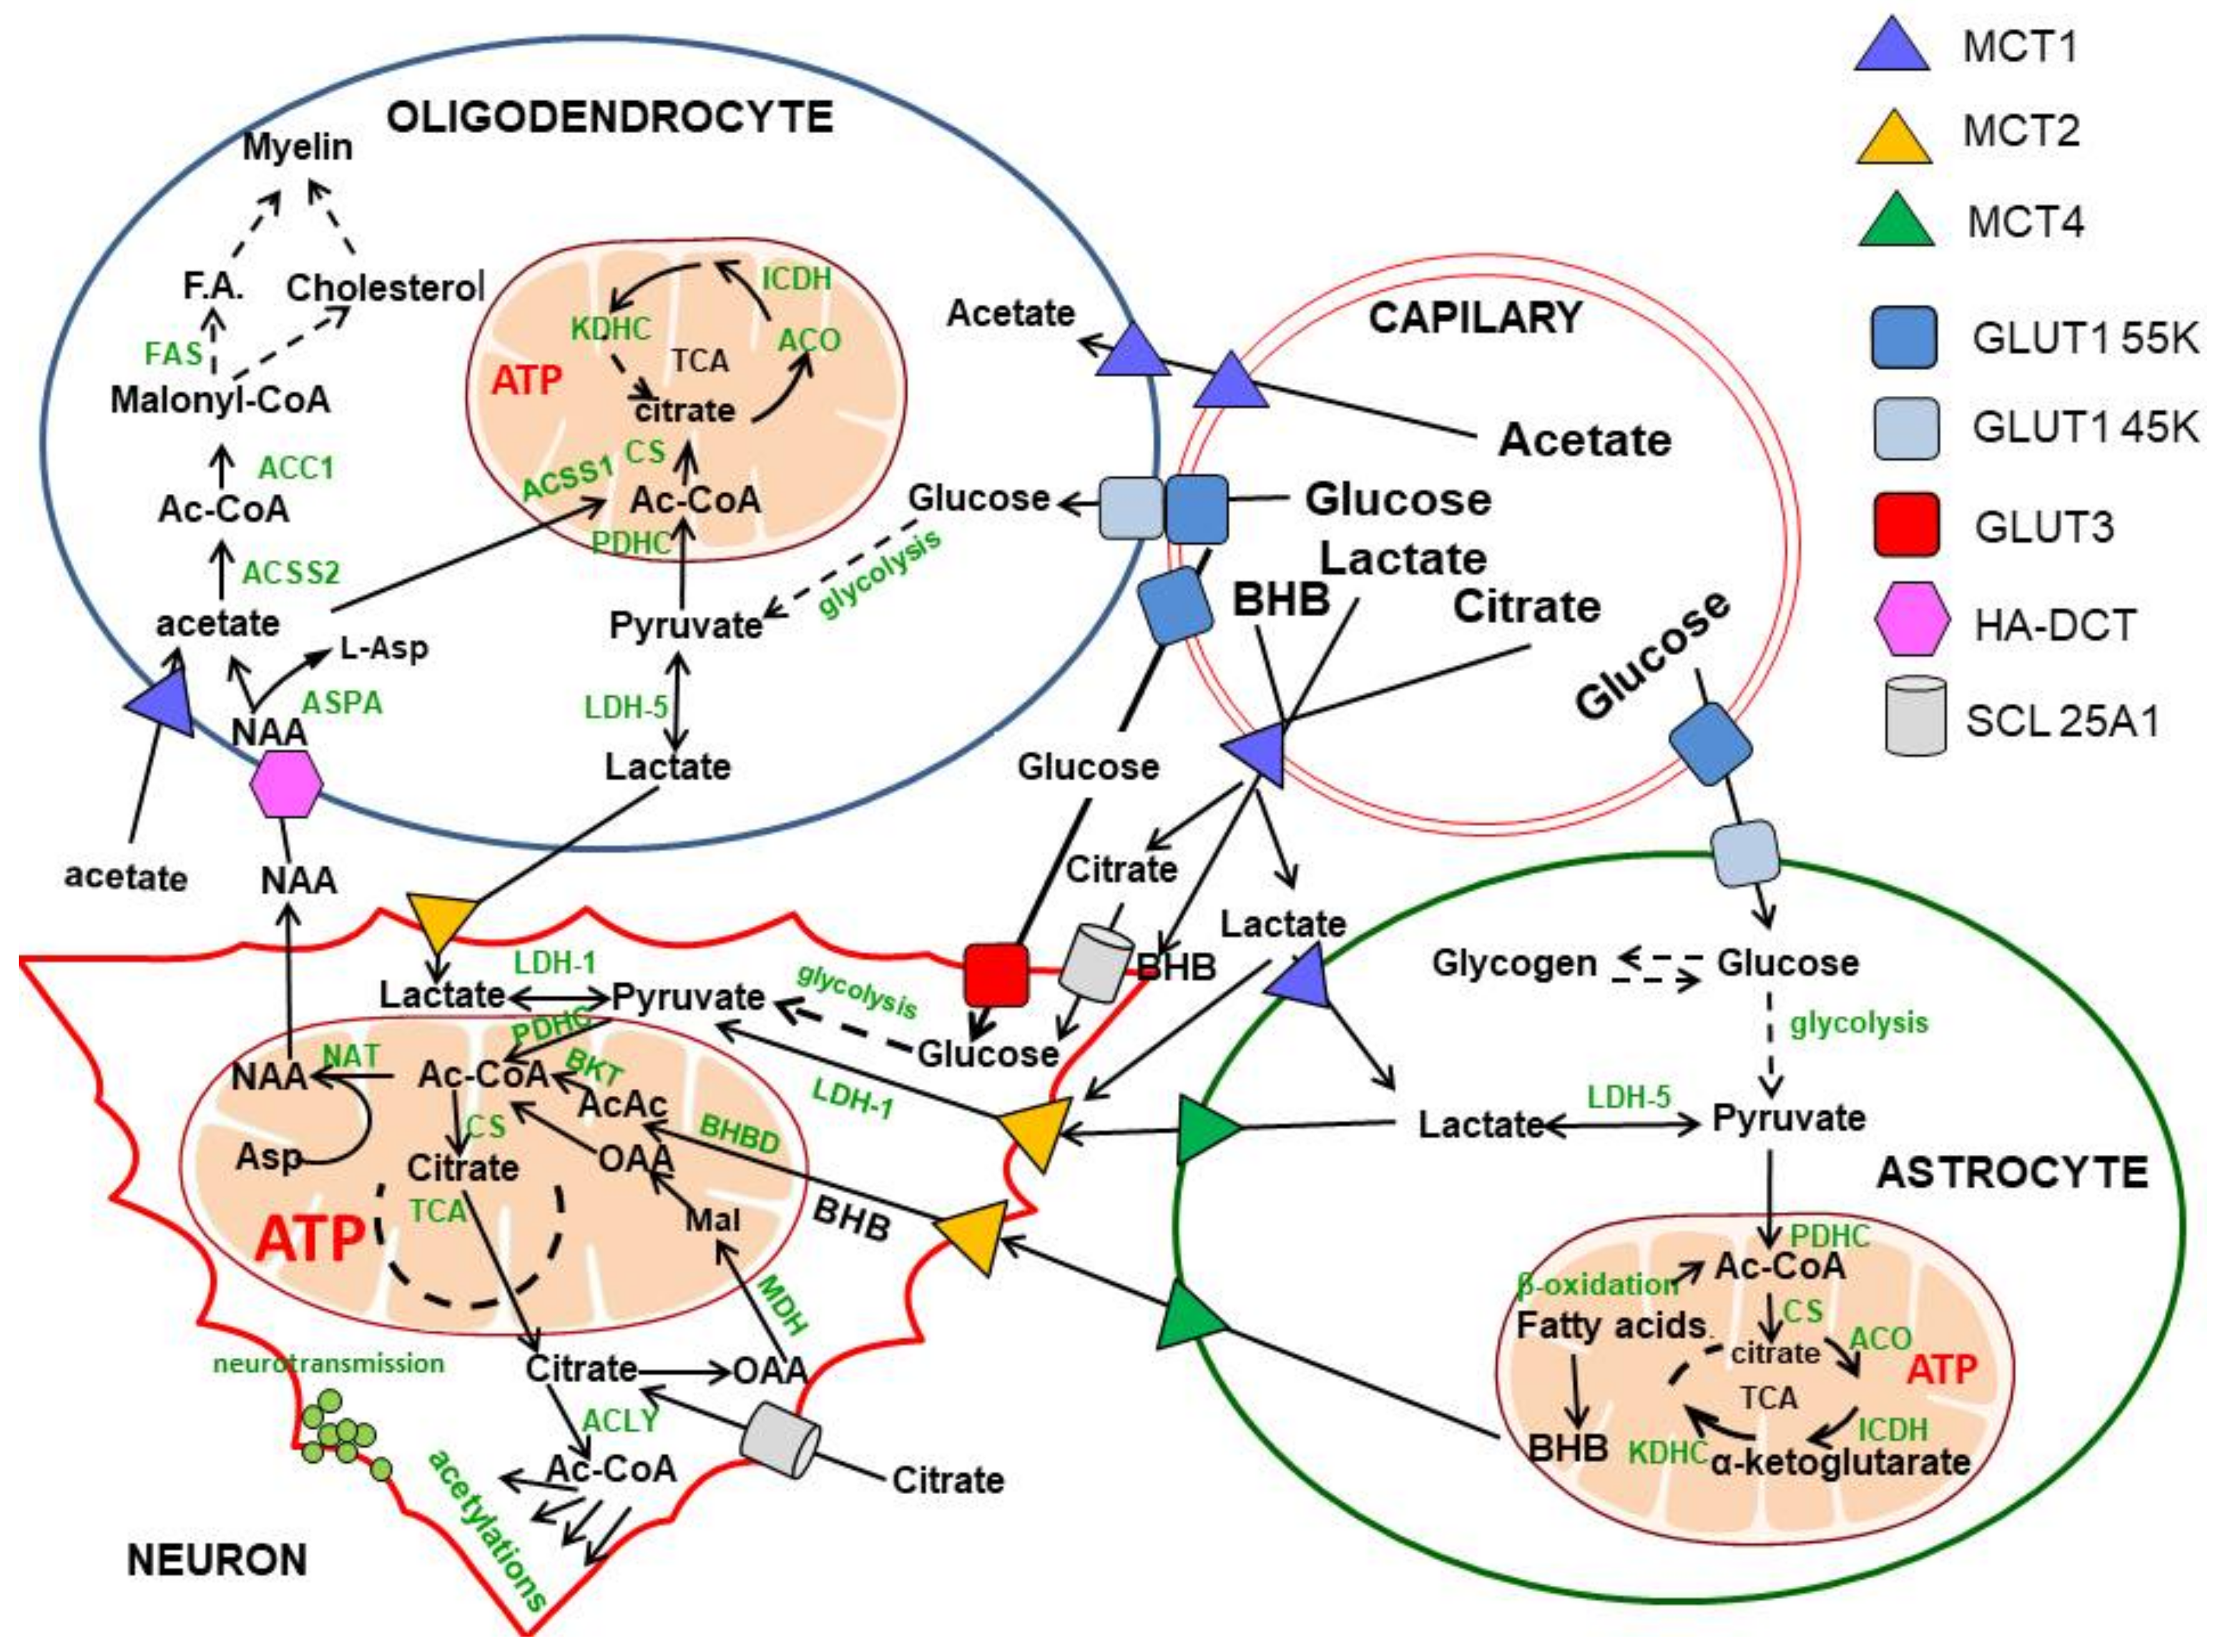
Figure 1. Intracellular and intercellular compartmentation of acetyl-CoA and precursors in the brain. The principal brain energy substrate, glucose, crosses the BBB though the Glut55kD transporter and enters oligo, micro and astroglial cells through Glut45kD. Neurons take up glucose by the Glut3 high-affinity transporter, consuming 60–80% of its overall brain pool. The final product of glycolysis—pyruvate through mitochondrial PDHC reaction—is the principal source of acetyl-CoA for energy production in neurons and glial brain cells. Neurons may also utilise lactate, BHB or citrate provided either for circulation and/or by astrocytes and oligodendrocytes; these two classes of glial cells produce a surplus of lactate due to relatively low rates of oxidative metabolism. Neuronal mitochondria are the only compartment synthesising NAA, which is transported to oligodendrocytes serving as a main source of acetyl units for fatty acid and cholesterol synthesis for myelin formation. Astrocytes are brain cells with a high rate of fatty acid oxidation net producing BHB. Moreover, in ketonemic conditions, BHB crosses the BBB by MCT1 in a concentration-dependent manner. Neurons take up BHB by MCT2, converting it to acetyl-CoA. As a result, BHB may serve as an alternative energy substrate in hypoglycaemic conditions. At least five functionally distinct subcellular compartments in the neurons can be distinguished. They include mitochondria, where acetyl-CoA is utilised mainly in the TCA cycle coupled with the respiratory chain and ATP as well as with NAA synthesis. In the cytoplasmic compartment, acetyl-CoA is produced from citrate, acetyl-carnitine acetoacetate or acetate in respective enzymatic reactions and used for fatty acid and cholesterol synthesis or protein, peptide or lipid acetylations. Separate pools of acetyl-CoA are formed by the nucleus and endoplasmic reticulum, where histone and protein acetylation takes part in the regulation of gene expression, protein functionalisation and disposal. Cholinergic neurons constitute a specific neuronal sub-compartment in which ACh synthesis and the cholinergic neurotransmission process takes place (see Figure 2). The neuronal axonal compartment contains unique tubulin-bound protein acetylation, which is responsible for axonal transport (see Figure 3). This figure demonstrates that indirect transport of acetyl units between different cell types and internal subcellular compartments plays a crucial role in the maintenance of brain homeostasis. Abbreviations: Enzyme names in the boxes: ACC1, acetyl-CoA carboxylase 1; ACCS1, acetyl-CoA synthase; ACO, aconitase; ACLY, ATP-citrate lyase; BKT, β-ketothiolase; CS, citrate synthase; GDH, glutamate dehydrogenase; HBDH, β-hydroxybutyrate dehydrogenase; HMGR, β-hydroxy-β-methylglutaryl-CoA reductase; ICDH, isocitrate dehydrogenase; KDHC, ketoglutarate dehydrogenase complex; LDH, lactic dehydrogenase; NAA, N-acetyl-aspartate; NAT, aspartate N-acetyltransferase; PDHC, pyruvate dehydrogenase complex; Other abbreviations: AcAc, acetoacetate; BHB, β-hydroxy-butyrate; F.A., fatty acids; GLUT, glucose transporters; HA-DCT, high-affinity dicarboxylate transporter; MCT, monocarboxylate transporters; SLC25A1, mitochondrial carrier family.
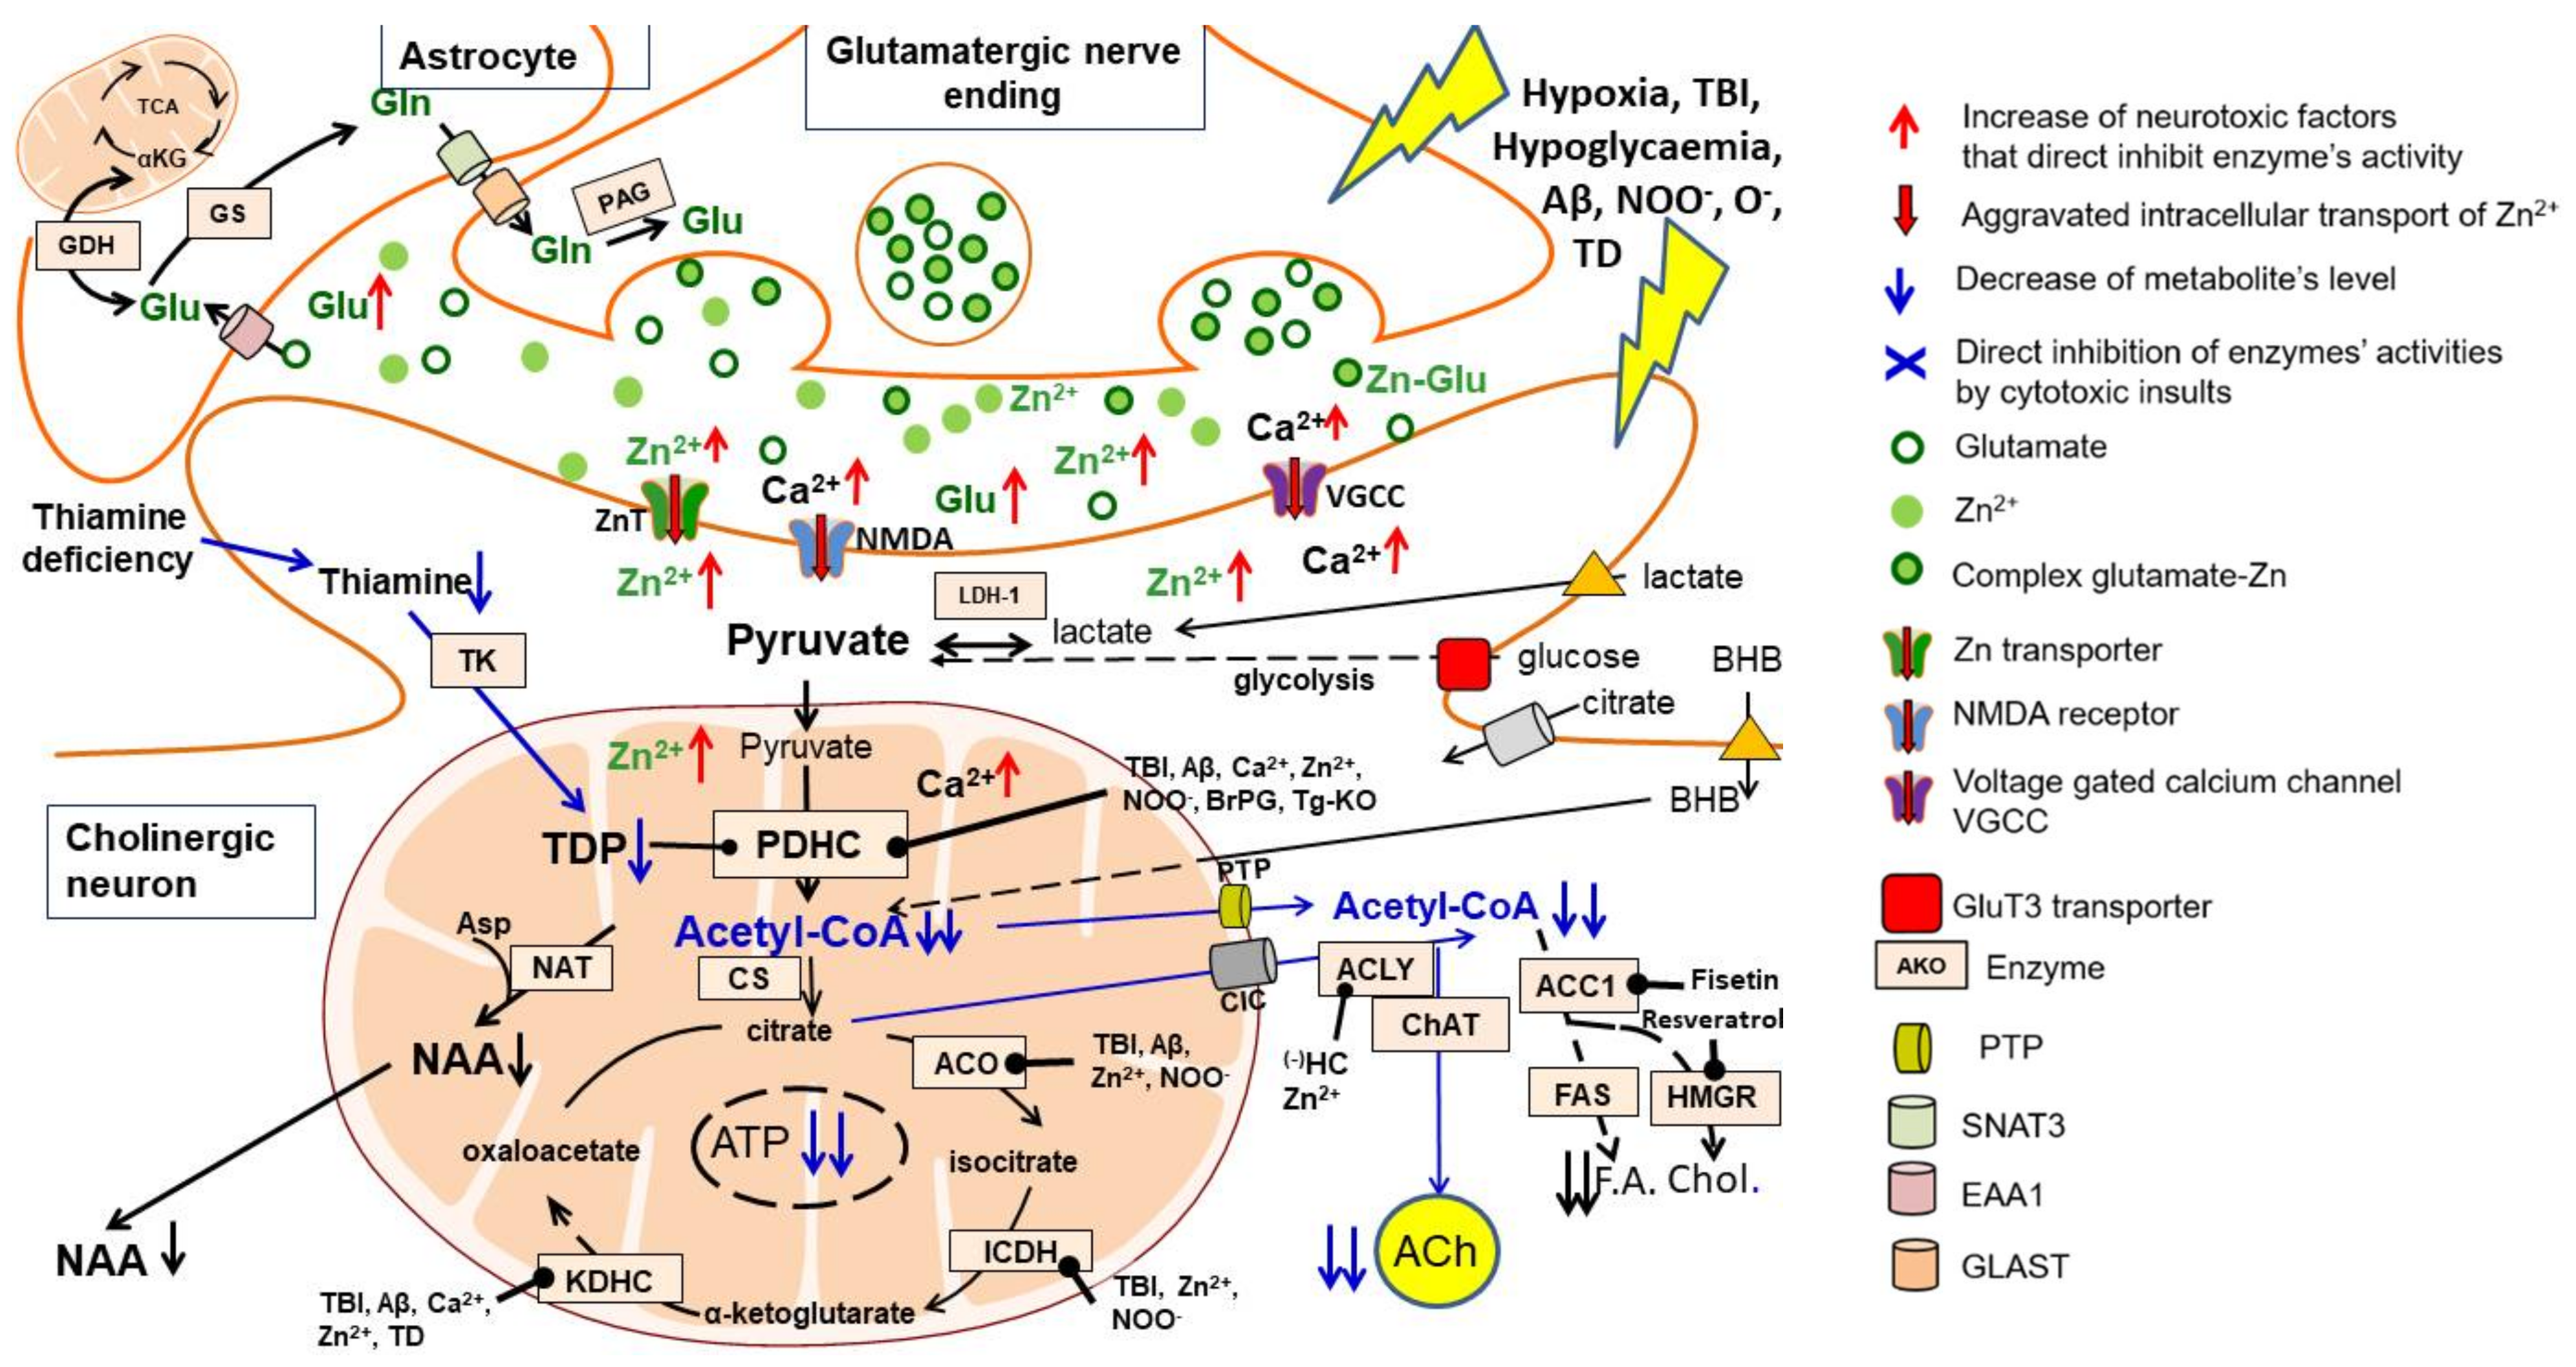
Figure 2. Excitotoxity-linked mechanisms of acetyl-CoA deficits in cholinergic neuron injury. Pyruvate is the final product of the glycolytic pathway and also the main precursor of acetyl-CoA generated in neuronal mitochondria by a PDHC-catalysed reaction. Pathologic signals associated with AD and other cholinergic encephalopathies, such as excessive synthesis/accumulation of Aß, episodes of hypoxia/hypoglycaemia and TBI, lead to prolonged depolarisation and excitotoxic stimulation of glutaminergic terminals releasing an excess of glutamate and Zn. This causes increased accumulation of zinc and calcium ions in postsynaptic neurons, stimulating the synthesis of oxygen and nitrosyl free radicals. All these cytotoxic signals directly inhibit PDHC activity. As a result, the synthesis and utilisation of acetyl-CoA in the TCA cycle is reduced, resulting in inhibition of ATP and NAA synthesis. There is also a reduction in acetyl-CoA transport out of mitochondria and the inhibition of hundreds of transacetylation reactions in the neuronal cytoplasm, endoplasmic reticulum and nucleus (see Figure 4). In cholinergic neurons, a significant fraction of the cytoplasmic acetyl-CoA pool is utilised for the synthesis of the neurotransmitter ACh. This process is facilitated due to the formation of an ACLY-ChAT complex. However, this additional need for acetyl residues makes cholinergic neurons more sensitive to neurotoxic signals than neurons of other neurotransmitter systems. TDP deficits increase the permeability of neuronal plasma membranes for Zn, Ca and other cytotoxic compounds leading to aggravation of their inhibitory effects on the PDHC and other enzymes of acetyl-CoA metabolism. The supply of alternative precursors of acetyl-CoA, such as lactate, BHB or acetate, may provide additional amounts of this metabolite, bypassing the PDHC and glycolytic pathway. Thereby, they may in part overcome deficit of pyruvate-derived acetyl-CoA. Moreover, inhibition of acetyl-CoA utilisation for lipid synthesis may preserve its pool for key energy-producing pathways. Abbreviations: Enzyme names in the boxes: ACC1, acetyl-CoA carboxylase 1; ACO, aconitase; ACLY, ATP-citrate lyase; ChAT, choline acetyltransferase; CS, citrate synthase; FAS, fatty acid synthetase; GDH, glutamate dehydrogenase; GS, glutamine synthetase; HMGR, β-hydroxy-β-methylglutaryl-CoA reductase; ICDH, isocitrate dehydrogenase-NADP; KDHC, ketoglutarate dehydrogenase complex; LDH, lactic dehydrogenase; NAT, aspartate N-acetyltransferase; PAG, phosphate activated glutaminase; PDHC, pyruvate dehydrogenase complex; TK, thiamine kinase; Other abbreviations: ACh, acetylcholine; Chol., cholesterol; F.A., fatty acids; NAA, N-acetyl-aspartate; SNAT, sodium-coupled neutral amino acid transporter; EAA, excitatory amino acid transporter; GLAST, glutamate and aspartate transporter. Blue arrows, decrease; red arrows, increase; black arrows with dot, inhibition.
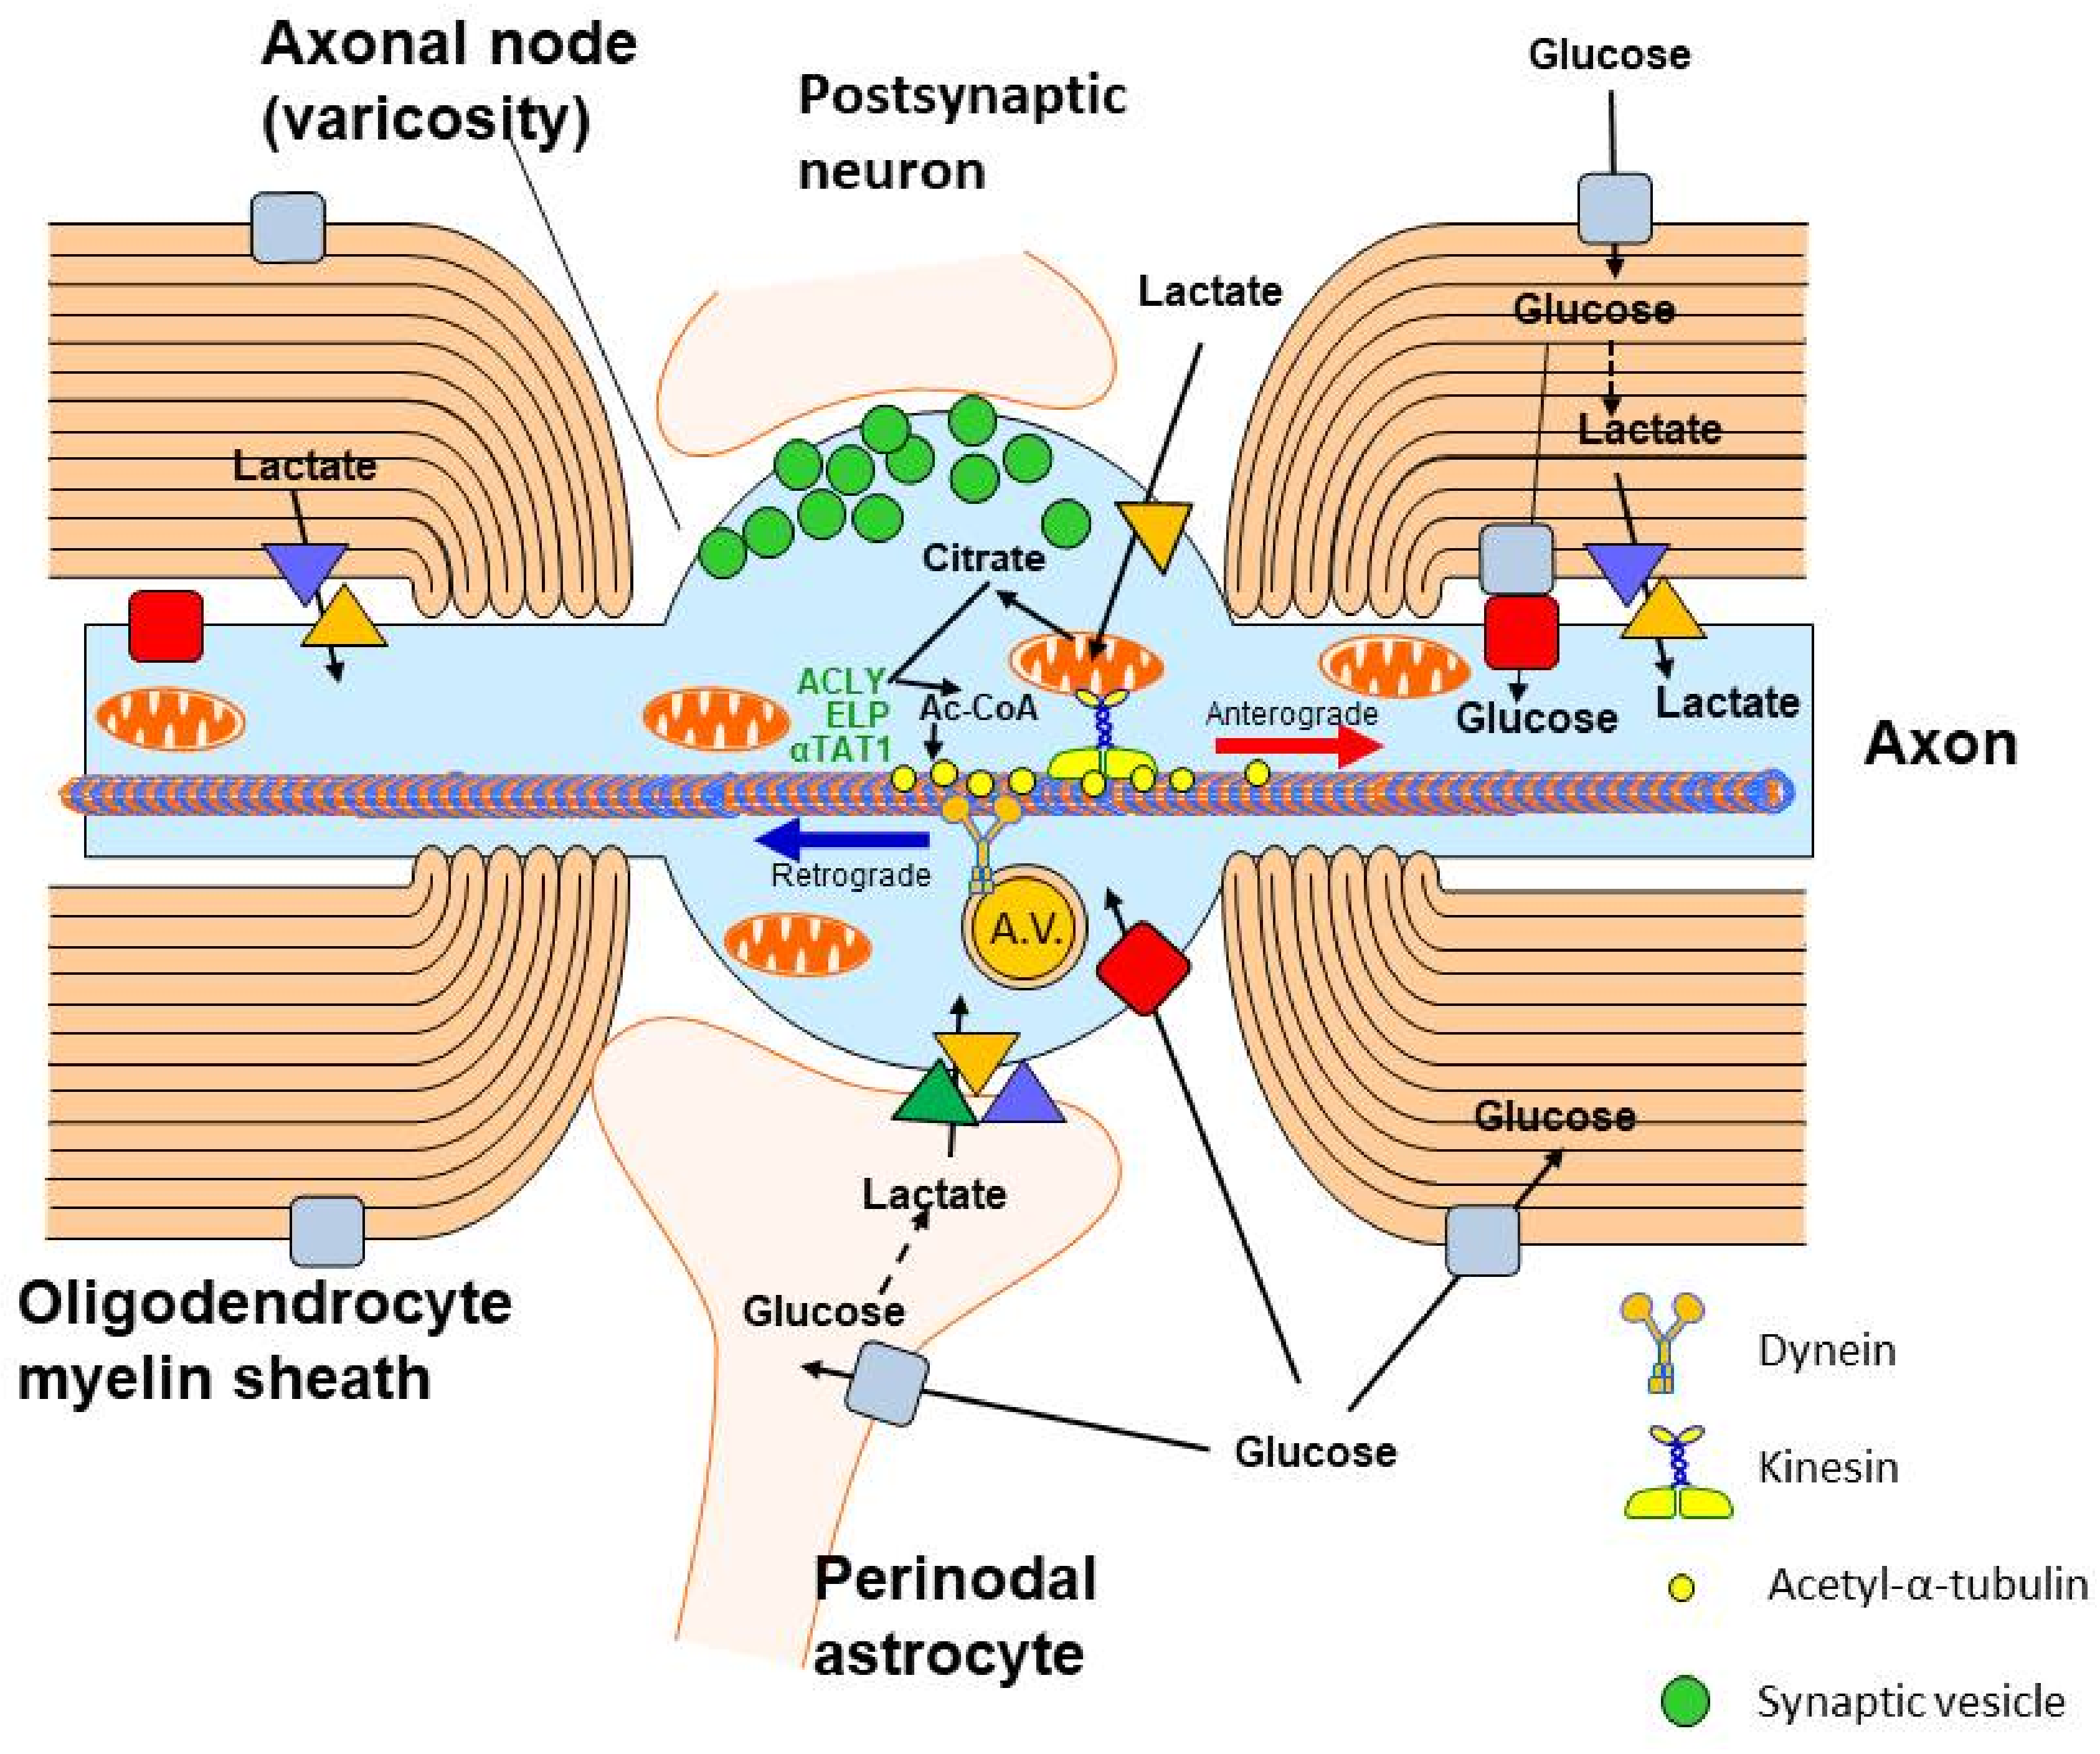
Figure 3. Acetyl-CoA metabolism in axonal neuron compartment. Glucose is transported to the axons through GLUT3. The lactate is taken up by MCT2 from extracellular space and from astrocytes adjacent to axonal nodes or from oligodendrocyte myelin sheaths through MCT1/MCT4. Acetyl-CoA generated in axonal mitochondria is transported to axonal cytoplasm by ATP-citrate lyase (ACLY), which forms the complex with elongator protein (ELP) and α-tubulin acetyltransferase 1 (αTAT1), which acetylates α-subunit of tubulin. Acetylation increases the rate of anterograde neurotubular transport of mitochondria, proteins and other compounds by the kinesin complex to support the function of nerve terminals. On the other hand, metabolic wastes are transported retrogradely by dynein within axonal vesicles (A.V.). Axonal nodes are also neurotransmission sites forming synapse with the dendritic spines of other neurons.
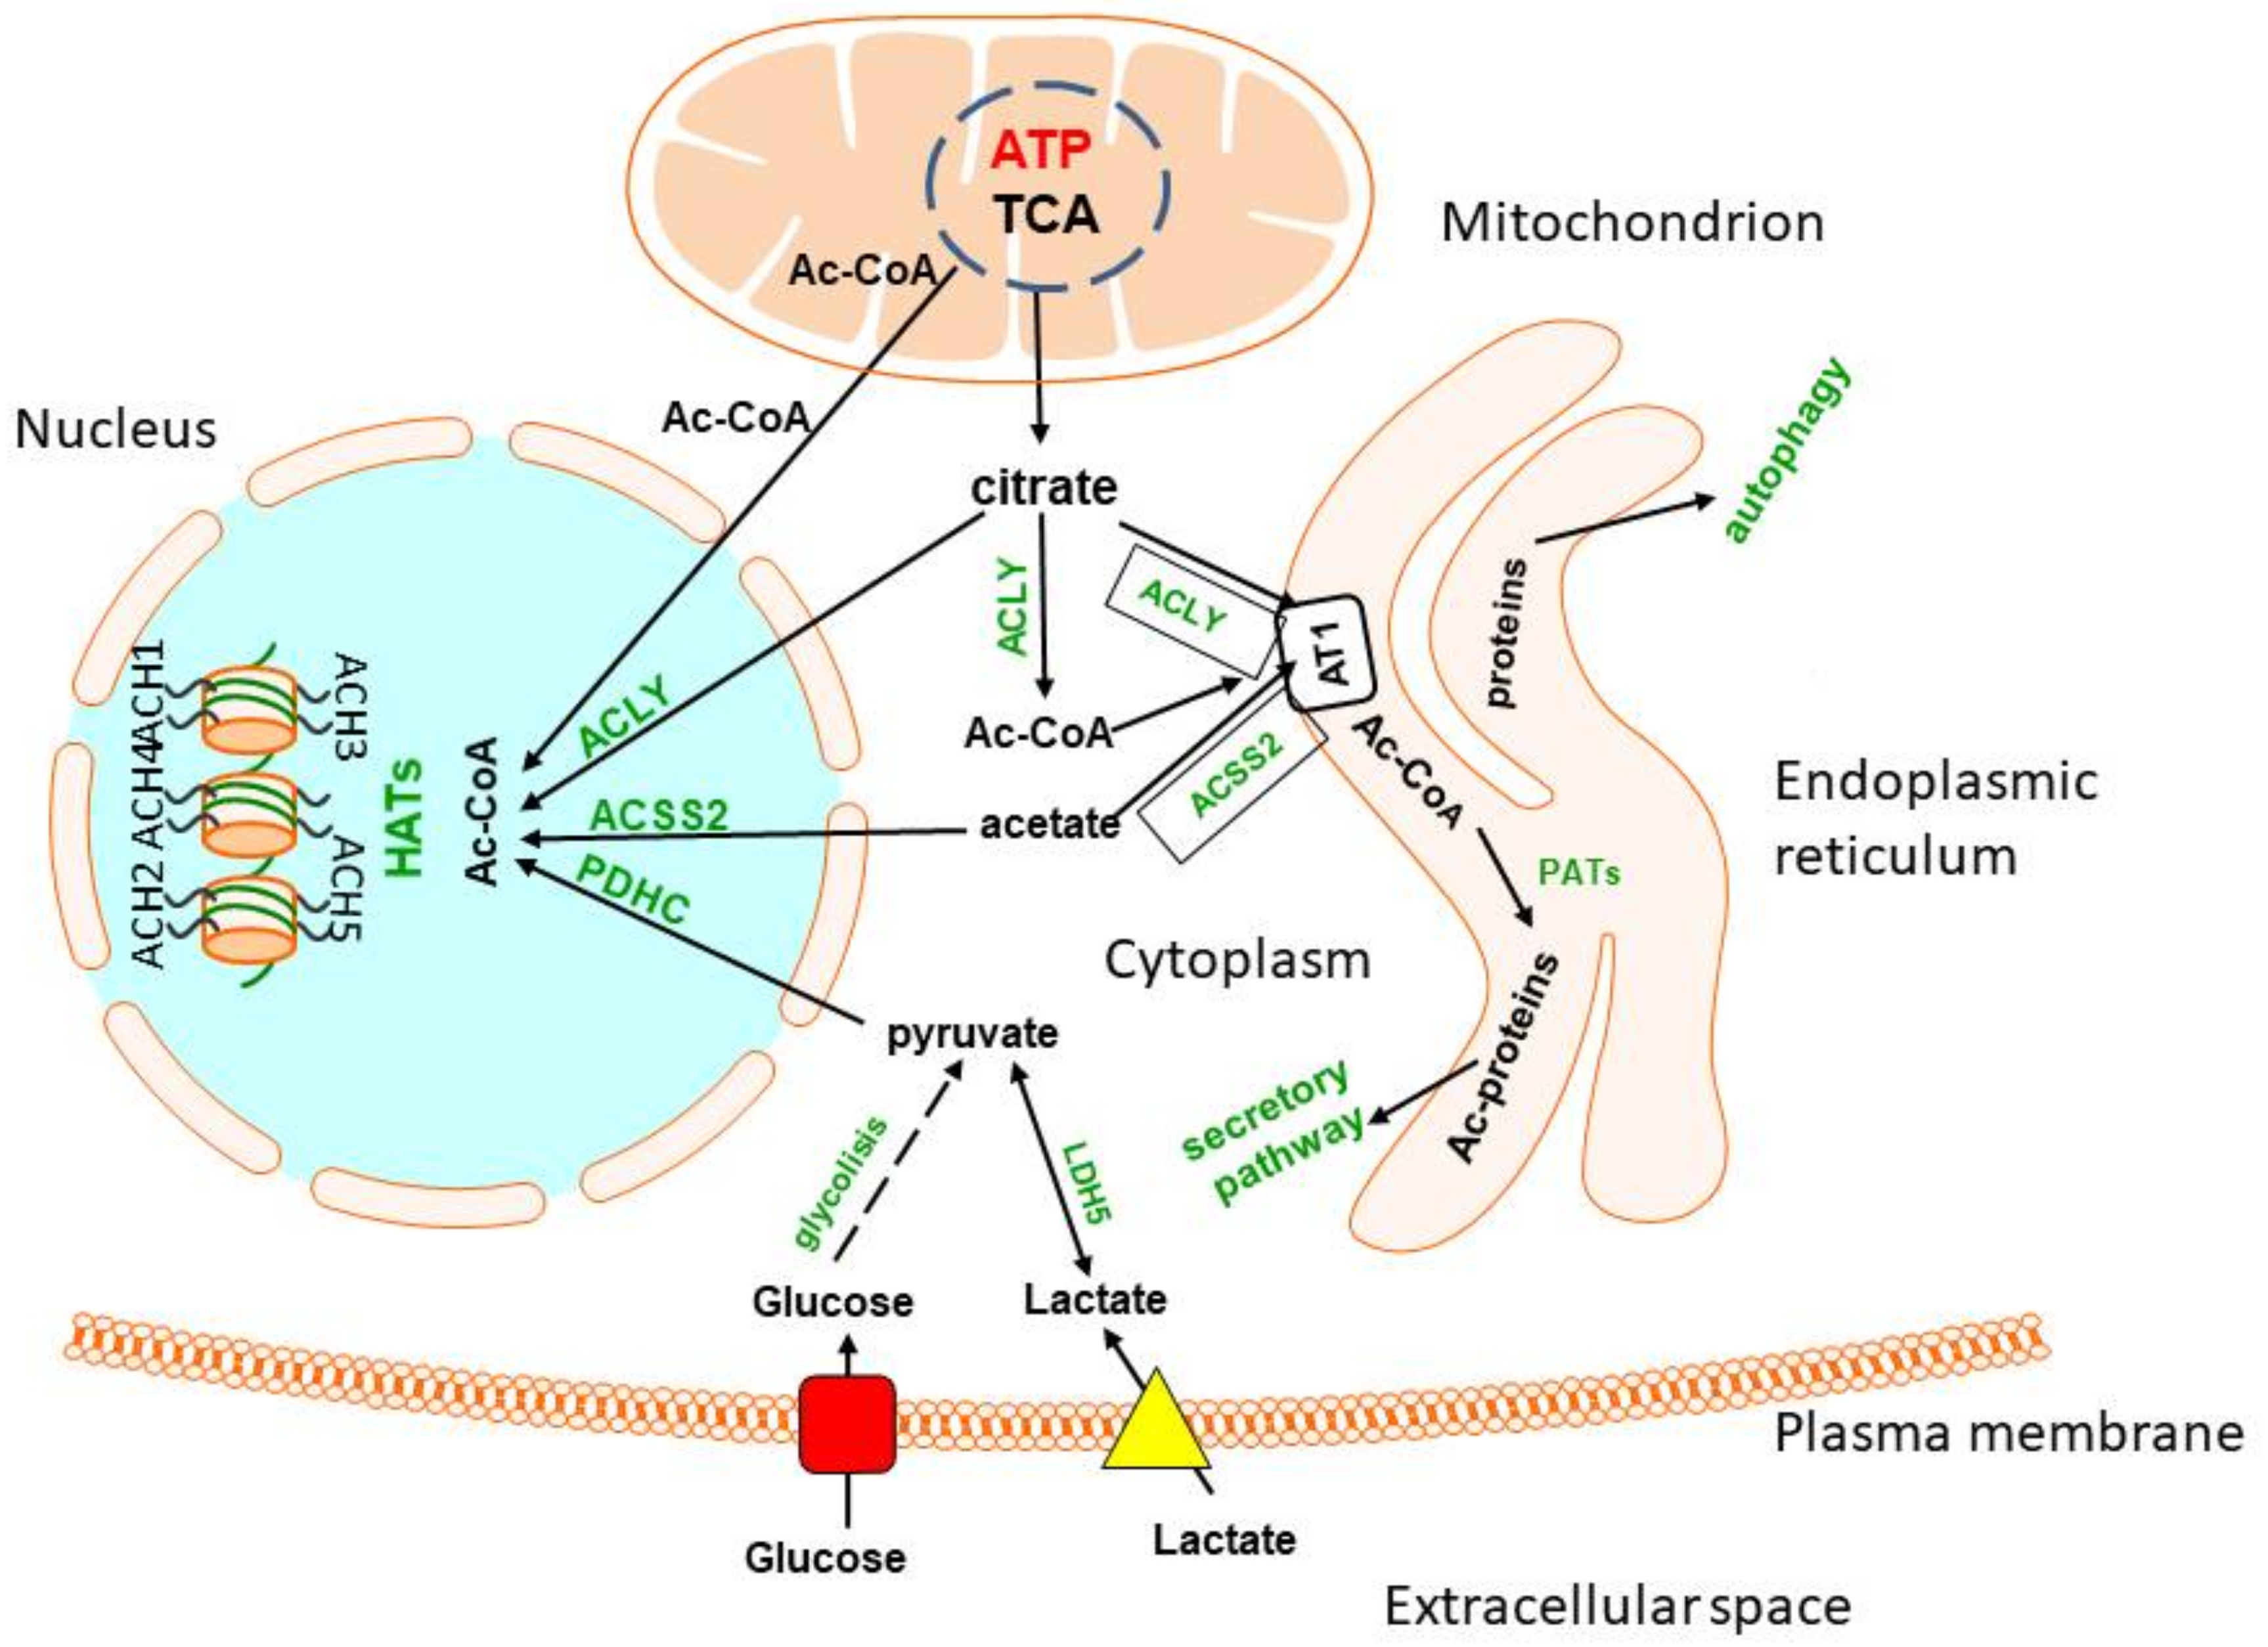
Figure 4. Acetyl-CoA metabolism in endoplasmic reticulum and nucleus. Acetyl-CoA is transported from the cytoplasm to endoplasmic reticulum by the acetyl-CoA transporter 1. It may be taken up directly from cytoplasm or generated by ACLY or ACSS2, forming functional complexes with AT1. Structurally competent proteins are then acetylated in ER lumen by protein acetyltransferases and released by a secretory pathway. Misfolded and damaged proteins are directed to autophagosomes. The nuclear membrane is fully permeable to cytoplasmic acetyl-CoA. However, some amounts of this metabolite are synthesised within the nucleus by ACLY, ACSS2 or PDHC from respective precursor metabolites. They provide acetyl-CoA directly to HATs, which acetylates multiple histones, thereby regulating expression of different parts of the genome.
Acetyl-CoA is also the substrate for hundreds of acetylation reactions catalysed by diverse acetyltransferases of different specificity, which can be found in each cellular sub-compartment. Products of acetylation include N-acetyl-aspartate and other acetylated amino acids and amines, such as acetylcholine, diverse acetylated proteins, carbohydrates and lipids, located in different cellular and subcellular compartments of the brain in concentrations varying from 10−2 to 10−9 mol/L. Acetyl-CoA is also the key substrate for the synthesis of structural and metabolic pools of fatty acids, cholesterol, phospholipids and other lipids. They are indispensable for neuronal myelinisation, cell growth, remodelling and maintenance of cellular membrane integrity [9][10]. Acetyl-CoA itself may also directly regulate rates of diverse acetylating pathways in a concentration-dependent manner. It also reciprocally affects its availability in various subcellular and cellular compartments of the brain [11][12] (Table 1). Thereby, acetyl-CoA should be considered as a branching point between the catabolic energy-providing TCA cycle and multiple acetyltransferases synthesising acetylated derivatives. It is not only the metabolic substrate, but it also plays the second messenger role and takes part in phenotypic and genotypic modifications connected with basic functions of the brain, as well as with its maturation and aging [13][14][15][16] (Figure 1).
However, in the past century, reports on direct assessments of acetyl-CoA in the brain have been scarce due to complicated assay methods [17][18][19]. Recently, several publications described and discussed regulatory mechanisms of intercellular metabolic fluxes of glucose and other acetyl-CoA precursors, as well as their role in prevention against neurotoxic insults and exerting neuroprotective effects in humans and animal models of diverse brain pathologies [5][6][14]. The apparent diversity of acetyl-CoA metabolic pathways in the brain results from the existence of several distinct neuronal neurotransmitter systems, as well as astroglial, oligodendroglial and microglial cells and their specific functional status in a given region. The intracellular acetyl-CoA is unevenly distributed among mitochondrial, cytoplasmic, endoplasmic reticulum, nuclear and axonal sub-compartments [6][14]. This is due to the relative impermeability of intracellular membranes including specific carriers for this metabolite [14][15]. Alterations of the acetyl-CoA level in mitochondrial and cytoplasmic compartments have been shown to regulate viability and cholinergic neurotransmission of cholinergic septal SN56 cells. Cholinergic neurons of the basal forebrain are responsible for multiple cognitive functions, including working, episodic and spatial memory, learning, attention, behavioural phenomena and sensory information assuring selectivity and precision [6][13][14][20] (Figure 2).
2. Glucose and Lactate—The Key Precursors of Brain Acetyl-CoA in Health and Disease
Glucose is a principal energy source that fuels 95% of ATP synthesis in the brain. Its transport from blood plasma through the blood–brain barrier into brain extracellular space is carried out by the specific, high-capacity, average-affinity 55 kD GLUT 1 transporter located on the outer side of vascular endothelium. Its constant affinity for glucose is equal to about 8 mmol/L. It achieves an inward transport rate dependent on systemic glucose concentration, diurnal physiologic variations of which may be in the range of 3.5–10 mmol/L. The density of 55 kD GLUT1 on the blood–brain barrier (BBB) capillaries is inversely regulated by glucose concentration in the plasma. Chronic hyperglycaemia results in an adaptative decrease in 55 kD GLUT1 density on the BBB, which reduces glucose transport into the brain [21][22][23]. In turn, in chronic hypoglycaemia, hypoxia and several acquired and congenital metabolic diseases, the density of 55 kD GLUT1 increases, adjusting in part the rate of inward transport of glucose to these conditions [24][25]. Upregulation of GLUT1 is mediated by the phosphatidylinositol-3-kinase, AMP-activated protein kinase, cAMP response element–binding protein and hypoxia inducible factor pathways. On the other hand, the mitogen-activated protein kinase pathway downregulates GLUT 1 and 3 expression [25]. Such mechanisms tend to reduce concentration-dependent fluctuations in the rate of glucose transport into the brain. In fact, some of those patients display good tolerance to hypoglycaemia (Figure 1).
Neurons take up glucose from extracellular brain space mainly by the high-affinity GLUT3 transporter with Km about 2.8 mM, which may secure its appropriate supply in moderate hypoglycaemia [21][23]. Pyruvate derived from glycolysis or from oxidation of exogenous or endogenous lactate may serve as a direct precursor of neuronal acetyl-CoA. Lactate is released from astroglial or oligodendroglial cells by MCT4 transporters with low affinity (Km 22–28 mM) for lactate and transported into neuronal cell body axons and presynaptic terminals, respectively. Neurons express high-affinity MCT2 transporter with Km for lactate and pyruvate equal to 0.5–0.75 and 0.08 mmol/L, respectively; this promotes the direction of lactate/pyruvate transport toward neuronal cells [23][26][27]. Such direction of metabolic flow is also facilitated by the fact that LDH-1 isoform, which is primarily expressed in neurons, oxidises lactate to pyruvate, whereas the LDH-5 isoform expressed in astrocytes promotes the reduction of pyruvate to lactate. Despite their distinct distribution, LDH-1 and LDH-5 do not directly modulate the lactate flow between neurons and astrocytes [6]. Nevertheless, LDH5 would facilitate lactate accumulation and its subsequent release from astroglia, whereas LDH1 would support the metabolism of lactate directly towards pyruvate and its oxidative decarboxylation (Figure 1).
However, in vivo lactate cannot replace glucose entirely as an energy precursor either in physiological or in pathological conditions. Lactate at high-physiologic 1 mmol/L concentration can substitute only about 10% of glucose. However, during lactic acidosis evoked by intensive exercises, hypoxia, diabetes, chronic obstructive lung disease, disseminated cancer or inherited metabolic diseases, blood lactate may reach 10 mmol/L and higher concentrations and replace up to 25% glucose in acetyl-CoA and energy production [28]. On the other hand, cultured primary neurons and neuronal stem cells survived in glucose-free medium in the presence of lactate as the only energy substrate [29]. Moreover, SN56 cholinergic neuronal cells utilising pyruvate with malate as sole energy substrates retained stable levels of acetyl-CoA and structural integrity [14].
Various types of neurons and glial cells may respond differentially to the same neurotoxic conditions. For instance, in chronically hypoxic BV2 microglial cells, the acetyl-CoA level was three times higher than in normoxic ones [30]. This apparent inconsistency was explained by a hypoxia-induced increase in mRNA and protein levels of hexokinase 2 (HK2, EC 2.7.1.1), yielding activation of the glycolytic pathway. This led to the rise of pyruvate synthesis, which through the PDHC provided more acetyl-CoA for acetylations of nuclear histones 3 and 4 [31][32][33]. Acetylated histones induced the inflammatory phenotype in BV2 by elevating proinflammatory gene expression followed by augmentation of CD11 and IL-1β levels. Inhibition of HK2 or PDHC activities by their specific inhibitors, lonidamine or 3-bromopyruvate, decreased acetyl-CoA levels and alleviated proinflammatory responses of cultured BV-2 microglial cells. Similar effects were observed after knockdown of HK2 with specific siRNA, but not after suppression of HK1 and HK3. This proves that only the increase in HK2 expression was responsible for the over-activation of BV2 cells. In addition, in in vivo experiments, suppressed activity of microglial HK2 by pretreatment with lonidamine reduced the size of ischemic injury in the rat brain in the middle carotid artery occlusion model (MCAO) [29]. MCAO followed by 40 min of hypoxia in 9-day-old neonatal mice after 24 h brought about a decrease in PDHC activity but no changes in the acetyl-CoA level in crude mitochondrial fraction. Animals pretreated with dichloroacetate (DCA), a pyruvate dehydrogenase kinase (PDK, EC 2.7.11.2) inhibitor, showed increased activity of the PDHC and levels of acetyl-CoA above the control values, as well as reduced cell apoptosis [34] (Table 1). MCAO-induced failure of energy metabolism in the brain is claimed to be overcome with application of Shengui Sanhseng San extract [35] (Table 1). This preparation has been used for over 300 years by Traditional Chinese medicine to treat stroke. It consists of a mixture of rhizome and roots of three plants. Its application for 7 days to MCAO animals increased, in a dose-dependent manner, the density of GLUT1 and 3 and the levels of pyruvate, citrate, acetyl-CoA and ATP and decreased phosphorylation of E1 subunit PDHC in the post-ischemic region of the brain [35]. A pleiotropic, neuroprotective effect of resveratrol preconditioning was also reported. It increased ischemic tolerance in in vivo and in vitro models [36][37]. Neuronal–astrocytic co-cultures obtained from 14 d resveratrol-treated mice displayed increased expression of mitochondrial pyruvate carriers and citrate synthase levels, yielding an increase in citrate and ATP synthesis and a delay of excitotoxic injury during oxygen–glucose deprivation [36]. Such conditions increased the passage of citrate into the nucleus, which augmented its conversion to acetyl-CoA by nuclear ACLY and activated acetylation of histones H3K9ac and H4K16ac by HAT [36]. It should be emphasised that, although the presented data strongly suggested the involvement of acetyl-CoA in resveratrol-mediated neuroprotection, no direct findings concerning its mechanisms have been presented [36][37] (Figure 1).
On the other hand, modest inhibition of PDHC activity in cultured N9 microglial, C6 astroglial and primary glial cells by 0.15 mmol/L Zn or NO excess brought about no significant decreases in their acetyl-CoA/ATP levels or their viability [11][38][39]. On the contrary, under similar culture conditions, Zn caused over 50% suppression of PDHC activity and acetyl-CoA content in differentiated cholinergic SN56 neuronal cells (Table 1). These alterations were accompanied by a significant loss in rates of ACh synthesis/release and neuronal viability [11][39][40]. The presented data indicate that adaptive overexpression of glycolytic pathway in glial cells, after hypoxic insult, may overcome inhibition of acetyl-CoA synthesis caused by suppression of PDHC activity due to provision of additional amounts of pyruvate [30]. Another cause of relative resistance of neuroglia to neurotoxic conditions may be their lower energy demands for maintenance of plasma membrane potential and non-utilisation of acetyl-CoA for neurotransmitter or NAA synthesis [11][14][30]. On the other hand, energy requirements for neurons are much higher than those for glial cells. Therefore, inhibition of PDHC activity exerted deeper suppressive effects on acetyl-CoA content and viability in neuronal than in glial cells [38][39] (Table 1).
There are data showing that disturbances in brain Zn homeostasis may be the primary cause of neurodegeneration. Open-head traumatic injury of the brain cortex caused immediate hyperglycaemia lasting up to 3 h, followed by severe hypoglycaemia in both male and female rats. In the ninth post-trauma hour, loss of respiratory control was observed in isolated brain mitochondria, along with suppression in acetyl-CoA and ATP levels in the peri-contusional ipsilateral cortex of male rats [41] (Table 1). These changes could be evoked by excitotoxic effects of Zn released in excess from impaired presynaptic terminals [42][43]; then, Zn was taken up by postsynaptic neurons causing the inhibition of the PDHC and several enzymes of the TCA cycle, ultimately leading to their death [39][44][45]. These pathologic alterations could be corrected by early i.v. infusion of lactate or a delayed one of BHB that maintained their stable blood concentrations of 1.2 and 2.0 mmol/L, respectively. In female rats, contusion brought about inhibited respiration rates but no changes in acetyl-CoA and ATP levels. Early infusion of 2 mol/L BHB increased acetyl-CoA and ATP over control levels, whereas 100 mmol/L lactate was without effect. On the contrary, early infusion of BHB appeared to be harmful, resulting in severe decreases in acetyl-CoA and ATP levels in peri-contusional tissue. This indicates that, in traumatic brain injury, therapeutic i.v. applications of BHB or lactate as complementary to glucose direct precursors of acetyl-CoA should consider the post-trauma time and sex of the patient to avoid negative side effects of such treatment [41]. However, there is no rational explanation for post-trauma time and sex-linked differences in the beneficial or harmful effects of exogenous lactate or HB on acetyl-CoA-mediated post-traumatic recuperation of the brain. Nevertheless, irrespective of the particular pathomechanism, the beneficial effects of lactate or BHB were accompanied by an increase in the whole tissue acetyl-CoA level, indicating a key role of this intermediate in brain healing [40]. Such a thesis is supported by the results of clinical trials that revealed beneficial effects of infusion hyperosmic sodium lactate, being a direct acetyl-CoA precursor. It bypasses glycolysis as the ATP consuming pathway and alleviates reperfusion injury in patients after focal cerebral ischemia [46]. The positive influences of hypertonic lactate infusion in brains of TBI patients or those with acute cardiac failure may be extended beyond its role as an alternative energy precursor, as it is also an anti-oedematous agent, scavenger of free radicals, Zn/Ca chelator and suppressor of reperfusion-evoked glutamate/Zn/NO excitotoxicity [46][47]. For obvious reasons, the effects of lactate/HB on the acetyl-CoA status in injured brains were not investigated in humans.
Cardiac arrest is a prevalent cause of death worldwide. Cardiopulmonary resuscitation has improved survival, but many patients die soon after due to anoxic brain injury and cardiac instability [48]. In rats subjected to 6 min anoxia and then resuscitated, intraperitoneal injection of dichloroacetate (DCA) caused a two-fold increase in the survival rate and alleviated neurological deficits during the 72 h post-resuscitation period. DCA decreased levels of proinflammatory IL-1β and TNF-α and blood lactate concentration, along with partial restoring decreased PDHC activity and ATP and pyruvate levels in the hippocampus and brain cortex [48]. The inhibition of the PDHC may be caused by an increase in intraneuronal Ca levels due to its excessive influx through voltage-gated calcium channels and NMDA receptors in depolarised plasma membranes. Ca excess activated PDK, yielding inhibitory phosphorylation of the E1 PDHC subunit [49][50]. These data suggest that the beneficial effects of DCA resulted from the inhibition of PDK, yielding the dephosphorylation of the E1 subunit and an increase in PDHC activity, followed by increases in pyruvate oxidation and acetyl-CoA and ATP levels [48][49][50]. Moreover, in mice, therapeutic hypothermia or DCA application inhibited the PDK and reactivated the PDHC, improving outcome after cardiac arrest [51]. Cardiac arrest in mice lasting 8 min followed by cardiopulmonary resuscitation resulted in a rapid and deepening-with-time decrease in thiamine diphosphate (TDP) and ATP levels in the brain cortex, resulting in a high rate of animal mortality. This was due to phosphorylation-induced inhibition of PDHC activity, yielding a deficit of acetyl-CoA in neurons [46][52]. Daily i.v. supplementation of thiamine increased TDP and ATP levels in brains, decreasing the rate of animal mortality [52]. Moreover, in humans, cardiac arrest caused a marked acute decrease in PDHC activity in mononuclear blood cells, which was partially restored within 72 h after resuscitation. In addition, 30 min of severe hypoglycaemia in rats after 7 days brought about a several-fold increase in PDK2 and inhibition of PDHC activities in the brain, causing extensive neuronal death, along with activation of astroglia and microglia [53]. These pathologic alterations were alleviated in part by injections of DCA. In summary, these data prove that the PDHC is a common target for several neurodegenerative signals. Therefore, maintenance of the activity of this complex should be considered as the potential goal for neuroprotective interventions. Moreover, these data suggest that the inhibition of PDK or an increase in thiamine supplementation may benefit neuroprotective treatment of patients after cardiac arrest [51][52].
Other in vivo experiments revealed mechanisms that may partially compensate for shortages of acetyl-CoA evoked by deficits of the PDHC. In brain-specific heterozygotic Pdha1 knockdown mice, PDHC activity was reduced by 68%, but the acetyl-CoA level was not significantly decreased against wild-type controls [54] (Table 1). Such a discrepancy may be explained by the compensatory activation of the ACSS1 pathway, which increased acetate incorporation into acetyl-CoA in animal brains. Systemic administration of acetate to PDHC-deficient mice stimulated metabolic flux through the TCA cycle and normalised glutamatergic neurotransmission, yielding suppression of gamma oscillations and epileptiform discharges [54][55]. Beneficial effects of dietary supplementation with glyceryl triacetate—as a source of acetate—were also observed in an experimental autoimmune encephalomyelitis (EAE) mouse model of multiple sclerosis. Such treatment prevented the loss of ethanolamine, phosphatidyl choline and cholesterol in the myelin of EAE mice compared to EAE controls treated with water [56]. These data suggest that exogenous acetate or its donors may be used as a complementary precursor of acetyl-CoA, bypassing the PDHC step, to increase lipid deposition in oligodendrocytes and neurons impaired by demyelinating diseases [56] (see chapter 6 for details). Such a conclusion is supported by the finding that, in mice with specifically deleted Pdha1 gene, Schwann’s cells and brain oligodendrocytes retain capacity for myelinisation. This may be caused by the existence of compensatory overexpression of the ACSS1 pathway providing acetyl-CoA, which bypasses the PDHC step in oligodendrocytes [54][57]. On the other hand, animals with Pdha1 deletion in all brain cells displayed reduced fibre density and signs of axonal degeneration. This suggests that acetyl units in PDHC-deficient oligodendrocytes are provided by adjacent PDHC-competent astroglial and neuronal cells [54][57].
TBI suppressed PDHC expression in the peri-contusional area, and the rate of this decline depended on the potency of the impact. Mild or severe TBI brought about differential effects on genes expression, protein levels and the activities of several enzymes linked with energy production [58] (Table 1). Mild TBI within 5 days post-trauma caused increases in gene expression of catalytic E1, E2 and E3 PDHC subunits, along with decreases in PDK and gradual, delayed increases in PDP expression. Such a profile of PDHC subunits would be compatible with a stable level of acetyl-CoA in a mildly insulted brain. On the other hand, severe TBI did not affect expression of PDHC catalytic subunits but strongly suppressed PDP (down to 5% of controls) and elevated PDK gene expression. Such a pattern promoted inhibition of the PDHC E1 subunit due to PDK-dependent inhibitory phosphorylation [50]. Accordingly, marked decreases in acetyl-CoA/CoA-SH levels were found in cases of severe TBI [58]. Hence, post-traumatic differential changes in brain acetyl-CoA levels in severe vs. mild TBI result from variations in phosphorylation/dephosphorylation levels yielding the inhibition or activation of the PDHC, respectively. A higher level of acetyl-CoA may be a predictive marker for positive outcome following TBI [58].
Inhibition of energy metabolism is an early sign of mitochondrial dysfunction in AD and other neurodegenerative diseases; it is caused by decreases of activities or expression of the PDHC, KDHC and some other mitochondrial enzymes of the TCA cycle evoked by accumulating Aβ and hyperphosphorylated tau [59][60]. Aβ1-42 in sub-micromolar concentrations was found to inhibit activities of the PDHC and KDHC in vitro in synaptosomes isolated from the brain of WT rats or in synaptosomes from 2756 Tg AD mice and in clonal neuronal cells [14][61][62]. However, contradictory results were presented by Gandbhir and Sundaram [63]. They showed that a relatively high 0.004 mM concentration of pre-aggregated Aβ1-42 markedly increased levels of PDHC and KDHC proteins, causing tau hyperphosphorylation and impairment of the SH-SY5Y cholinergic cell line. These effects were partially reversed by AmyTrap, a homo-tetrameric peptide synthesised from D-amino acids, which could remove Aβ1-42 from neuronal cells [63]. However, it remains unknown as to how Aβ-induced increases of PDHC and KDHC expression resulting in elevations of acetyl-CoA and ATP levels could exert neurotoxic effects. These data contradict the well-documented view that high levels of ATP and acetyl-CoA are markers of the wellbeing of neurons and other cells [13][14][15][53][64]. For an explanation of this discrepancy, determinations of in situ enzyme activities, as well as estimations of ATP and acetyl-CoA levels in different culture conditions, are necessary. Such information is indispensable in light of the claimed therapeutic potential of the AmyTrap compound [63].
Table 1. Levels of acetyl-CoA in different brain compartments in various experimental models of brain pathologies.
| Experimental Model | Signal/Conditions | Acetyl-CoA Level/Relative Change | Reference/Comments |
|---|---|---|---|
| Rat brain | Hypoxia in vivo | Whole tissue (nmol/g tissue) | [17] |
| Control | 5.4 | ||
| Hypoxia 100N2 90 s | 6.7 ** | ||
| Rat brain | Brain region (whole tissue) | Whole tissue (nmol/g tissue) | [65] |
| Thalamus | 9.1 | ||
| Hippocampus | 7.1 | ||
| Cortex | 6.2 | ||
| Cerebellum | 6.1 | ||
| Rat brain slices | 60 min. incubation 31.2 mM K+ | Brain slices (nmol/g tissue) | [18] |
| Control | 5.04 | ||
| +3-bromorypuvate 0.25 mM | 2.45 | ||
| Rat brain synaptosomes | 30 min. incubation 30 mM K+ | Synaptosomes Mitochondria Cytoplasm |
[19] |
| (pmol/mg protein) | |||
| Control | 12.3 46.8 | ||
| +3-bromopyruvate 0.25 mM | 0 7.4 ** | ||
| Healthy adult rat brain synaptosomes | Healthy control | Whole synaptosomes (pmol/mg protein) | [66] different from pyruvate alone, † p < 0.05 |
| Substrate used (mM) | |||
| Pyr. 2.5 BHB 2.5 Pyr. + BHB | |||
| 24.3 7.1 22.8 | |||
| STZ diabetes 10 d | 31.3 * 10.5 * 29.4 * | ||
| Streptozotocin-diabetic rat brain synaptosomes | STZ diabetes 10 d + Insulin 5 d | 30.6 * 10.0 *† 35.6 *† | |
| Cholinergic neuroblastoma cell culture: nondifferentiated (NC) and differentiated (DC, db-cAMP 1 mM + retinoic acid (RA) 0.001 mM 48 h) | Control | Cellular compartment levels (pmol/mg protein) |
[67] from respective NC, † p < 0.05, †† p < 0.01 |
| Mitochondria Cytoplasm | |||
| NC DC NC DC | |||
| 71 22 † 13 50 † | |||
| +NGF 100 ng/mL 24 h | 55 42 ** 71 ** 29 *† | ||
| Native SN56TrkA-/p75NTR+ | Control | 95 23 † 13 49 † | |
| Tg T17 SN56TrkA+/p75NTR+ | +NGF 100 ng/mL 24 h | 59 * 39 * 129 ** 48 † | |
| Cholinergic neuroblastoma cell culture Tg T17 SN56TrkA+/p75NTR+ NC, and DC |
24 h cell culture with: |
Relative change against no addition control (%) |
[68][69] Different from respective NC, † p < 0.05, †† p < 0.01; from Aβ (25–35) alone, ‡ p < 0.05, ‡‡ p < 0.01 |
| Mitochondria Cytoplasm | |||
| NC DC NC DC | |||
| Aβ25-35 0.001 mM | 10 −23 −17 −58 ** | ||
| Acetyl-carnitine 0.1 mM | +39 ** 0 † 0 +54 **†† | ||
| Aβ + acetyl-carnitine | +22 ‡‡ 0 0 0 ‡‡ | ||
| ILβ 10 ng/mL | −11 −18 +38 * −42 *†† | ||
| Aβ + ILβ | −18 −1 +1 +3 ‡‡ | ||
| Cholinergic neuroblastoma cell culture | ChAT (nmol/min/mg protein) NC DC |
Whole cells (pmol/mg protein) NC DC |
[70] Different from respective native SN56, † p < 0.05, †† p < 0.01 |
| Native SN56 TrkA-/p75NTR+ | 0.22 0.79 *** | 31.2 21.9 *** | |
| Tg T17 TrkA+/p75NTR+ | 0.19 0.47 *** | 39.7 † 26.8 ***† | |
| Tg ChAT2 TrkA-/p75NTR+ | 3.80 ††† 6.80 ***††† | 15.5 †† 11.2 *** †† | |
| Cholinergic neuroblastoma cells Native SN56 TrkA-/p75NTR + DC |
24 h cell culture with: Control |
Mitochondria Cytoplasm (pmol/mg protein) |
[40] † different from ZnCl2 0.10 mmol/L |
| 11.8 20.9 | |||
| ZnCl2 0.10 mM | 9.3 19.6 | ||
| ZnCl2 0.15 mM | 11.4 13.5 *† | ||
| Cholinergic neuroblastoma cells Native SN56 TrkA-/p75NTR + NC and DC |
30 min incubation (protein free medium) with: Zn 0.1 mM |
Relative change vs. no Zn control (%) Mitochondria Cytoplasm NC DC NC DC −5 −35 ** −100 ** −80 ** |
[71] |
| Subcutaneous pyrithiamine (PT) 0.025 mg/kg b.w./day and thiamine free diet 14 d Rat forebrain synaptosomes |
PT synaptosomes vs. no PT control | Forebrain synaptosomesRelative change against no PT control (%) | [72] |
| Mitochondria Cytoplasm | |||
| No Ca Ca 1.0mM no Ca Ca1.0mM | |||
| −53 *** −35 *** −43 *** −24 * | |||
| Subcutaneous PT 0.025 mg/kg b.w./day and thiamine-free diet 14 d. Rat forebrain whole mitochondria | PT whole forebrain mitochondria vs. no PT control | Forebrain whole mitochondria Relative change vs. no PT control (%) |
[73] |
| No Ca Ca 0.01 mM ADP/HX | |||
| −62 *** −62 *** −52 *** | |||
| Cholinergic neuroblastoma cell culture Native SN56 TrkA-/p75NTR+ |
Thiamine-free culture medium 48 h +Amprolium 2 mM |
Relative change vs. no amprolium NC control (%) |
[74] Amprolium suppressed TPP level—28% vs. control |
| Mitochondria Cytoplasm. | |||
| NC DC NC DC | |||
| −43 −57 −58 *** −50 ** | |||
| Endoplasmic reticulum from WT and AT 1-1S113R/+ mice | Mutation AT 1-1S113R/+ | Acetyl-CoA transport (pmol/mg/5 min.) | [75] |
| WT 370 | |||
| AT-1S113R/+ 142 *** | |||
| N9 microglioma cells culture | 24 h culture with: LPS 0.01 µg/mL |
Relative change against respective no addition control (%) |
[38] ‡‡ different from SNP 0.4 mM, p < 0.01 ††† different from N9 cells, p < 0.001 |
| Whole cells | |||
| N9 SN56 | |||
| −23 * +4 | |||
| SynchronizedCholinergic neuroblastoma cells Native SN56 TrkA-/p75NTR+ DC |
SNP 0.4 mM | −3 −38 * | |
| LPS + SNP | −6 92 ***†††‡‡ | ||
| WT 14–16 mos mouse brain AβPP-Tg 2576 14-16 m mouse brain | Accumulation about 0.6 μM Aβ1-42 in Tg brain | Relative change vs. WT control (%) Mitochondria Cytoplasm ** |
[62] Acetyl-CoA—control WT mice Synapt. mitoch. 39 pmol/mg prot. Synapt. cytopl. 90 pmol/mg prot. Whole brain mitoch. 45 pmol/mg. |
| Forebrain synaptosomes | −44 ** −34 | ||
| Forebrain whole mitochondria | +5 - | ||
| WT mouse brain AT1 Tg mouse brain (overexpression) |
Hippocampus Isolated adult neurons H4 neuroglioma |
AT1 Tg vs. WT Relative difference (%) Cytoplasm |
[76] |
| −41 * | |||
| −45 * | |||
| −43 * | |||
| WT 9 d postnatal mouse brain | 24 h post hypoxia/ischemia | Relative change vs. control (%) Mitochondrial fraction Vehicle-treated DCA-treated +6 +27 * |
[34] |
| Cell line cultures WT SN56 TrkA-/p75NTR NC |
Intracellular Zn accumulation of 5 nmol/mg protein at extracellular Zn in culture medium: 0.125 mM |
Relative change vs. no Zn control (%) SN56 NC −54 *** |
[11] † different from NC, p < 0.05 |
| DC | 0.110 mM |
SN56 DC −48 ***† | |
| SHSY5Y dopaminergic neurons | 0.150 mM | SHSY5Y −31 * | |
| C6 astroglioma | 0.200 mM | C6 −44 ** | |
| 3XTg AD 16.5 mos mouse brain | 8 mos ketone ester-feeding | Relative change vs. non-ketotic control (%) Hippocampus +79 * |
[77] Acetyl-CoA no ketone control: 17 μmol/g tissue |
| Mouse BV2 microglial cells culture | Dimethylsulfoxide-induced 6 h hypoxia | Relative change vs. no hypoxia control (%) +79 ** |
[30] |
| Hypoxia + Lonidamine 0.05 mM | −58 * | ||
| Hypoxia + 3-Bromopuryvate | −42 * | ||
| Cholinergic neuroblastoma cells WT SN56 TrkA-/p75NTR+ DC |
30 min incubation (protein-free medium) with: Control Nifedipine 0.01 mM GVIA 0.0005 mM MVIIC 0.0002 mM |
Whole cells (pmol/mg protein) No Zn Zn 0.15 mM 30.5 13.8 * 30.7 29.2 † 28.8 21.6 *† 28.1 20.5 *† |
[78] Compounds used here are inhibitors of different types of calcium channels. * p < 0.01 vs. no Zn control; † < 0.01 vs. 0.15 mM Zn. |
| SAMP8 mice brain cortex | 13 mos vs. 9 mos change No treatment Fed with CMS121 4 mos Fed with J147 4 mos |
Relative change 13 mos vs. 9 mos | [79] CMS121, J147 are acetyl-CoA carboxylase inhibitors. |
| (%) | |||
| −41 **** | |||
| −12 | |||
| −6 | |||
HT22 hippocampal neuronal cell culture Primary E21 mice neuronal culture |
24 h culture with: | Relative change vs. no addition control (%) |
[10][79] Compounds used here inhibit acetyl-CoA carboxylase by different mechanisms. |
| +ACC1 siRNA | +114 *** | ||
| +TOFA 0.01 mM | +178 *** | ||
| +CMS 121 0.001 mM | +140 *** | ||
| +J147 0.001 mM | +100 ** | ||
| +CAD031 0.001 mM | +177 *** | ||
| +CMS 121 0.001 mM | +57 *** | ||
| +J147 0.001 mM | +29 | ||
| +CAD031 0.001 mM | +108 *** | ||
| Brain-specific pdha1flox8/wt deficient mice (PDHD) | PDHD |
Relative change vs. control (%) −12 |
[54] |
| 3xTgAD mice WT control mice |
Ageing—2, 11, 21 mos hippocampus whole tissue Control |
2 mos 11 mos 21 mos | [80] Different from the corresponding 2 mos mice, † p < 0.05, ††† p < 0.001 |
| (Arbitrary units) | |||
| Male | |||
| 0.5 1.1† 1.3 ††† | |||
| 3XTgAD | 1.2 * 1.6 * 2.6 **††† | ||
| Female | |||
| Control | 0.5 0.8 1.0 † | ||
| 3XTgAD | 0.5 1.3 *† 1.2 † | ||
| Rat permanent middle cerebral artery occlusion model of brain stroke (pMCAO) | Shengui Shanseng San (SSS) extraction feeding per os 3 d before and 7 d after pMCAO | Relative change vs. sham control | [35] Absolute sham control value of infarct-corresponding control region equal to 24.4 µmol/µL tissue is 106 times higher than those reported elsewhere. |
| In brain infarcted region (%) pMCAO −80 *** |
|||
| Low dose SSS + pMCAO −52 *** | |||
| Middle dose SSS +pMCAO −44 *** | |||
| High dose SSS +pMCAO −4 | |||
| Closed-head impact acceleration model of mild or severe traumatic rat brain injury (mTBI/sTBI) | mTBI/sTBI | Relative change vs. control (%) Whole brain extracts |
[58] Absolute control value about 39 nmol/g wet weight is about 10 times higher than values reported elsewhere. Different from the corresponding of post mTBI time, † p < 0.005 |
| Post mTBI 6 h −13 | |||
| 24 h −22 | |||
| 48 h −24 | |||
| 120 h −13 | |||
| Post sTBI 6 h −34 * | |||
| 24 h −56 *† | |||
| 48 h −47 *† | |||
| 120 h −58 *† | |||
| HEK293 cell culture | DIP2A overexpression |
Relative change DIP2A vs. no insert control (%) +120 * |
[81] |
| Traumatic brain injury/control cortical impact rat brain (TBI/CCI) | TBI/CCI | Peri-contusional brain cortex acetyl-CoA (ng/mg protein) Early immediate 3 h i.v. administration |
[41] Absolute control value is about 34.5 pmol/mg protein. |
| Sham (saline 0.9%) 27 | |||
| Control 38 | |||
| Glucose 30% 57 * | |||
| Lactate 100 mM 29 | |||
| BHB 2M 52 * | |||
| Late (6 h post impact) 3 h i.v. administration | |||
| Glucose 30% 38 | |||
| Lactate 100 mM 21 | |||
| BHB 2M 38 | |||
| Cholinergic neuroblastoma cells WT SN56 TrkA-/p75NTR+ DC |
30 min incubation (protein-free medium) with: | Relative change vs. control (%) Mitochondria Cytoplasm |
[82] Mecamylamine is a nonselective antagonist of nicotinic receptors. 2APB is inhibitor of IP3 receptors and TRP channels. |
| Mecamylamine 0.002 mM | −36 ** +7 | ||
| Nifedipine 0.01 mM | 0 +28 | ||
| 2-Aminoethoxydiphenyl borate (2-APB) 0.05 mM | +43 -56 ** | ||
| Zn 0.15 mM | −64 *** −39 ** | ||
| Human fibroblastoma HT1080 cell line ACLY WT ACLY-WT ACLY KO |
4 h incubation with or without 20 mM acetate ACLY-WT ACLY-KO |
Relative change vs. WT-acetate control (%) | [83] Absolute control value for ACLY-WT is 6.1 μM (normalised to internal standard) |
| acetate 20 mM No acetate | |||
| 0 −14 | |||
| −67 *** −95 *** | |||
| E18 C57BL/6J mice model of AD | 24 h culture with Aβ1-42 10µM |
Relative change vs. control (%) | [84] Absolute control values for neurons and microglia are 0.45 and 0.75 μM, respectively |
| Neurons Microglia ** | |||
| 0 −31 | |||
| 5XFAD 9 mos mouse brain | 5XFAD control 5XFAD + efavirenz 0.1 mg/kg b.w./d in drinking water from 3 to 9 mos of life |
Whole brain Mitochondria (pmols/mg protein) |
[85] Efavirenz is an inhibitor of reverse transcriptase. Acetyl-CoA control levels reported here are about 10 times higher than reported elsewhere. |
| 145 87 | |||
| 351 *** 352*** | |||
| B6SJ/L 9 months mouse brain | B6SJ/L control | 361 157 | |
| Tg Cyp46a1+/+ | Tg Cyp46a1+/+ | 257 *** 128 | |
| Tg Cyp46a1−/− | Tg Cyp46a1−/− | 143 *** 100 *** | |
| Cholinergic neuroblastoma cells WT SN56 TrkA-/p75NTR+ NC and DC |
24 h culture in thiamine-free medium with: +Zn 0.1 mM +Amprolium 5 mmol/L +Zn +Amprolium |
Relative change vs. no Zn, and amprolium control (%) Mitochondria |
[45] Absolute control acetyl-CoA levels in NC and DC mitochondria were: 11.6 and 11.9 pmol/mg protein, respectively. Absolute control acetyl-CoA levels in NC and DC cytoplasm were: 13.6 and 11.7 pmol/mg protein, respectively. †† different from NC/DC Zn, p < 0.0.1 different from NC/DC amprolium, ‡ p < 0.05, ‡‡ p < 0.01 |
| NC DC | |||
| −5 −23 ** | |||
| −5 −16 * | |||
| −45 ***††‡‡ -50 **††‡‡ | |||
| Cytoplasm | |||
| +Zn 0.1 mM | −4 −12 | ||
| +Amprolium 5 mmol/L | −17 −12 | ||
| Thiamine-deficient culture medium | +Zn +Amprolium | −54 **††‡‡ −53 **††‡‡ | |
| C6 astroglioma cells Cholinergic neuroblastoma cells WT SN56 TrkA-/p75NTR+ DC |
24 h culture C6 in thiamine-free or thiamine-supplemented medium with: Amprolium 10 mM Zn 0.15 mM Zn 0.20 mM 24 h culture SN56 in thiamine-free medium in co-culture with C6 C6 co-culture Amprolium 5 mM Zn 0.1 mM Amprolium + Zn Amprolium + Zn+C6 co-culture |
Relative change vs. no Zn, no amprolium control (%) Thiamine deficient Thiamine suppl. |
[39] Absolute control levels of acetyl-CoA in SN56 and C6 cells were: 27.2 and 14.6 pmol/mg protein, respectively. † different from Amprolium+Zn, p < 0.05 |
| −26 ** 0 | |||
| −28 −16 | |||
| −68 ** −56 ** | |||
| Relative change vs. no co-culture, Zn, and no amprolium control (%) | |||
| +10 | |||
| −26 | |||
| −29 | |||
| −64 * | |||
| −10 † | |||
| WT mouse brain C57BL/6J mouse brain |
Glycerol triacetate 3 g/kg b.w./d 10 d by gavage, and euthanised 60 min. post last gavage | Hippocampus Relative change vs. control (%) |
[86] |
| Whole tissue Nuclei Cytoplasm | |||
| +171 * +19 *** +13 ** | |||
| Non-fasted mouse brain | Sacrificed 30 min. post oral ketone esters (KE) administration 3 mg/g b.w | Relative change KE vs. control (%) Brain cortex +114 *** |
[87] |
| Cultured primary neurons (E17 C57BL/6J mice) | Astrocyte-derived ApoE particles Astrocyte-derived medium (ADM)Apo E enriched ADMApo E depleted ADM |
Relative change vs. no ApoE control (%) Acetyl-CoA/CoA ratio Whole cells Nuclei +86 * +175 *** Acetyl-CoA/CoA ratio +200 *** +40 |
[32] |
| WT mouse brain Elp3 conditional KO mouse brain |
Lack Elongator to Atat1 activity |
Relative change vs. WT control (%) Cortical neurons−72 |
[88] |
| WT mouse brain C57Bl/6J mouse brain |
Acute stress |
Relative change vs.no stress control (%) Prefrontal cortex +113 * |
[89] Absolute acetyl-CoA level, 0.37 pmol/μg |
| C57BL/6J mice—stroke and hypoxia | 12 wk post-stroke oral administration p75 NTR modulator (LM11A-31) | Relative change vs. sham control (%) Brain infarcted region None LM11A-31 −32 +36 * |
[23] |
| Primary astrocytes—0–1-day-old mice cerebral cortex U87 human glioblastoma cells U87FABP7wt U87FABPmut. U251human glioma cells U251 FABP7KO |
FABP7-KO vs. WT cells FABP7wt vs. control FABP7mut vs. control FABP7KO vs. control |
Relative change vs. WT control (%) Whole cells Isolated nuclei −34 * −28 * +87 * +74 * −10 −39 −48 * −70 * |
[90][91] Absolute acetyl-CoA for control WT cells is 450 pmol/106, and 74 pmol/107 nuclei. |
| WT mouse brain SLC25A1 nTg mouse brain |
Hippocampus and cortex cytoplasm Lumen of the endoplasmic reticulum |
Relative change vs. WT control (%) Cytoplasm ER +58 *** +72 **** |
[92] SLC25A1 nTg—mitochondrial citrate carrier |
The majority of the data are presented as relative (%) change versus respective control value. This results from the fact that they are presented in arbitrary units. In some cases, absolute values of acetyl-CoA are given to enable quantitative assessment of this metabolite. Distribution data are deleted for clarity. Significance of differences between groups is marked by superscript symbols. Data significantly different from respective control, * p < 0.05; ** p < 0.01; *** p < 0.001; **** p < 0.0005. Other comparisons are given as individual references. Abbreviations: ACLY, ATP citrate lyase; AD, Alzheimer’s disease; ADM, astrocyte-derived medium; Atat1, α-tubulin N-acetyltransferase 1; CCI, controlled cortical impact; DCA, dichloroacetate; DH, stroke distal middle cerebral artery occlusion with hypoxia; Elp3, cKO mouse with conditional loss of Elp3 in cortical progenitors; EFV, efavirenz CYP46A1 activator; ER, endoplasmic reticulum; FABP7, fatty acid binding protein 7; GTA, glyceryl triacetate; mTBI/sTBI, mild/severe traumatic brain injury; p75NTR, p75 neurotropin receptor; PDHD, pyruvate dehydrogenase deficiency; pMCAO, permanent middle cerebral artery occlusion; PT, pyrithiamine; SSS, Shenggui Sansheng San composed of Panax ginseng root and rhizome, Angelica sinensis root and rhizome, Cinnamomum cassia; TBI, traumatic brain injury.
References
- Belanger, M.J.; Allman, I.; Magistretti, P.J. Brain energy metabolism. Focus on astrocyte-neuron metabolic cooperation. Cell Metab. 2011, 14, 724–738.
- McKenna, M.C.; Dienel, C.A.; Sonnewald, H.S.; Waagepetersen, H.S.; Schousboe, A. Energy metabolism of the brain. In Basic Neurochemistry: Principles of Molecular, Cellular and Medical Neurobiology, 8th ed.; Brady, S., Siegel, G., Albers, R.W., Donald, L., Price, D.L., Eds.; Elsevier B.V.: Amsterdam, The Netherlands, 2012; pp. 200–231.
- Divakaruni, A.S.; Wallace, M.; Buren, C.; Martyniuk, K.; Andreyev, A.Y.; Li, E.; Fields, J.A.; Cordes, T.; Reynolds, I.J.; Bloodgood, B.L.; et al. Inhibition of the mitochondrial pyruvate carrier protects from excitotoxic neuronal death. J. Cell Biol. 2017, 216, 1091–1105.
- Beard, E.; Lengacher, S.; Dias, S.; Magistretti, P.J.; Finsterwald, C.H. Astrocytes as key regulators of brain energy metabolism: New therapeutic perspectives. Front. Physiol. 2022, 12, 825816.
- Bonvento, G.; Bolaños, J.P. Astrocyte-neuron metabolic cooperation shapes brain activity. Cell Metab. 2021, 33, 1546–1564.
- Zhang, S.; Lachance, B.; Mattson, M.P.; Jia, X. Glucose metabolic crosstalk and regulation in brain function and diseases. Prog. Neurobiol. 2021, 204, 102089.
- Sun, W.; Cornwell, A.; Li, J.; Peng, S.; Osorio, J.; Aslling, N.; Wang, S.; Benraiss, A.; Lou, N.; Goldman, S.A.; et al. S0X9 is an astrocyte-specific nuclear marker in the adult brain outside the neurogenic regions. J. Neurosci. 2017, 37, 4493–4507.
- Popov, A.; Branze, N.; Fedotova, A.; Tiaglik, A.; Bychkov, M.; Morozova, N.; Branze, A.; Aronov, D.; Lyukmanova, E.; Lazareva, N.; et al. A high-fat diet changes astrocytic metabolism to promote synaptic plasticity and behavior. Acta Physiol. 2022, 236, e13847.
- Bhatt, D.P.; Rosenberger, T.A. Acetate treatment increases fatty acid content in LPS-stimulated BV2 microglia. Lipids 2014, 49, 621–631.
- Currais, A.; Huang, L.; Petrascheck, M.; Maher, P.; Schubert, D. A chemical biology approach to identifying molecular pathways associated with aging. Geroscience 2021, 43, 353–365.
- Zyśk, M.; Bielarczyk, H.; Gul-Hinc, S.; Dyś, A.; Gapys, S.; Ronowska, A.; Sakowicz-Burkiewicz, M.; Szutowicz, A. Phenotype-dependent interaction between N-acetyl-L-aspartate and acetyl CoA in septal SN56 cholinergic cells exposed to an excess of zinc. J. Alzheimer Dis. 2017, 56, 1145–1158.
- Janssen, L.; Ai, X.; Zheng, X.; Wei, W.; Caglayan, A.B.; Kilic, E.; Wang, Y.-C.; Hermann, D.M.; Venkataramani, V.; Bähr, M.; et al. Inhibition of fatty acid synthesis aggravates brain injury, reduces blood-brain barrier integrity and impairs neurological ecoverry in a murine stroke model. Front. Cell. Neurosci. 2021, 15, 327.
- Pietrocola, F.; Galluzzi, L.; Bravo-San Pedro, J.M.; Madeo, F.; Kroemer, G. Acetyl coenzyme A: A central metabolite and second messenger. Cell Metab. 2015, 21, 805–821.
- Ronowska, A.; Szutowicz, A.; Bielarczyk, H.; Gul-Hic, S.; Klimaszewska-Łata, J.; Dyś, A.; Zyśk, M.; Jankowska-Kulawy, A. The regulatory effects of acetyl-CoA distribution in the healthy and diseased brain. Front. Cell. Neurosci. 2018, 12, 169–189.
- Szutowicz, A.; Bielarczyk, H.; Zyśk, M.; Dyś, A.; Ronowska, A.; Gul-Hinc, S.; Klimaszewska-Łata, J. Early and late pathomechanisms in Alzheimer’s disease: From zinc to amyloid-β neurotoxicity. Neurochem. Res. 2017, 42, 891–904.
- Bradshaw, P.C. Acetyl-CoA metabolism and histone acetylation in the regulation of aging and lifespan. Antioxidants 2021, 10, 572.
- Schuberth, J.; Sollenberg, J.; Sundvall, A.; Sörbo, B. Acetylcoenzyme A in brain. J. Neurochem. 1966, 13, 819–822.
- Ičny, J.; Tuček, S. Acetyl-coenzyme and acetylcholine in slices of rat caudate nuclei incubated in the presence of metabolic inhibitors. J. Biol. Chem. 1981, 256, 4919–4923.
- Bielarczyk, H.; Szutowicz, A. Evidence for the regulatory function of synaptoplasmic acetyl-CoA in acetylcholine synthesis in nerve endings. Biochem. J. 1989, 262, 337–380.
- Ferreira-Vieira, T.H.; Guimaraes, I.M.; Silva, F.R.; Ribeiro, F.M. Alzheimer’s disease: Targeting the cholinergic system. Curr. Neuropharmacol. 2016, 14, 101–115.
- Simpson, I.A.; Carruthers, A.; Vannucci, S.J. Supply and demand in cerebral energy metabolism: The role of nutrient transporters. J. Cereb. Blood Flow Metab. 2007, 27, 1766–1791.
- Szablewski, L. Glucose transporters in brain: In health and in Alzheimer’s disease. J. Alzheimers Dis. 2017, 55, 1307–1320.
- Nguyen, T.V.; Crumpacker, R.H.; Calderon, K.E.; Garcia, F.G.; Zbesko, J.C.; Frye, J.B.; Gonzalez, S.; Becktel, D.A.; Yang, T.; Tavera-Garcia, M.A.; et al. Post-stroke administration of the p75 neurotrophin receptor modulator, LM11A-31, attenuates chronic changes in brain metabolism, increases neurotransmitter levels, and improves recovery. J. Pharmacol. Exp. Ther. 2022, 380, 126–141.
- Patching, S.G. Glucose transporters at the blood-brain barrier: Function, regulation and gateways for drug delivery. Mol. Neurobiol. 2017, 54, 1046–1077.
- Sharma, V.; Singh, T.G. Therapeutic implications of glucose transporters (GLUT) in cerebral ischemia. Neurochem. Res. 2022, 47, 2173–2186.
- Pérez-Escuredo, J.; Van Hée, V.F.; Sboarina, M.; Falces, J.; Payen, V.L.; Pellerin, L.; Sonveaux, P. Monocarboxylate transporters in the brain and in cancer. Biochim. Biophys. Acta 2016, 1863, 2481–2497.
- Roosterman, D.; Cottrell, G.S. Astrocytes and neurons communicate via a monocarboxylic acid shuttle. AIMS Neurosci. 2020, 7, 94–106.
- Magistretti, P.J.; Allaman, I.A. cellular perspective on brain energy metabolism and functional imaging. Neuron 2015, 86, 883–901.
- Wohnsland, S.; Bürgers, H.F.; Kuschinsky, W.; Maurer, M.H. Neurons and neuronal stem cells survive in glucose-free lactate and in high glucose cell culture medium during normoxia and anoxia. Neurochem. Res. 2010, 35, 1635–1642.
- Li, Y.; Lu, B.; Sheng, L.; Zhu, Z.; Sun, H.; Zhou, Y.; Yang, Y.; Xue, D.; Chen, W.; Tian, X.; et al. Heksokinase 2-dependent hyperglycolisis driving microglial activation contributes to ischemic brain injury. J. Neurochem. 2018, 144, 186–200.
- Sutendra, G.; Kinnaird, A.; Dromparis, P.; Paulin, R.; Stenson, T.H.; Haromy, A.; Hashimoto, K.; Zhang, N.; Flaim, E.; Michelakis, E.D. A nuclear pyruvate dehydrogenase complex is important for the generation of acetyl-CoA and histone acetylation. Cell 2014, 158, 84–97.
- Li, X.; Zhang, J.; Li, D.; He, C.H.; He, K.; Xue, T.; Wan, L.; Zhang, C.H.; Liu, Q.; Wan, L.; et al. Astrocytic ApoE reprograms neuronal cholesterol metabolism and histone-acetylation-mediated memory. Neuron 2021, 109, 957–970.
- Zou, W.; Zhao, T.; Du, J.; Ji, G.; Li, X.; Ji, S.; Tian, W.; Wang, X.; Hao, A. TIGAR promotes neural stem cell differentiation through acetyl-CoA-mediated histone acetylation. Cell Death Dis. 2019, 10, 198.
- Sun, Y.; Li, T.; Xie, C.; Zhang, Y.; Zhou, K.; Wang, X.; Blomgren, K.; Zhu, C.H. Dichloroacetate treatment improves mitochondrial metabolism and reduces brain injury in neonatal mice. Oncotarget 2016, 7, 31708–31722.
- Luo, C.; Bian, X.; Zhang, Q.; Xia, Z.; Liu, B.; Chn, Q.; Ke, C.; Wu, J.L.; Zhao, Y. Shengui sansheng san ameliorates cerebral energy deficiency via citrate cycle after ischemic stroke. Front. Pharmacol. 2019, 10, 386–392.
- Khoury, N.; Xu, J.; Stegelman, S.D.; Jackson, C.W.; Koronowski, K.B.; Dave, K.R.; Young, J.I.; Perez-Pinzon, M.A. Resveratrol reconditioning induces genomic and metabolic adaptations with long-term window of cerebral ischemic tolerance leading to bioenergetic efficiency. Mol. Neurobiol. 2019, 56, 4549–4565.
- Koronowski, K.B.; Khoury, N.; Saul, N.; Loriz, Z.B.; Cohan, C.H.; Stradecki-Cohan, H.M.; Dave, K.R.; Young, J.I. Neuronal SIRT1 (silent information regulator 2 homologue 1) regulates glycolysis and mediates resveratrol-induced ischemic tolerance. Stroke 2017, 48, 3117–3125.
- Klimaszewska-Łata, J.; Gul-Hinc, S.; Bielarczyk, H.; Ronowska, A.; Zyśk, M.; Grużewska, K.; Pawełczyk, T.; Szutowicz, A. Differential effects of lipopolysaccharide on energy metabolism in murine microglial N9 and cholinergic SN56 neuronal cells. J. Neurochem. 2015, 133, 284–297.
- Gul-Hinc, S.; Michno, A.; Zyśk, M.; Szutowicz, A.; Jankowska-Kulawy, A.; Ronowska, A. Protection of cholinergic neurons against zinc toxicity by glial cells in thiamine-deficient media. Int. J. Mol. Sci. 2021, 22, 13337–13357.
- Ronowska, A.; Gul-Hinc, S.; Bielarczyk, H.; Pawełczyk, T.; Szutowicz, A. Effects of zinc on SN56 cholinergic neuroblastoma cells. J. Neurochem. 2007, 103, 972–983.
- Greco, T.; Vespa, P.M.; Prins, M.L. Alternative substrate metabolism depends on cerebral metabolic state following traumatic brain injury. Exp. Neurol. 2020, 329, 113289.
- Narayanan, S.E.; Rehuman, N.A.; Harilal, S.; Vincent, A.; Rajamma, R.G.; Behl, T.; Uddin, M.S.; Ashraf, G.M.; Mathew, B. Molecular mechanism of zinc neurotoxicity in Alzheimer’s disease. Environ. Sci. Pollut. Res. Int. 2020, 35, 43542–43552.
- Sensi, S.L.; Paoletti, P.; Bush, A.I.; Sekler, I. Zinc in the physiology and pathology of the CNS. Nat. Rev. Neurosci. 2009, 10, 780–791.
- Levenson, C.W. Zinc and traumatic brain injury: From chelation to supplementation. Med. Sci. 2020, 8, 36.
- Ronowska, A.; Gul-Hinc, S.; Michno, A.; Bizon-Zygmańska, D.; Zyśk, M.; Bielarczyk, H.; Szutowicz, A.; Gapys, B.; Jankowska-Kulawy, A. Aggravated effects of coexisting marginal thiamine deficits and zinc excess on SN56 neuronal cells. Nutr. Neurosci. 2021, 6, 432–442.
- Annoni, F.; Peluso, L.; Bogossian, E.G.; Creteur, J.; Zanier, E.R.; Taccone, F.S. Brain protection after anoxic brain injury: Is lactate supplementation helpful ? Cells 2021, 10, 1714.
- Duhaut, D.E.; Heurteaux, C.; Gandin, C.; Ichai, C.; Quintard, H. The antiedematous effect of exogenous lactate therapy in traumatic brain injury: A physiological and mechanistic approach. Neurocrit. Care 2021, 35, 747–755.
- Wang, P.; Chen, M.; Yang, Z.; Yu, T.; Zhu, J.; Zhou, L.; Lin, J.; Fang, X.; Huang, Z.; Jiang, L.; et al. Activation of pyruvate dehydrogenase activity by dichloroacetate improves survival and neurologic outcomes after cardiac arrest in rats. Shock 2018, 49, 704–711.
- Szutowicz, A.; Bielarczyk, H.; Skulimowska, H. Effect of dichloroacetate on acetyl-CoA content and acetylcholine synthesis in rat brain synaptosomes. Neurochem. Res. 1994, 19, 1107–1112.
- Glancy, B.; Balaban, R.S. Role of mitochondrial Ca2+ in the regulation of cellular energetics. Biochemistry 2012, 51, 2959–2973.
- Piao, L.; Fang, Y.H.; Kubler, M.M.; Donnino, M.W.; Sharp, W.W. Enhanced pyruvate dehydrogenase activity improves cardiac outcomes in a murine model of cardiac arrest. PLoS ONE 2017, 12, e0185046.
- Ikeda, K.; Liu, X.; Kida, K.; Marutani, E.; Hirai, S.; Sakaguchi, M.; Andersen, L.W.; Bagchi, A.; Cocchi, M.N.; Berg, K.M.; et al. Thiamine as a neuroprotective agent after cardiac arrest. Resuscitation 2016, 105, 138–144.
- Kho, A.R.; Choi, B.Y.; Lee, S.H.; Hong, D.K.; Jeong, J.H.; Kang, B.S.; Kang, D.H.; Park, K.H.; Park, J.B.; Suh, S.W. The effects of sodium dichloroacetate on mitochondrial dysfunction and neuronal death following hypoglycemia-induced injury. Cells 2019, 8, 405.
- Jakkamsetti, V.; Marin-Valencia, I.; Ma, Q.; Good, L.B.; Terrill, T.; Rajasekaran, K.; Pichumani, K.; Khemtong, C.H.; Hooshyar, M.A.; Sundarrajan, C.H.; et al. Brain metabolism modulates neuronal excitability in a mouse model of pyruvate dehydrogenase deficiency. Sci. Transl. Med. 2019, 11, eaan0457.
- Jakkamsetti, V.; Ma, Q.; Pascual, J.M. A subset of synaptic transmission events is coupled to acetyl coenzyme A production. J. Neurophysiol. 2022, 127, 623–636.
- Chevalier, A.C.; Rosenberger, T.A. Increasing acetyl-CoA metabolism attenuates injury and alters spinal cord lipid content in mice subjected to experimental autoimmune encephalomyelitis. J. Neurochem. 2017, 141, 721–737.
- Della-Flora Nunes, G.; Mueller, L.; Silvestri, N.; Patel, M.S.; Wrabetz, L.; Feltri, M.L.; Poitelon, Y. Acetyl-CoA production from pyruvate is not necessary for preservation of myelin. Glia 2017, 65, 1626–1639.
- Lazzarino, G.; Amorini, A.M.; Signoretti, S.; Musumeci, G.; Lazzarino, G.; Caruso, G.; Pastore, F.S. Pyruvate dehydrogenase and tricarboxylic acid cycle enzymes are sensitive targets of traumatic brain injury induced metabolic derangement. Int. J. Mol. Sci. 2019, 20, 5774.
- Bubber, P.; Haroutunian, V.; Blass, J.P.; Gibson, G.E. Mitochondrial abnormalities in Alzheimer brain: Mechanistic implications. Ann. Neurol. 2005, 57, 695–703.
- Huang, Z.; Yan, Q.; Wang, Y.; Zou, Q.; Li, J.; Liu, Z.; Cai, Z. Role of mitochondrial dysfunction in the pathology of amyloid-β. J. Alzheimers Dis. 2020, 78, 505–514.
- Hoshi, M.; Takashima, A.; Murayama, M.; Yoshida, N.; Hohino, T. Nontoxic amyloid beta peptide 1–42 suppresses acetylcholine synthesis. Possible role in cholinergic dysfunction in Alzheimer’s disease. J. Biol. Chem. 1997, 272, 2038–2041.
- Bielarczyk, H.; Jankowska-Kulawy, A.; Höfling, C.; Ronowska, A.; Gul-Hinc, S.; Roβner, S.; Schliebs, R.; Pawełczyk, T.; Szutowicz, A. AβPP-transgenic 2576 mice mimic cell type-specific aspects of acetyl-CoA-linked metabolic deficits in Alzheimer’s disease. J. Alzheimer Dis. 2015, 48, 1083–1094.
- Gandbhir, O.; Sundaram, P. Effect of AmyTrap, an amyloid-β binding drug, on Aβ induced mitochondrial dysfunction and tau phosphorylation in cultured neuroblastoma cells. Metab. Brain Dis. 2020, 35, 923–931.
- Li, S.; Sheng, Z.H. Energy matters: Presynaptic metabolism and the maintenance of synaptic transmission. Nat. Rev. Neurosci. 2022, 23, 4–22.
- Shea, P.A.; Aprison, M.H. The distribution of acetyl-CoA in specific areas of the CNS of the rat as measured by a modification of a radio-enzymatic assay for acetylcholine and choline. J. Neurochem. 1977, 28, 51–58.
- Szutowicz, A.; Tomaszewicz, M.; Jankowska, A.; Kisielevski, J. Acetylocholine synthesis in nerve terminals of diabetic rats. Neuroreport 1994, 5, 2421–2424.
- Szutowicz, A.; Madziar, B.; Pawełczyk, T.; Tomaszewicz, M.; Bielarczyk, H. Effects of NGF on acetylcholine, acetyl-CoA metabolism and viability of differentiated and non-differentiated cholinergic neuroblastoma cells. J. Neurochem. 2004, 90, 952–961.
- Bielarczyk, H.; Jankowska-Kulawy, A.; Gul, S.; Pawełczyk, T.; Szutowicz, A. Phenotype dependent differential effects of interleukin-1β and amyloid-β on viability and cholinergic phenotype of T17 neuroblastoma cells. Neurochem. Int. 2005, 47, 466–473.
- Szutowicz, A.; Bielarczyk, H.; Gul, S.; Zieliński, P.; Pawełczyk, T.; Tomaszewicz, M. Nerve growth factor and acetyl-L-carnitine evoked shifts in acetyl-CoA and cholinergic SN56 cell vulnerability to neurotoxic inputs. J. Neurosci. Res. 2005, 79, 185–192.
- Szutowicz, A.; Bielarczyk, H.; Gul, S.; Ronowska, A.; Pawełczyk, T.; Jankowska-Kulawy, A. Phenotype-dependent susceptibility of cholinergic neuroblastoma cells to neurotoxic inputs. Met. Brain Dis. 2006, 21, 149–161.
- Ronowska, A.; Dyś, A.; Jankowska-Kulawy, A.; Klimaszewska-Łata, J.; Bielarczyk, H.; Romianowski, P.; Pawełczyk, T.; Szutowicz, A. Short-term effects of zinc on acetylcholine metabolism and viability of SN56 cholinergic neuroblastoma cells. Neurochem. Int. 2010, 56, 143–151.
- Jankowska-Kulawy, A.; Bielarczyk, H.; Pawełczyk, T.; Wróblewska, M.; Szutowicz, A. Acetyl-CoA and acetylcholine metabolism in nerve terminal compartment of thiamine deficient rat brain. J. Neurochem. 2010, 115, 333–342.
- Jankowska-Kulawy, A.; Bielarczyk, H.; Pawełczyk, T.; Wróblewska, M.; Szutowicz, A. Acetyl-CoA deficit in brain mitochondria in experimental thiamine deficiency encephalopathy. Neurochem. Int. 2010, 57, 851–856.
- Bizon-Zygmańska, D.; Jankowska-Kulawy, A.; Bielarczyk, H.; Pawełczyk, T.; Ronowska, A.; Marszałł, M.; Szutowicz, A. Acetyl-CoA metabolism in amprolium-evoked thiamine pyrophosphate deficits in cholinergic SN56 neuroblastoma cells. Neurochem. Int. 2011, 59, 208–216.
- Peng, Y.; Li, M.; Clarkson, B.D.; Pehar, M.; Lao, P.J.; Hillmer, A.T.; Barnhart, T.E.; Christian, B.T.; Mitchell, H.A.; Bendlin, B.B.; et al. Deficient import of acetyl-CoA into the ER lumen causes neurodegeneration and propensity to infections, inflammation, and cancer. J. Neurosci. 2014, 34, 6772–6789.
- Hullinger, R.; Li, M.; Wang, J.; Peng, Y.; Dowell, J.A.; Bomba-Warczak, E.; Mitchell, H.A.; Burger, C.; Chapman, E.R.; Denu, J.M.; et al. Increased expression of AT-1/SL33A1 causes an autistic-like phenotype in mice by affecting dendritic branching and spine formation. J. Exp. Med. 2016, 213, 1267–1284.
- Szutowicz, A.; Stępień, M.; Łysiak, W.; Angielski, S. Effect of (-) hydroxycitrate on the activities of ATP citrate lyase and the enzymes of acetyl-CoA metabolism in rat brain. Acta Biochim. Pol. 1976, 23, 227–234.
- Zyśk, M.; Gapys, B.; Ronowska, A.; Gul-Hinc, S.; Erlandsson, A.; Iwanicki, A.; Sakowicz-Burkiewicz, M.; Szutowicz, A.; Bielarczyk, H. Protective effects of voltage-gated calcium channel antagonist against zinc toxicity in SN56 neuroblastoma cholinergic cells. PLoS ONE 2018, 13, e0209363.
- Currais, A.; Huang, L.; Goldberg, J.; Petrascheck, M.; Ates, G.; Pinto-Duarte, A.; Shokhirev, M.N.; Schubert, D.; Maher, P. Elevating acetyl-CoA levels reduces aspects of brain aging. Elife 2019, 8, e47866.
- Dong, Y.; Brewer, G.J. Global metabolic shifts in age and Alzheimer’s disease mouse brains pivot at NAD+/NADH redox sites. J. Alzheimers Dis. 2019, 71, 119–140.
- Ma, Y.; Chen, L.; He, X.X.; Wang, Y.J.; Yu, H.L.; He, Z.X.; Zhang, L.Q.; Zheng, Y.W.; Zhu, X.J. Functional prediction and characterization of Dip2gene in mice. Cell Biol. Int. 2019, 43, 421–428.
- Zyśk, M.; Sakowicz-Burkiewicz, M.; Pikul, P.; Kowalski, R.; Michno, A.; Pawełczyk, T. The impact of acetyl-CoA and aspartate shortages on the N-acetylaspartate level in different models of cholinergic neurons. Antioxidants 2020, 9, 522–545.
- Houston, R.; Sekine, S.; Calderon, M.J.; Seifuddin, F.; Wang, G.; Kawagishi, H.; Malide, D.A.; Li, Y.; Gucek, M.; Pirooznia, M.; et al. Acetylation-mediated remodeling of the nucleolus regulates cellular acetyl-CoA responses. PLoS Biol. 2020, 18, e3000981.
- Lee, J.Y.; Han, S.H.; Park, M.H.; Song, I.S.; Choi, M.K.; Yu, E.; Park, C.M.; Kim, H.J.; Kim, S.H.; Schuchman, E.H.; et al. N-AS-triggered SPMs are direct regulators of microglia in a model of Alzheimer’s disease. Nat. Commun. 2020, 11, 2358.
- Mast, N.; Petrov, A.M.; Prendergast, E.; Bederman, I.; Pikuleva, I.A. Brain acetyl-CoA production and phosphorylation of cytoskeletal proteins are targets of CYP46A1 activity modulation and altered sterol flux. Neurotherapeutics 2021, 18, 2040–2206.
- Huang, W.; Hu, W.; Cai, L.; Zeng, G.; Fang, W.; Dai, X.; Ye, Q.; Chen, X.; Zhang, J. Acetate supplementation produces antidepressant-like effect via enhanced histone acetylation. J. Affect. Disord. 2021, 281, 51–60.
- Suissa, L.; Kotchetkov, P.; Guigonis, J.M.; Doche, E.; Osman, O.; Pourcher, T.; Lindenthal, S. Ingested ketone ester leads to a rapid rise of acetyl-CoA and competes with glucose metabolism in the brain of non-fasted mice. Int. J. Mol. Sci. 2021, 22, 524.
- Wong, V.S.C.; Picci, C.; Swift, M.; Levinson, M.; Willis, D.; Langley, B. α-tubulin acetyltransferase is a novel target mediating neurite growth inhibitory effects of chondroitin sulfate proteoglycans and myelin-associated glycoprotein. eNeuro 2018, 5, e0240-17.
- Hyeonwi-Son, H.; Baek, J.H.; Kang, J.S.; Jung, S.; Chung, H.J.; Kim, H.J. Acutely increased b-hydroxybutyrate plays a role in the prefrontal cortex to escape stressful conditions during the acute stress response. Biochem. Biophys. Res. Commun. 2021, 554, 19–24.
- Kagawa, Y.; Umaru, B.A.; Shima, H.; Ito, R.; Zama, R.; Islam, A.; Kanno, S.I.; Yasui, A.; Sato, S.; Jozaki, K.; et al. FABP7 regulates acetyl-CoA metabolism through the interaction with ACLY in the nucleus of astrocytes. Mol. Neurobiol. 2020, 57, 4891–4910.
- Kagawa, Y.; Umaru, B.A.; Kanamori, M.; Zama, R.; Shil, S.K.; Miyzaki, H.; Kobayashi, S.; Wannakul, T.; Yang, S.; Tominaga, T.; et al. Nuclear FABP7 regulates cell proliferation of wild-type IDH1 glioma through caveolae formation. Mol. Oncol. 2022, 16, 289–306.
- Rigby, M.J.; Orefice, N.S.; Lawton, A.J.; Ma, M.; Shapiro, S.L.; Yi, S.Y.; Dieterich, I.A.; Frelka, A.; Miles, H.N.; Pearce, R.A.; et al. Increased expression of SLC25A1/CIC causes an autistic-like phenotype with altered neuron morphology. Brain 2022, 145, 500–516.
More
Information
Subjects:
Biochemistry & Molecular Biology
Contributors
MDPI registered users' name will be linked to their SciProfiles pages. To register with us, please refer to https://encyclopedia.pub/register
:
View Times:
2.6K
Revisions:
5 times
(View History)
Update Date:
22 Sep 2022
Table of Contents


Notice
You are not a member of the advisory board for this topic. If you want to update advisory board member profile, please contact office@encyclopedia.pub.
OK
Confirm
Only members of the Encyclopedia advisory board for this topic are allowed to note entries. Would you like to become an advisory board member of the Encyclopedia?
Yes
No
${ textCharacter }/${ maxCharacter }
Submit
Cancel
Back
Comments
${ item }
|
${ item.createdUser.fullName }
${ item.createdAt }
${ item.vote }
${ item.reply }
Delete
${ reply.createdUser.fullName }
${ reply.createdAt }
${ reply.vote }
Delete
There is no reply to this comment~
${ item.replyTextCharacter }/${ item.replyMaxCharacter }
Submit
Cancel
More
No more~
There is no comment~
${ textCharacter }/${ maxCharacter }
Submit
Cancel
${ selectedItem.replyTextCharacter }/${ selectedItem.replyMaxCharacter }
Submit
Cancel
Confirm
Are you sure to Delete?
Yes
No