Your browser does not fully support modern features. Please upgrade for a smoother experience.
Submitted Successfully!
 +1 credit
Thank you for your contribution! You can also upload a video entry or images related to this topic.
For video creation, please contact our Academic Video Service.
| Version | Summary | Created by | Modification | Content Size | Created at | Operation |
|---|---|---|---|---|---|---|
| 1 | Pentti Nieminen | -- | 2737 | 2022-09-13 18:22:30 | | | |
| 2 | Beatrix Zheng | + 1 word(s) | 2738 | 2022-09-14 04:41:57 | | | | |
| 3 | Beatrix Zheng | Meta information modification | 2738 | 2022-09-14 04:43:12 | | |
Video Upload Options
We provide professional Academic Video Service to translate complex research into visually appealing presentations. Would you like to try it?
Cite
If you have any further questions, please contact Encyclopedia Editorial Office.
Nieminen, P. Application of Standardized Regression Coefficient in Meta-Analysis. Encyclopedia. Available online: https://encyclopedia.pub/entry/27141 (accessed on 11 July 2026).
Nieminen P. Application of Standardized Regression Coefficient in Meta-Analysis. Encyclopedia. Available at: https://encyclopedia.pub/entry/27141. Accessed July 11, 2026.
Nieminen, Pentti. "Application of Standardized Regression Coefficient in Meta-Analysis" Encyclopedia, https://encyclopedia.pub/entry/27141 (accessed July 11, 2026).
Nieminen, P. (2022, September 13). Application of Standardized Regression Coefficient in Meta-Analysis. In Encyclopedia. https://encyclopedia.pub/entry/27141
Nieminen, Pentti. "Application of Standardized Regression Coefficient in Meta-Analysis." Encyclopedia. Web. 13 September, 2022.
Copy Citation
The β coefficient is the estimate resulting from an analysis carried out on variables that have been standardized so that their standard deviations (and variances) are equal to one. Therefore, the standardized coefficient refers to how many standard deviations the response or outcome variable will change per a standard deviation increase in the explanatory or predictor variable. Thus, the standardized coefficient β can be regarded as an attempt to make regression coefficients more comparable, and can be used as an effect-size estimate when the exposure levels in original studies are measured in different units of measurement.
standardized regression coefficient
statistics
meta-analysis
research synthesis
1. Standardized Regression Coefficient as an Effect-Size Index in Meta-Analysis
Multivariable linear-regression models are used to analyze the associations between one quantitative dependent variable and several explanatory variables. The unstandardized regression coefficient (b) estimated from the linear-regression model is an easy-to-interpret statistic to describe how the explanatory variable affects the values of the outcome variable. These coefficients are usually provided with their standard errors (SEs) or confidence intervals (CIs) in articles reporting findings from regression models [1][2]. The unstandardized regression coefficient b describes the effect of changing the explanatory variable by one unit, and hence its size depends on the scale used to measure the explanatory variable. However, the main explanatory characteristic is often measured using different methods and metrics in the reviewed studies. Thus, the direct pooling of unstandardized regression coefficients is not meaningful across studies. To pool the effects of explanatory variables measured with different scales, they must be expressed in a comparable manner. In such a case, the standardized regression coefficient β may offer an option to synthetize the findings [3][4].
The statistical significance of the standardized regression coefficient can be tested using the t-test of the null hypothesis H0: β = 0, or in substantive terms, no systematic relationship between the predictor and outcome. A p-value higher than 0.05 supports the null hypothesis that there is no association. A confidence interval for the coefficient β provides information about the range of the β. A positive (negative) β-value supports the hypothesis that a high exposure level increases (decreases) the response. When the confidence interval does not include 0, then the association between the explanatory variable and outcome variable is considered statistically significant, in accordance with the p-value of the t-test <0.05.
When considering effect sizes, a natural question to ask is what constitutes a large, medium, and small effect size. Cohen’s [5] guidelines for the classification of effect sizes are widely cited in scientific reports. For a coefficient β, effect sizes between 0.10–0.29 are said to be only small, effect sizes between 0.30–0.49 are medium, and effect sizes of 0.50 or greater are large [5][6].
An essential feature of the quantitative meta-analysis is its ability to compare the magnitude of effects across studies, which requires the use of a single effect-size metric for measuring these effects. Using the standardized regression coefficient β as the common effect-size measure involves extracting the findings of reviewed studies expressed as unstandardized regression coefficients, correlation coefficients or mean differences. These statistics are then re-expressed as standardized regression coefficients and their standard errors. This process includes several conversions, calculations, and approximations.
In a meta-analysis, the findings (and effect sizes) are pooled from reviewed studies. However, every observed effect size is not equal with regard to the reliability of the information it carries [7]. Therefore, each effect-size value must be weighted by a term that represents its precision. An optimal approach is to use the inverse of the squared standard error of the effect-size value as a weight. Thus, larger studies, which have smaller standard errors, are given more weight than smaller studies, which have larger standard errors. The formula for computing the associated standard error must also be identified. To obtain the summary effect of all the reviewed studies, the weighted average effect size can be computed using the following formula:
where k = number studies, βi is the standard regression coefficient from study I, SE(βi) is the standard error of βi, and wi is the inverse of (SE(βi))2. The variance (SE(βi))2 can be calculated using the fixed-effects or random-effects model [7][8]. This version of the meta-analysis procedure is commonly referred to as the generic inverse-approach [9]. The approach is implemented in all standard software packages for meta-analysis.
Meta-analyses typically report the summary effect size M with a measure of precision (SE or CI) and a p-value in a figure. This figure, the forest plot, displays the effect estimates and confidence intervals for individual studies as well as the summary effect. Figure 1 provides two examples of forest plots. Following Cohen’s guidelines [5] and substantive empirical reviews [6][10], for the absolute (non-negative) value of the pooled effect size |M|, a value of 0.10–0.19 is a small effect size, a pooled value of 0.20–0.29 is classified as a medium effect size, and a pooled value of 0.30 or greater is a large effect size.
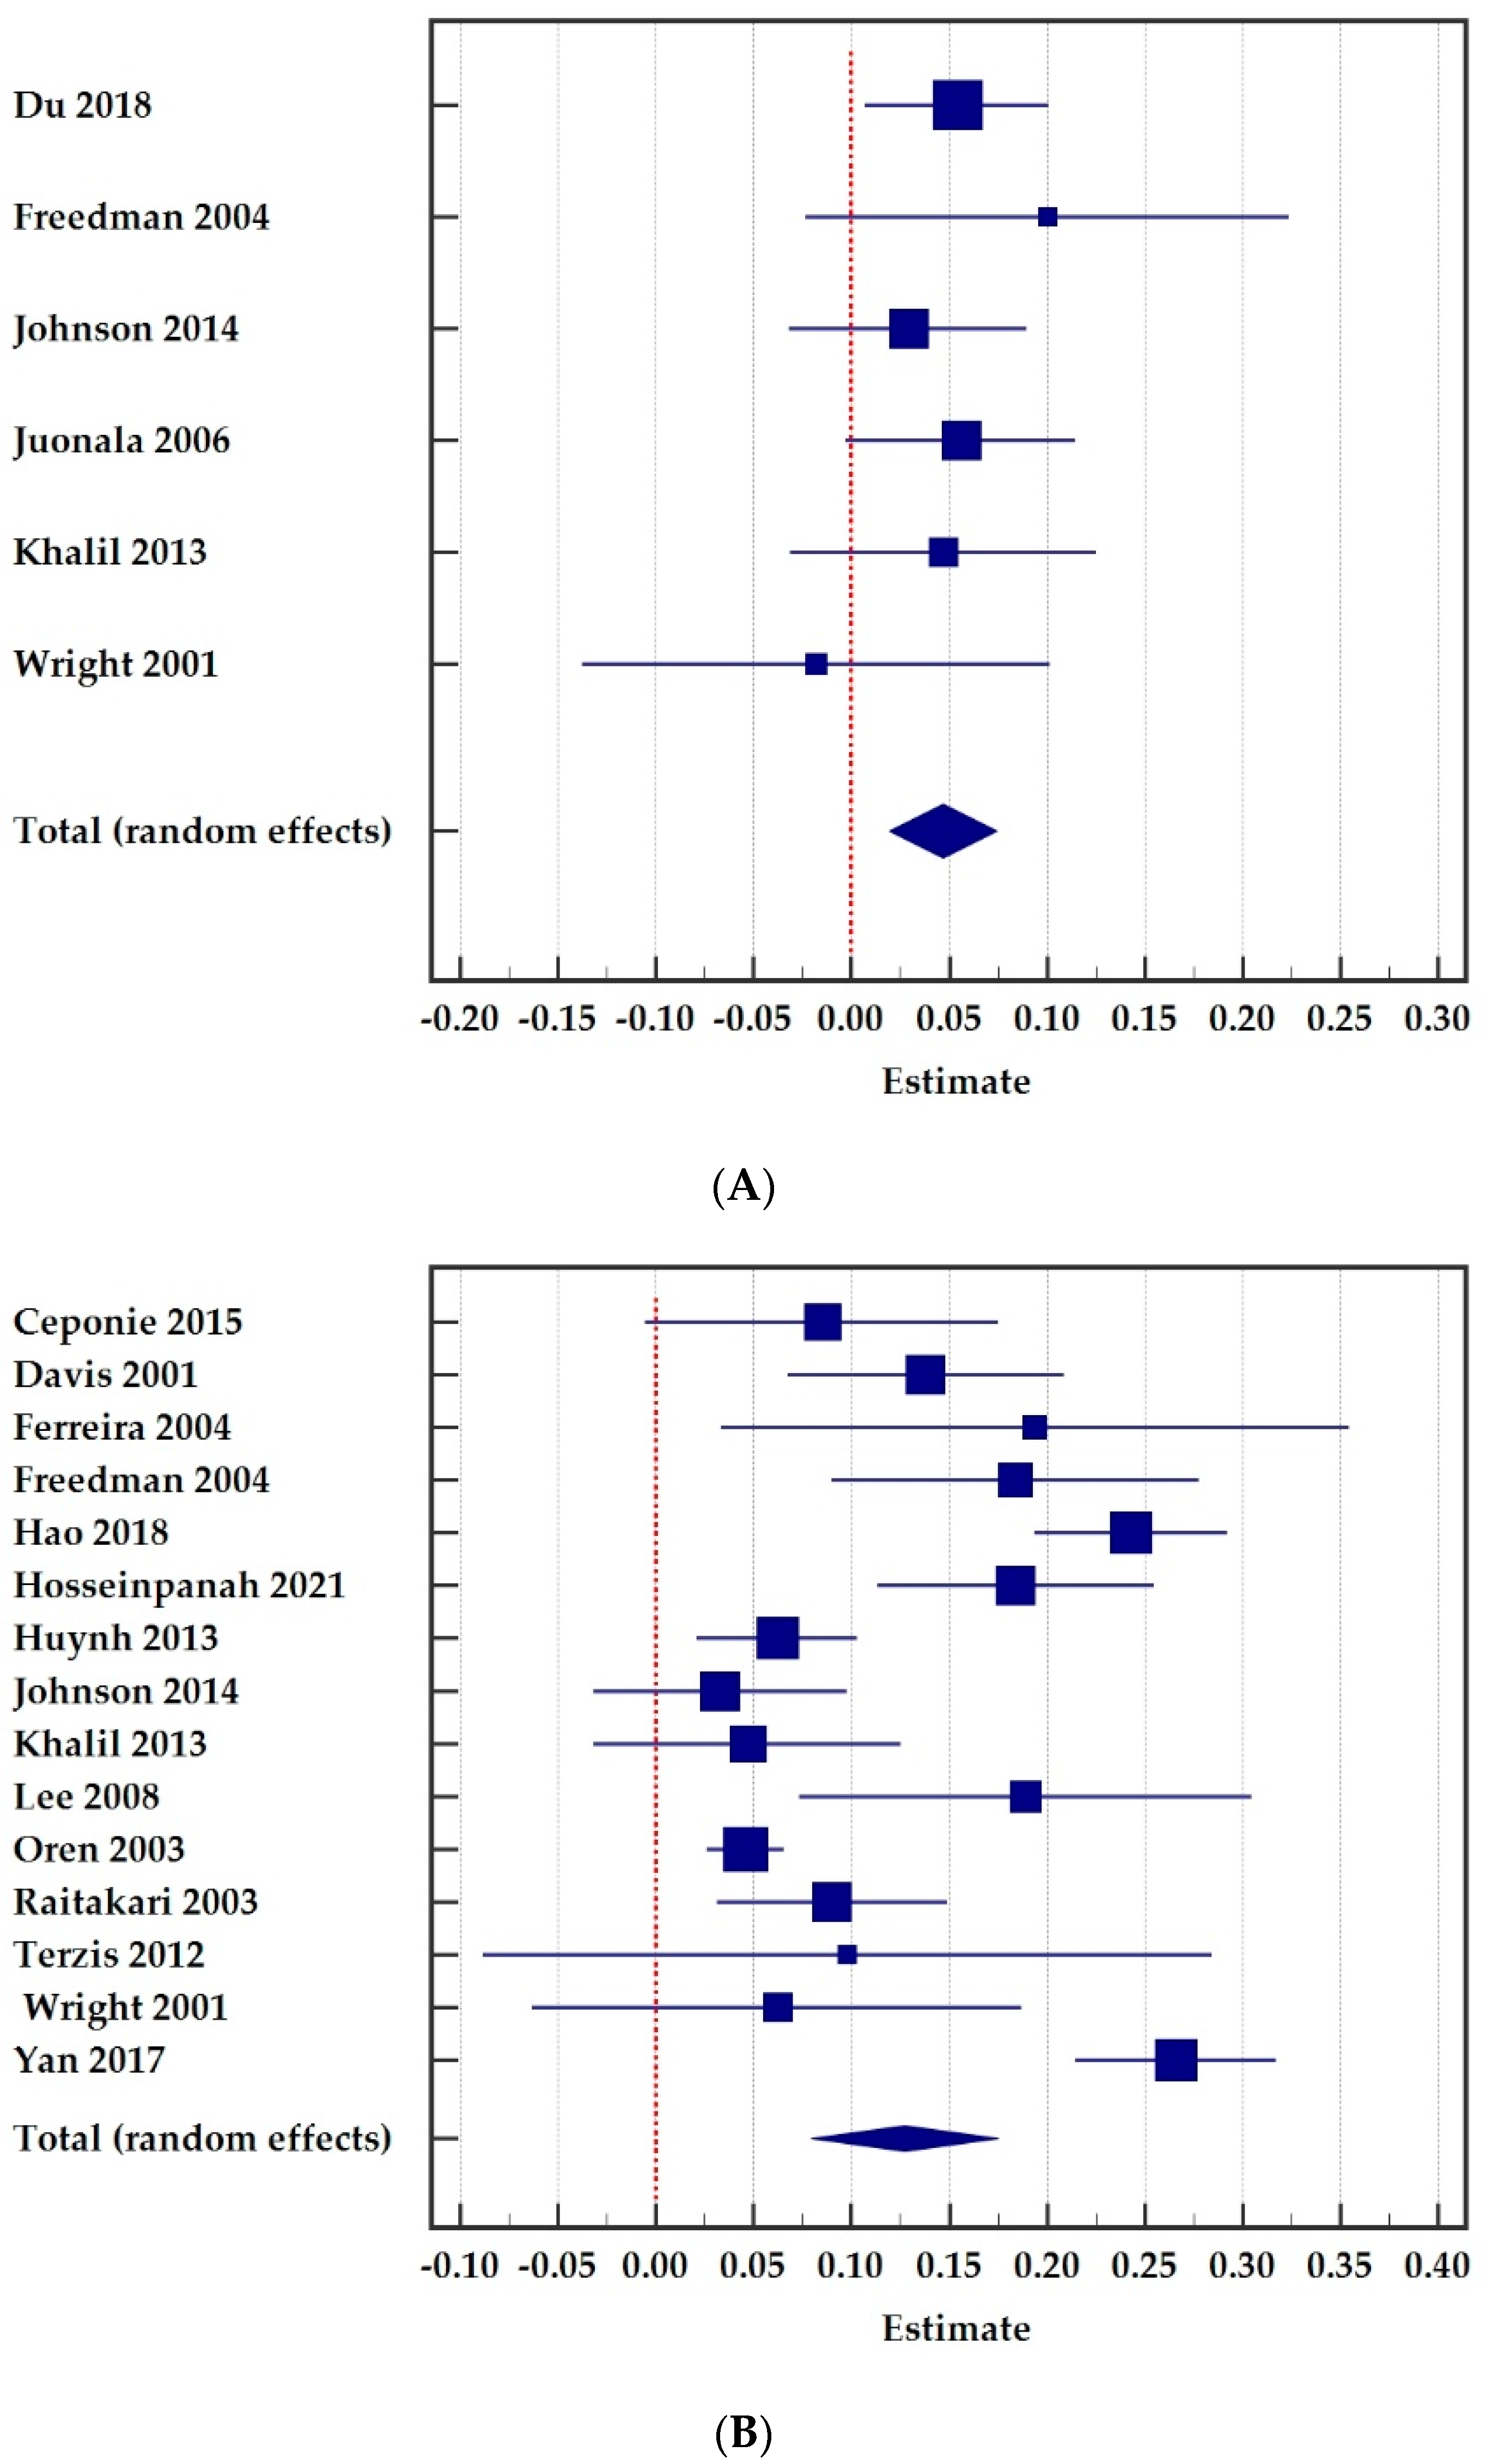
Figure 1. Forest plots for the association between childhood (A) and adolescent (B) body mass index (BMI) and adult carotid intima-media thickness (cIMT). Total number of individuals was 5796 in childhood and 11,859 in adolescent in the meta-analysis. (A) Childhood. (B) Adolescent.
2. Applications
In the following sub-chapters, I provide examples of meta-analytical studies where the use of the standardized regression coefficient served as a useful tool for synthesizing the results of numerous studies on a particular topic. Unfortunately, I also found meta-analyses where the coefficients r, b and β were confused [11][12][13].
2.1. Public Health
In environmental and public-health research, several outcomes and explanatory factors are often measured by different methods and units of measurement. Dzhambov and co-workers [14] studied whether green spaces and general greenery in the living environment of pregnant women were associated with the birth weight of their infants and what the direction of that effect was. They performed meta-analyses on eight published studies exploring the association of residential greenness and birth weight. The majority of the studies used multivariable linear regression to determine the effect of residential greenery on birthweight adjustments for personal covariates. In the original studies, different indicators were chosen as a proxy for residential greenness. Thus, the standardized regression coefficient offers one solution to pool the findings. The reported pooled β was 0.001 (95% CI = −0.001 to 0.003), showing a non-significant association between greenness and birth weight. The authors noted that the findings were similar when the correlation coefficient was used as an effect-size index.
Keenan A. Ramsay and her co-authors [15] presented in their meta-analysis that higher physical activity (PA) and lower sedentary behavior (SB) are associated with greater skeletal muscle strength and muscle power in older adults. Articles were included in the meta-analyses if the associations between PA or SB measures and hand grip strength or the chair stand test were expressed as adjusted standardized regression coefficients (β) and their 95% CI or SE, or when these could be calculated. They identified considerable heterogeneity in the research design, the definitions of measures of outcome and explanatory variables, and the statistical analyses used to present the associations. This posed methodological challenges to comparing and synthesizing the results.
In healthy individuals and people with chronic pain, an inverse association between physical-activity level and pain has been reported (e.g., more activity and less pain). Jones et al. [16] examined the relation between aerobic capacity and pain in healthy individuals and people with fibromyalgia. They collated their new data with data from previous original studies in healthy individuals. To pool the findings identified by the literature search, standardized regression coefficients and their standard errors were calculated. This involved converting the results of analyses using the correlation, linear regression, or effect sizes of differences between groups and converting these to standardized β coefficients with their standard errors. Then, 95% confidence intervals of the βs were calculated for presentation of the data on forest plots. Interestingly, the authors noted that a pooled effect size for these studies was not calculated, because they presented several effect sizes between various measures of pain and explanatory variables estimated from the same studies. Thus, the findings do not provide independent estimates of an effect. The presented forest plots (standardized β coefficients with their 95% confidence intervals) of findings from studies illustrate clearly that the associations between physical fitness and pain are generally small and are highly variable within and across studies [16].
In 2020, Wang et al. [17] published a well-constructed quantitative summary of prenatal lead (Pb) exposure on birth weight. Because the quantitative variables from each reviewed article were reported using different metrics and different measures of association, they used standardized regression coefficients to allow a combination of findings from the reviewed studies. The pooling of findings was conducted separately for maternal blood and cord blood as measures of exposure variables. In addition, the analyses were restricted to unadjusted findings and to studies that adjusted for potential confounders. There was a significant negative association between prenatal Pb exposure and birth weight. In the unadjusted studies, birth-weight reduction was weakly associated with elevated lead levels in maternal blood (pooled β = −0.094, 95% CI = −0.157 to −0.030) and cord blood (pooled β = −0.120, 95% CI = −0.239 to −0.001). When restricted to the adjusted studies, these associations were weaker.
The study by Nicholas Burrows and his co-authors [18] reported meta-analyses of studies that examined correlations between pain from knee osteoarthritis and physical activity or fitness. The effect sizes from the evaluated original studies were converted to standardized regression coefficients in order to be included on the forest plots and to estimate the pooled standardized coefficient. Data from their own new study were also included in the meta-analysis. From the 33 included studies, 13 provided data for the analysis of the associations between pain and physical activity, and 21 provided data for the associations between pain and fitness. The extracted physical-activity variables were either questionnaire-based measures of activity or objectively measured activity using pedometers or accelerometers. Separate meta-analyses were performed for muscle strength, muscle power, and aerobic capacity. Statistically significant pooled βs were found between objectively measured physical activity and pain severity. The more physically active individuals reported less pain at a baseline measurement, and across the seven-day period of physical-activity measurement.
McLaughlin et al. [19] reviewed studies related to the association between engagement with a physical-activity digital health intervention and physical-activity outcomes. A variety of different methods of association were used across the included studies. For the clearly reported meta-analysis, authors were required to transform several estimates into one consistent effect index. A standardized regression coefficient was chosen as the effect index. Many included studies reported more than one association. For meta-analyses, they used hierarchical selection criteria to select a single association from each study for inclusion in the pooled synthesis. When a study did not provide sufficient data required for meta-analysis (i.e., information to calculate an effect estimate and measure of variability of the effect estimate), the authors excluded this reesarch from the meta-analysis. A meta-analysis of 11 included studies indicated a very small but statistically significant positive association between digital health engagement and physical activity (pooled β = 0.08, 95% CI = 0.01 to 0.14).
2.2. Psychology
Charlie Rioux and co-authors [20] published an interesting study where βs were used to represent the effect size of the interaction between temperament and family variables on substance use or externalizing behaviors while controlling for the other variables included in the tested model of the various studies. The authors searched for studies examining the interactions between temperament and the family environment on the outcome variables. Analyses of the interactions between two explanatory variables can be conducted using ANOVA techniques or with multiple regression models. The interpretation of the interactions is difficult because different patterns of interaction among temperament and family variables may have different implications. Due to issues with interaction terms and differences in measurements, the researchers were cautious and did not report pooled effect sizes. However, the reported individual effect sizes and their interpretation in the text still provide useful information about the possible interaction between the analyzed explanatory variables.
Kaitlin Woolley and Ayelet Fishbach [21] examined the relationship between immediate versus delayed rewards and persistence in long-term goals (e.g., healthy eating, exercising). The authors conducted five different intervention studies to examine the associations. In each study, they conducted a regression analysis to estimate the associations and reported βs. Finally, they pooled the βs using a meta-analytic approach to estimate an overall pattern across the five studies. In summary, whereas delayed rewards may motivate goal setting and the intentions to pursue long-term goals, a meta-analysis of their studies found that immediate rewards are more strongly associated with actual persistence in a long-term goal. The effect of immediate rewards on persistence, controlling for delayed rewards, was considered to be of medium size and statistically significant, (pooled β = 0.35, 95% CI = 0.28 to 0.42, p < 0.001).
Choi et al. [22] used a similar approach to Wooley and Fishbach [21] and combined the findings from five different studies using β as the effect size. In each sub-study, they examined predictors of success in different achievement domains using regression models. By conducting meta-analyses, they explored the overall pattern across the studies. Their findings indicate that self-control is predictive of success in achievement-related domains (β = 0.27, 95% CI = 0.21 to 0.32), while emotional well-being is predictive of success in relationship-related domains (β = 0.36, 95% CI = 0.29 to 0.43).
Two meta-analyses have examined the pain-related factors in individuals with chronic musculoskeletal pain [23][24]. In both studies, standardized regression coefficients and their 95% confidence intervals were calculated for the pooled results. Reviewed studies were excluded from these analyses if they did not provide sufficient information for computing the SE of the regression coefficient. Greater levels of fear of pain, pain-related anxiety, and fear-avoidance beliefs were significantly associated with greater pain intensity and disability [23]. In addition, higher levels of overly negative thoughts in response to pain or pain-related cues were associated with more pain intensity and disability levels [24]. The authors comment that an important observation in their reviews was that despite the very large number of studies that have been performed to evaluate the associations between pain-related factors and both pain and disability, the quality of the studies tended to be very low. These included issues in statistical analyses and reporting. These shortcomings made it difficult to carry out meta-analyses.
2.3. Other Sub-Fields
The paper by Yong Jei Lee and collaborators [25] is an example from criminology. The aim of their work was to show how many standard deviations in the number of crimes will change per a standard-deviation increase (or decrease) in the police-force size variable in the USA. They pooled standardized regression coefficients from 62 studies to estimate the overall effect size. The estimated pooled effect size was −0.030 (95% CI = −0.078 to 0.019). The nonsignificant and tiny mean effect size between police-force size and crime suggests that simply increasing police-force size may not help reduce crime, and if it does, then it does not reduce crime by much.
Meta-regression can be used in a meta-analysis to assess the relationship between study-level covariates and effect size [7]. Sanghee Park [26] applied meta-regression to study the effect of various study characteristics on the observed association between gender representation in the workforce and public-organization performance using the pooled β as an effect-size index in 72 studies published between 1999 and 2017. Several covariates explained the variations in the reported βs. Unfortunately, the message of Park’s article is hampered by an inadequate linkage between meta-regression theory and the reporting of the applied field of meta-analysis.
Yahui Tian and Jijun Yao [27] applied meta-analysis to analyze a total of 20 effect sizes from 11 articles on the impact of Chinese school resource investment on student performance. They found that the overall impact of school resources on student performance is significant (pooled β = 0.093, 95% CI = 0.039 to 0.147). Since the standard regression coefficient was used as the effect size in this research, an increase of one standard deviation in school resource investment will increase student performance by 0.093 standard points. It should be noted that combining the effects of human, material and financial resources to an overall amount of resource investment in each study required multiple computational steps.
Standardized regression coefficients have also been applied in economics research. A paper published by Araujo et al. in 2020 provides a comprehensive synthesis of the evidence on macroprudential policies [28]. Drawing from 58 empirical studies, authors summarized the effects of macroprudential policy on several outcomes (e.g., credit, household credit, and house prices). The economic literature does not have a standard definition of the variables used to measure the effects of macroprudential policy. Enhancing the comparability of the effects across studies required the standardization approach to the regression coefficient between the macroprudential-policy variable and the corresponding outcome variable. The research then used a meta-analysis framework to quantitatively synthesize estimated βs. In addition, meta-regression was used to examine how the βs varied with the research characteristics. Relying on β as an effect size in meta-analysis techniques, this research demonstrated that on average, macroprudential-policy tools have statistically significant effects on credit.
References
- Vach, W. Regression Models as a Tool in Medical Research; CRC Press: Boca Raton, FL, USA, 2013; ISBN 978-1-4665-17486.
- Vittinghoff, E.; Shiboski, S.C.; Glidden, D.V.; McCullogh, C.E. Regression Methods in Biostatistics: Linear, Logistic, Survival and Repeated Measures Models; Springer: Berlin/Heidelberg, Germany, 2005; ISBN 0-387-20275-7.
- Nieminen, P.; Lehtiniemi, H.; Vähäkangas, K.; Huusko, A.; Rautio, A. Standardised regression coefficient as an effect size index in summarising findings in epidemiological studies. Epidemiol. Biostat. Public Health 2013, 10, e8854-2.
- Bowman, N.A. Effect Sizes and Statistical Methods for Meta-Analysis in Higher Education. Res. High. Educ. 2012, 53, 375–382.
- Cohen, J. Statistical Power Analysis for the Behavioral Sciences, 2nd ed.; Erlbaum: Hillsdale, MI, USA, 1988; ISBN 0-8058-0283-5.
- Fey, C.F.; Hu, T.; Delios, A. The Measurement and Communication of Effect Sizes in Management Research. Manag. Organ. Rev. 2022, 1–22.
- Borenstein, M.; Hedges, L.V.; Higgins, J.P.T.; Rothstein, H.R. Introduction to Meta-Analysis, 2nd ed.; John Wiley & Sons, Ltd.: Oxford, UK, 2021; ISBN 978-1-119-55835-4.
- Shadish, W.R.; Haddock, C.K. Combining estimates of effect size. In The Handbook of Research Synthesis and Meta-Analysis, 2nd ed.; Russell Sage Foundation: New York, NY, USA, 2009; pp. 257–277. ISBN 978-0-87154-163-5.
- Deeks, J.J.; Higgins, J.P.; Altman, D.G. Chapter 10: Analysing data and undertaking meta-analyses. In Cochrane Handbook for Systematic Reviews of Interventions; Higgins, J.P.T., Thomas, J., Chandler, J., Cumpston, M., Li, T., Page, M.J., Welch, V.A., Eds.; Cochrane: London, UK, 2022.
- Gignac, G.E.; Szodorai, E.T. Effect size guidelines for individual differences researchers. Personal. Individ. Differ. 2016, 102, 74–78.
- García-Hermoso, A.; Saavedra, J.M.; Ramírez-Vélez, R.; Ekelund, U.; del Pozo-Cruz, B. Reallocating sedentary time to moderate-to-vigorous physical activity but not to light-intensity physical activity is effective to reduce adiposity among youths: A systematic review and meta-analysis. Obes. Rev. 2017, 18, 1088–1095.
- Ajala, O.; Mold, F.; Boughton, C.; Cooke, D.; Whyte, M. Childhood predictors of cardiovascular disease in adulthood. A systematic review and meta-analysis. Obes. Rev. 2017, 18, 1061–1070.
- Ribeiro, C.; Mendes, V.; Peleteiro, B.; Delgado, I.; Araújo, J.; Aggerbeck, M.; Annesi-Maesano, I.; Sarigiannis, D.; Ramos, E. Association between the exposure to phthalates and adiposity: A meta-analysis in children and adults. Environ. Res. 2019, 179, 108780.
- Dzhambov, A.M.; Dimitrova, D.D.; Dimitrakova, E.D. Association between residential greenness and birth weight: Systematic review and meta-analysis. Urban For. Urban Green. 2014, 13, 621–629.
- Ramsey, K.A.; Rojer, A.G.M.; D’Andrea, L.; Otten, R.H.J.; Heymans, M.W.; Trappenburg, M.C.; Verlaan, S.; Meskers, C.G.M.; Maier, A.B. The association of objectively measured physical activity and sedentary behavior with skeletal muscle strength and muscle power in older adults: A systematic review and meta-analysis. Ageing Res. Rev. 2021, 67, 101266.
- Jones, M.D.; Booth, J.; Taylor, J.L.; Barry, B.K. Limited association between aerobic fitness and pain in healthy individuals: A cross-sectional study. Pain Med. 2016, 17, 1799–1808.
- Wang, D.; Fu, X.; Zhang, J.; Xu, C.; Hu, Q.; Lin, W. Association between blood lead level during pregnancy and birth weight: A meta-analysis. Am. J. Ind. Med. 2020, 63, 1085–1094.
- Burrows, N.J.; Barry, B.K.; Sturnieks, D.L.; Booth, J.; Jones, M.D. The Relationship between Daily Physical Activity and Pain in Individuals with Knee Osteoarthritis. Pain Med. 2020, 21, 2481–2495.
- Mclaughlin, M.; Delaney, T.; Hall, A.; Byaruhanga, J.; Mackie, P.; Grady, A.; Reilly, K.; Campbell, E.; Sutherland, R.; Wiggers, J.; et al. Associations Between Digital Health Intervention Engagement, Physical Activity, and Sedentary Behavior: Systematic Review and Meta-analysis. J. Med. Internet Res. 2021, 23, e23180.
- Rioux, C.; Castellanos-Ryan, N.; Parent, S.; Séguin, J.R. The interaction between temperament and the family environment in adolescent substance use and externalizing behaviors: Support for diathesis-stress or differential susceptibility? Dev. Rev. 2016, 40, 117–150.
- Woolley, K.; Fishbach, A. Immediate Rewards Predict Adherence to Long-Term Goals. Personal. Soc. Psychol. Bull. 2017, 43, 151–162.
- Choi, I.; Lim, S.; Catapano, R.; Choi, J. Comparing two roads to success: Self-control predicts achievement and positive affect predicts relationships. J. Res. Pers. 2018, 76, 50–63.
- Martinez-Calderon, J.; Flores-Cortes, M.; Morales-Asencio, J.M.; Luque-Suarez, A. Pain-Related Fear, Pain Intensity and Function in Individuals With Chronic Musculoskeletal Pain: A Systematic Review and Meta-Analysis. J. Pain 2019, 20, 1394–1415.
- Martinez-Calderon, J.; Jensen, M.P.; Morales-Asencio, J.M.; Luque-Suarez, A. Pain Catastrophizing and Function in Individuals with Chronic Musculoskeletal Pain. Clin. J. Pain 2019, 35, 279–293.
- Lee, Y.J.; Eck, J.E.; Corsaro, N. Conclusions from the history of research into the effects of police force size on crime—1968 through 2013: A historical systematic review. J. Exp. Criminol. 2016, 12, 431–451.
- Park, S. Gender and performance in public organizations: A research synthesis and research agenda. Public Manag. Rev. 2021, 23, 929–948.
- Tian, Y.; Yao, J. The Impact of School Resource Investment on Student Performance: A Meta-analysis Based on Chinese Literature. SSRN Electron. J. 2020, 4, 389–410.
- Araujo, J.; Patnam, M.; Popescu, A.; Valencia, F.; Yao, W. Effects of Macroprudential Policy: Evidence from Over 6000 Estimates; IMF Working Paper; International Monetary Fund: Washington, DC, USA, 2020.
More
Information
Subjects:
Others
Contributor
MDPI registered users' name will be linked to their SciProfiles pages. To register with us, please refer to https://encyclopedia.pub/register
:
View Times:
11.6K
Revisions:
3 times
(View History)
Update Date:
14 Sep 2022
Table of Contents


Notice
You are not a member of the advisory board for this topic. If you want to update advisory board member profile, please contact office@encyclopedia.pub.
OK
Confirm
Only members of the Encyclopedia advisory board for this topic are allowed to note entries. Would you like to become an advisory board member of the Encyclopedia?
Yes
No
${ textCharacter }/${ maxCharacter }
Submit
Cancel
Back
Comments
${ item }
|
${ item.createdUser.fullName }
${ item.createdAt }
${ item.vote }
${ item.reply }
Delete
${ reply.createdUser.fullName }
${ reply.createdAt }
${ reply.vote }
Delete
There is no reply to this comment~
${ item.replyTextCharacter }/${ item.replyMaxCharacter }
Submit
Cancel
More
No more~
There is no comment~
${ textCharacter }/${ maxCharacter }
Submit
Cancel
${ selectedItem.replyTextCharacter }/${ selectedItem.replyMaxCharacter }
Submit
Cancel
Confirm
Are you sure to Delete?
Yes
No