1. Support Vector Machine (SVM)
Support vector machine (SVM) is a supervised machine learning algorithm that can be used for classification and regression problems. In the SVM algorithm, each data item is plotted as a point in n-dimensional space where n is the number of features considered, with each feature being the value of a particular coordinate
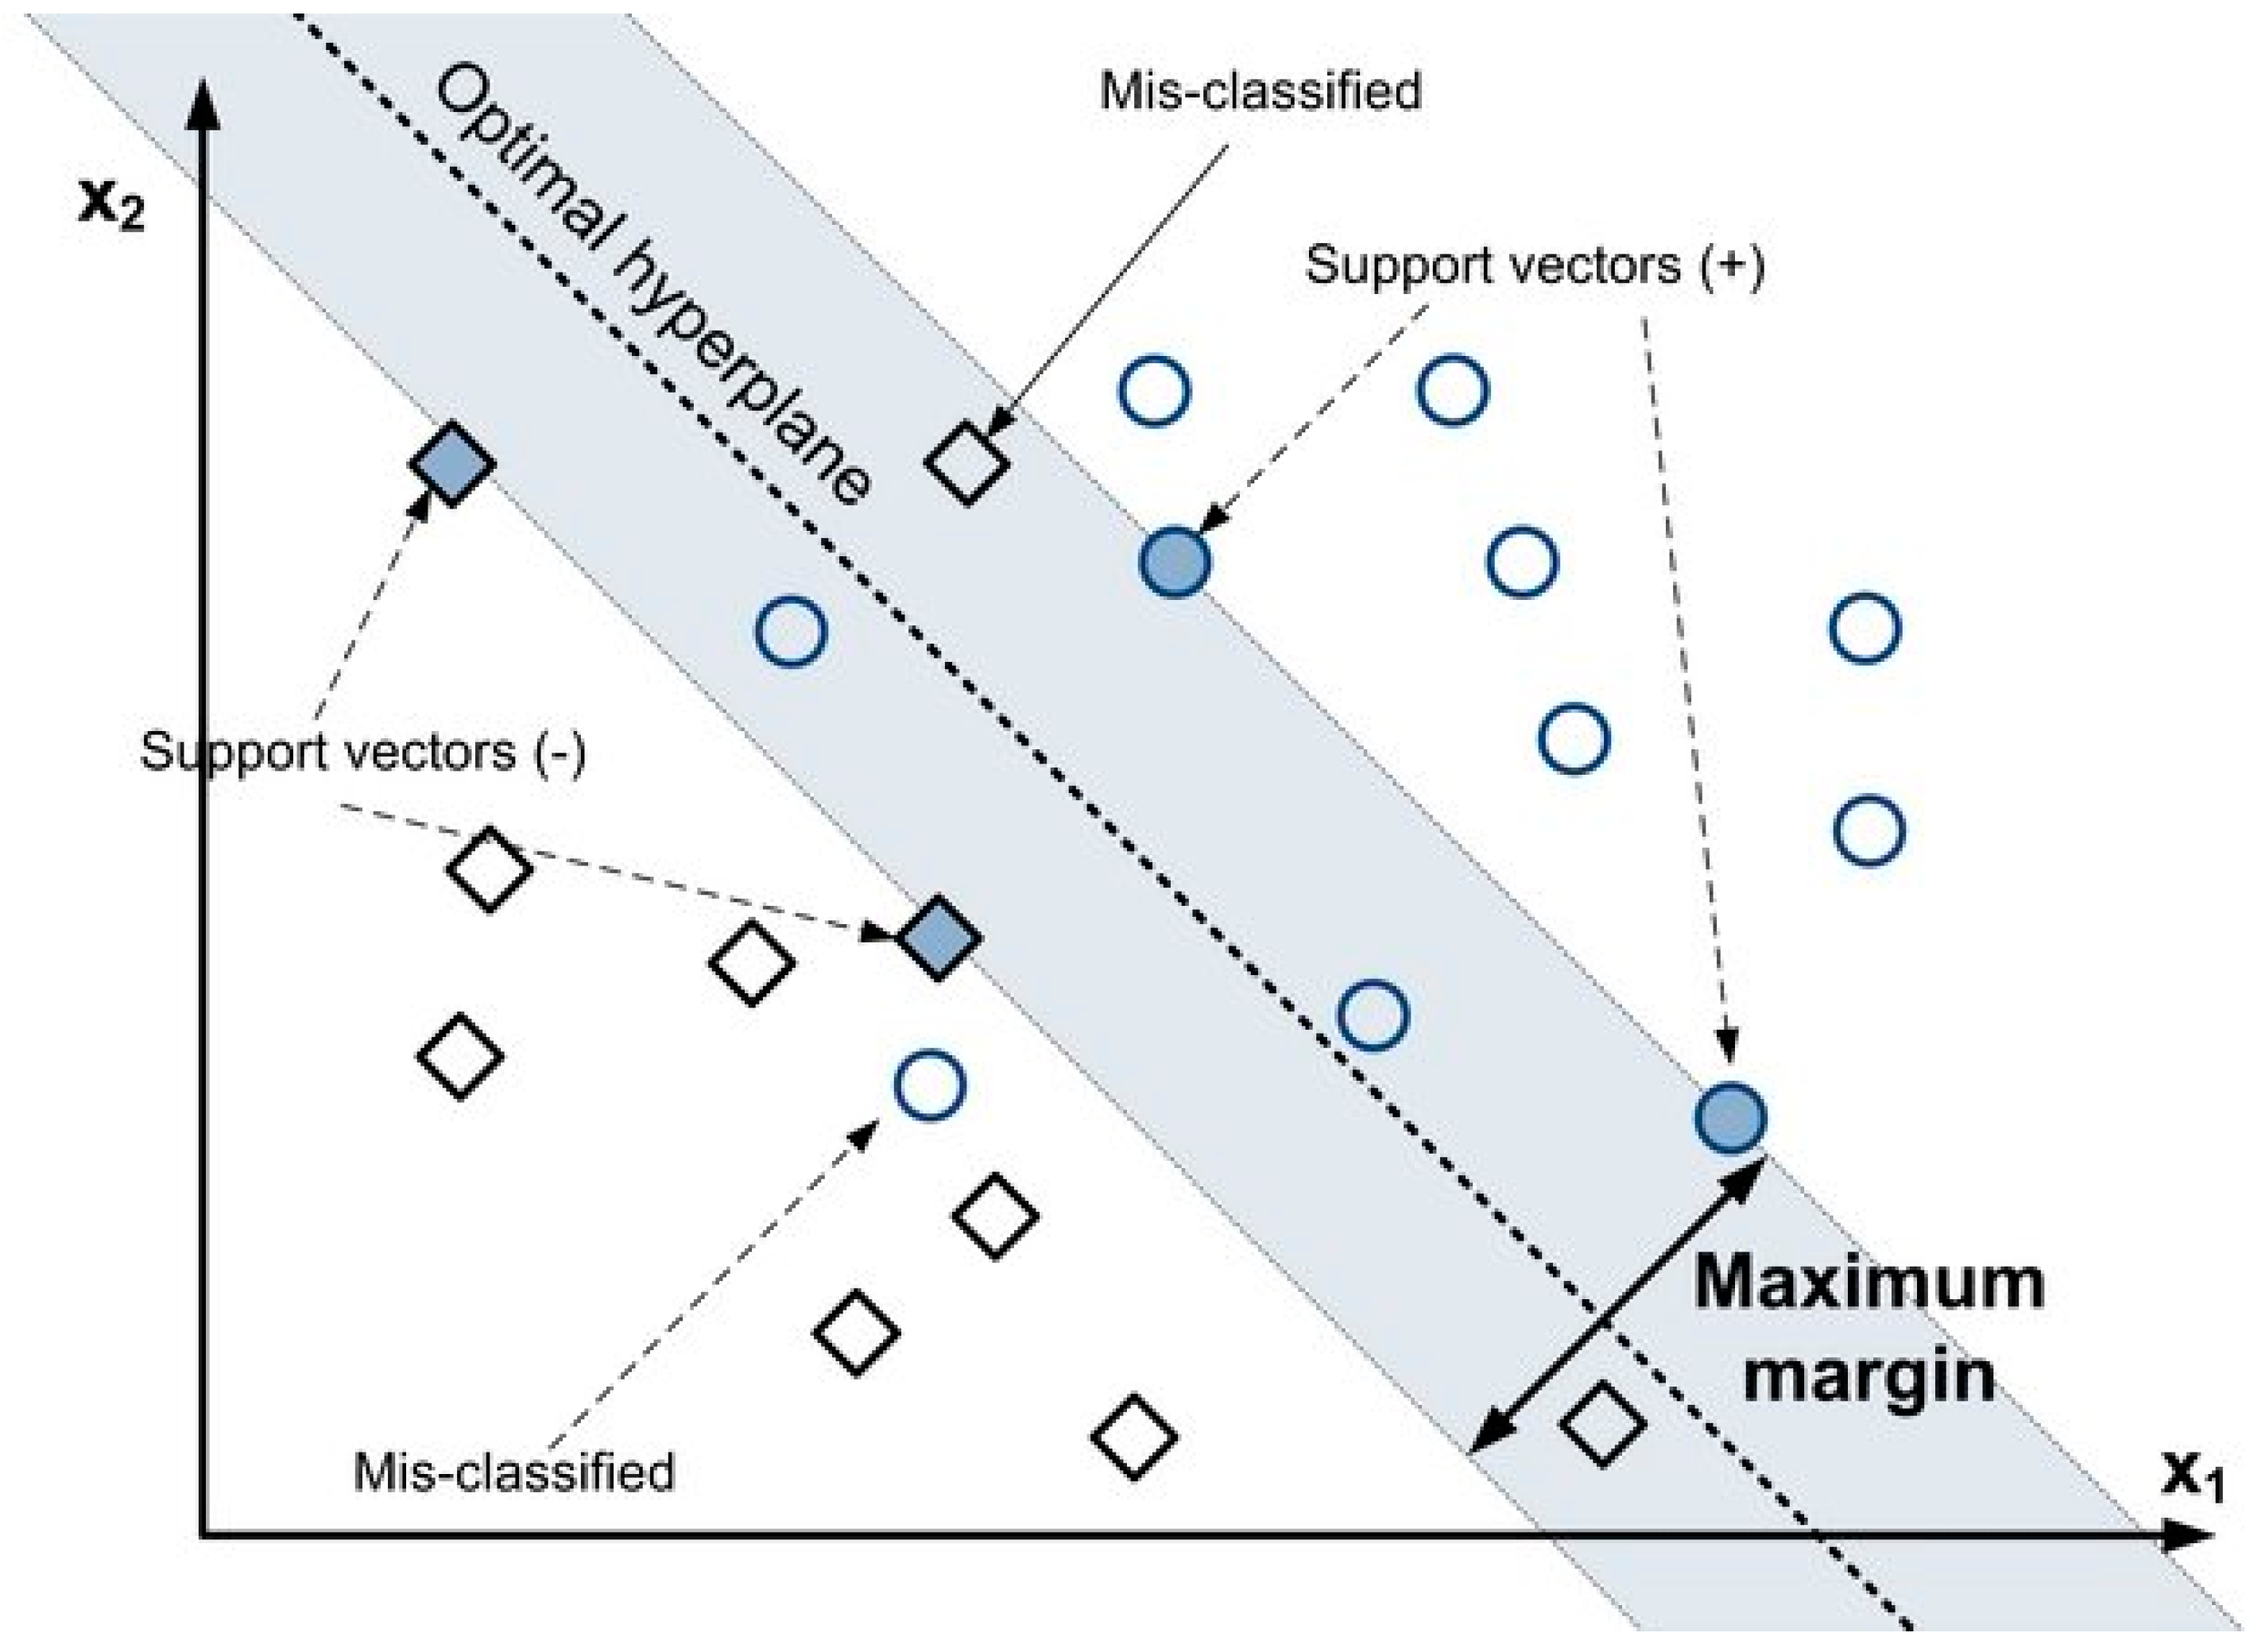
[1]. Then, the aim is to perform classification by finding the hyper-plane that differentiates the two classes very well. SVMs maximize the margin around the separating plane, and the decision function is fully specified by a subset of training samples called the support vectors
[2][3]. The optimal SVM hyperplane for binary classification is represented in
Figure 1.
Figure 1. Optimal hyperplane for binary classification
[4].
A separating hyper plane can be used to divide data that is linear. However, the data is frequently non-linear, and the datasets are closely linked. To account for this, the input data is non-linearly mapped to a high-dimensional space. After that, the new mapping is linearly separable. Kernel trick allows SVM’s to form nonlinear boundaries. The kernel function’s purpose is to allow operations to be conducted in the input space instead of the possibly high-dimensional feature space. As a result, the two classes can be separated in the feature space. Different kernel functions exist, such as polynomial, radial basis function (RBF), and sigmoid function, and the choice of a kernel function is determined by the application
[5]. It can be noted that SVM is mainly used for forecasting failures, fault diagnosis and pattern recognition. The previous works used TTF, TBF, audio signals, vibration data, and fault states as input data for SVM algorithms. From the time horizon, it can be noted SVM was widely popular from 2010 to 2015 in mining.
In
[6], the authors used SVM to detect defects and fault patterns of unexpected heavy equipment failures. SVM classifier was used to divide data as normal and abnormal and only normal data was used for learning using restricted Boltzmann machine (RBM) and then based on patterns, faults in the system were identified. In
[7], the authors used the SVM regression algorithm to forecast TBFs using historical observations of LHD failures. A Pareto analysis detected the LHD’s engine as the most critical system. TBFs of 32 failures were obtained. Twenty-five records were used for SVR modelling and the remaining for testing. Mean absolute percentage error (MAPE) and normalized root mean square error (NRMSE) values were used to evaluate model performance. A polynomial kernel function of the third degree resulted in the best predictions (minimum errors). An absolute percentage error value of less than 2% was achieved, demonstrating excellent forecasting applicability of SVR. In
[8], the authors have explored the application of the SVM classification approach for pattern recognition and failure forecasting on mining shovels. The failure behavior of a fleet of ten mining shovels during 1 year of operation was investigated and the shovels were classified into four clusters using k-means clustering algorithms, based on their reliability. Future failures were predicted using the support vector machine (SVM) classification technique. Historical failure (component type) and time to repair data were used to predict the next failure type for all shovels. Four different kernel functions, namely linear, polynomial, RBF and sigmoid function were examined in combination with different values of C parameter, using a grid search attempt. The best C–K pair that resulted in the maximum number of correct classes for the test dataset was selected for each shovel from each cluster using a grid search method, and the results were validated using particle swarm optimization. The SVM technique was shown to be successful with a prediction accuracy of over 75%. In
[9], the authors proposed principal component analysis (PCA) with the SVM method for fault diagnosis of mine hoists. PCA was used to extract relevant time domain and frequency domain features and using these, a multi-class SVM algorithm model corresponding to nine different fault states output was built. Comparison of various methods showed the PCA-SVM method successfully diagnosed faults in the mine hoists system. The RBF kernel function system had the best classification properties and the accuracy of the model turned out to be around 98%. In
[10], the authors developed a SVM based ensemble model for reliability forecasting of a mine dumper. The hyperparameters of the SVM were selected by applying a genetic algorithm. A case study was conducted investigating a dumper operated at a coal mine in India. Time-to-failure historical data for the LHD were collected, and cumulative time to failure was calculated for reliability forecasting. The hyperparameters of the SVM models were selected using genetic algorithm-based learning. Study results demonstrate that the developed model performs well with high accuracy (determination coefficient R
2 = 0.97) in the prediction of LHD future failure times, and a comparison with other methods demonstrates the superiority of the proposed ensemble SVM model. In
[11], the authors have proposed a classification method for an automated operating mode to increase the performance of vibration-based online condition monitoring systems for applications such as gearboxes, motors, and their constituent components. Several variations of the system have been tested and found to be successful. A swing machinery system of an electromagnetic excavator is used to see how this method functions on dynamic signals gathered from an operating machine. The empty and full swing cycles are the two classification classes with vibration and speed as input parameters. SVM and other classification models were used to analyze swing performance. Data were collected over a period of 45 h on an operation. In
[12], the authors developed a method for monitoring and tracking both location and action for automated construction equipment. The authors have proposed an audio-based method for tracking and activity analysis of heavy construction equipment. The equipment generates distinct sound patterns while performing a certain task and these audio signals are filtered and converted into time–frequency representations. This data is classified into different activity representations using a multiclass SVM classification algorithm, and the results demonstrated the potential capacity to correctly recognize various equipment actions with 80% model accuracy.
2. The k-Nearest Neighbors KNN
The k-nearest neighbors (KNN) method is a supervised machine learning algorithm that can be used to address classification and regression problems
[13]. KNN is a kind of instance-based learning (also known as lazy learning), in which the function is only estimated locally, and all computation is deferred until classification. When there is very little prior knowledge about the data distribution, the KNN is the most basic and simplest classification algorithm. The data points are categorized based on how their neighbors are classified. The algorithm’s idea is that all data points with similar characteristics are in close proximity. Given a K value, the nearest K neighbors are chosen for any new point, and the class containing the most points out of the k points is allocated to the new point. The choice of K, as well as the distance measure used to pick the nearest K points, determine the performance of a KNN classifier. In the case of KNN, a small training sample size can significantly impact the selection of the optimal neighborhood size K, and the sensitivity of K selection can significantly decrease KNN classification performance. In general, KNN is susceptible to data sparsity, noisy mislabeled points, and outliers from other classes if the K value chosen is too small or too large
[14][15][16]. From the literature review, it can be inferred that KNN data is recently gaining popularity in mining. It is mainly used in fault diagnosis and real time fault monitoring. Faults are monitored and identified both at system and sub-system levels.
In
[17], the authors studied a historical failure dataset of a dragline to conduct predictive maintenance. The authors used the k-Nearest Neighbors algorithm to predict the failure mode but there was a chance of overfitting in the methodology. Hence, a combination of the genetic algorithm and k-Nearest Neighbor algorithm was applied for the failure dataset. This enhanced the model performance, and the results were better predicted. In another study,
[18], the authors collected vibration signals of main journal-bearings of an IC engine from condition monitoring methods. The vibration signals were classified under normal, oil starvation, and extreme wear fault. Thirty features were extracted from the processing of signals, and KNN and ANN were applied to train the dataset and later for diagnostic use. Variable K ranging from 1 to 20 with the step size of 1 was used to get better classification results. The experimental results showed diagnostic methods were reliable in separating fault conditions in the bearings. In
[19], the authors proposed a new methodology of weighted k-Nearest Neighbor classifier where a square inverse weighting technique was used to improve the accuracy of the KNN model for fault diagnosis of rolling bearing elements. Three bearing conditions were classified: healthy, inner, and outer race fault. The algorithm indicated that this method enables fault detection in bearings with high accuracy. In
[20], the authors presented a fault diagnosis technique based on acoustic emission (AE) analysis with the Hilbert–Huang transform (HHT) and data mining tool. In
[21], the authors proposed a real-time online fault diagnosis method for rolling bearings based on the KNN algorithm. The rolling bearing vibration signal is preprocessed, and feature parameters are extracted. The data was preprocessed, with 100 raw points as one sample, for a total of 8496 samples. Different classification models like decision tree C4.5, CART algorithm and KNN were used to classify fault data. Real-time online extraction of the characteristic parameters of the vibration signal was used to realize real-time online faults through the fault diagnosis model. Results show that the fault diagnosis model based on the KNN algorithm is better than the fault diagnosis model.
3. Naïve Bayes Classifier
Naïve Bayes, a supervised machine learning algorithm, assumes an underlying probability distribution and captures uncertainty about the model logically by calculating probabilities of occurrences. It is used to solve diagnostic and predictive issues. It calculates explicit hypothesis probabilities and is robust to noise in the input data
[22]. The naïve Bayes algorithm is a straightforward probability classifier that derives a set of probabilities by counting the frequency and combinations of values in a data set. When assessing the value of the class variable, the method applies Bayes’ theorem and assumes that all variables are independent. In a range of controlled categorization challenges, the algorithm learns quickly
[23].
There are different types of Naïve Bayes classifiers. When characteristic values are continuous, it is assumed that the values associated with each class are spread according to the Gaussian distribution, which is the Normal distribution. On multinomial distributed data, multinomial naïve Bayes is preferred. Bernoulli naïve Bayes is employed when data is distributed according to multivariate Bernoulli distributions. That is, multiple features exist, but each one is considered to have a binary value. As a result, binary values are required for features
[24][25]. Naïve Bayes has recently earned a lot of attention because of its high learning and prediction accuracy, and more importantly, the algorithm works well for mining data and conditions. In the literature work, naïve Bayes was used in fault diagnosis and assessing faults’ damage and fault classifications.
In
[26], the authors predicted RUL of bearings using the naïve Bayes algorithm. Firstly, the statistical method is used to extract the features of the vibration signal, and the root mean square (RMS) is regarded as the main performance degradation index. Second, the correlation coefficient is used to select the statistical characteristics that have high correlation with the RMS. Then, in order to avoid the fluctuation of the statistical feature, the improved Weibull distributions (WD) algorithm is used to fit the fluctuation feature of bearings at different recession stages, which is used as the input of the naïve Bayes (NB) training stage. During the testing stage, the true fluctuation feature of the bearings is used as the input of NB. After the NB testing, five classes are obtained: health states and four states for bearing degradation. Finally, the exponential smoothing algorithm is used to smooth the five classes and to predict the RUL of bearings. The experimental results show that the proposed method is effective for RUL prediction of bearings. In
[22], the authors used Naïve Bayes for bearing fault diagnosis on enhanced independent data. Data-based fault diagnostics of mechanical components has become a new hotspot. Their approach was based on processing the data vector (attribute feature and sample dimension) to reduce the limitations of Naïve Bayes by an independence hypothesis. The statistical characteristics of the bearings’ original signal were extracted, decision trees were used to select important features of the signal, and low correlation features were selected. The authors used SVM models in the next step to prune redundant vectors, and in the last step used Naïve Bayes on the processed data to diagnose faults. In
[27], the authors studied non-repairable equipment with multiple and independent failure modes, where only incomplete information about the failure mode was obtained through condition monitoring. The study focused on obtaining a probability matrix representing the relationship between actual health and condition monitoring information of the equipment and Naïve Bayes was used as a classifier to classify each failure mode based on the degree of damage. An experimental planetary gearbox system is used to gather condition monitoring data for damage degree classification considering four failure modes. A forward feature selection is used to find the best set of features. The classification accuracy increases to 94.76%. In
[28], the authors applied a Naïve Bayes classifier for diagnosing faults of rolling element bearings and indicated that the Naïve Bayes classifier presented higher levels of accuracy of 96% without any feature engineering requirement.
4. Decision Tree
Decision tree is a supervised machine learning method for constructing classification systems based on multiple parameters or generating prediction algorithms for a target variable. In this method, a population is divided into branch-like segments that form an inverted tree with a root node, internal nodes, and leaf nodes. The algorithm is non-parametric and can handle huge, complex datasets without imposing a complex parametric framework
[29]. Decision trees are mainly effective in handling non-linear datasets. Like stepwise selection in regression analysis, decision tree methods can be used to pick the most relevant predictor variables from a large number of features in datasets and to assess the relative importance of these variables on the decision variable. Moreover, decision trees can also handle missing data very well. It is also easy to handle a variety of input data: nominal, numeric and textual
[30].
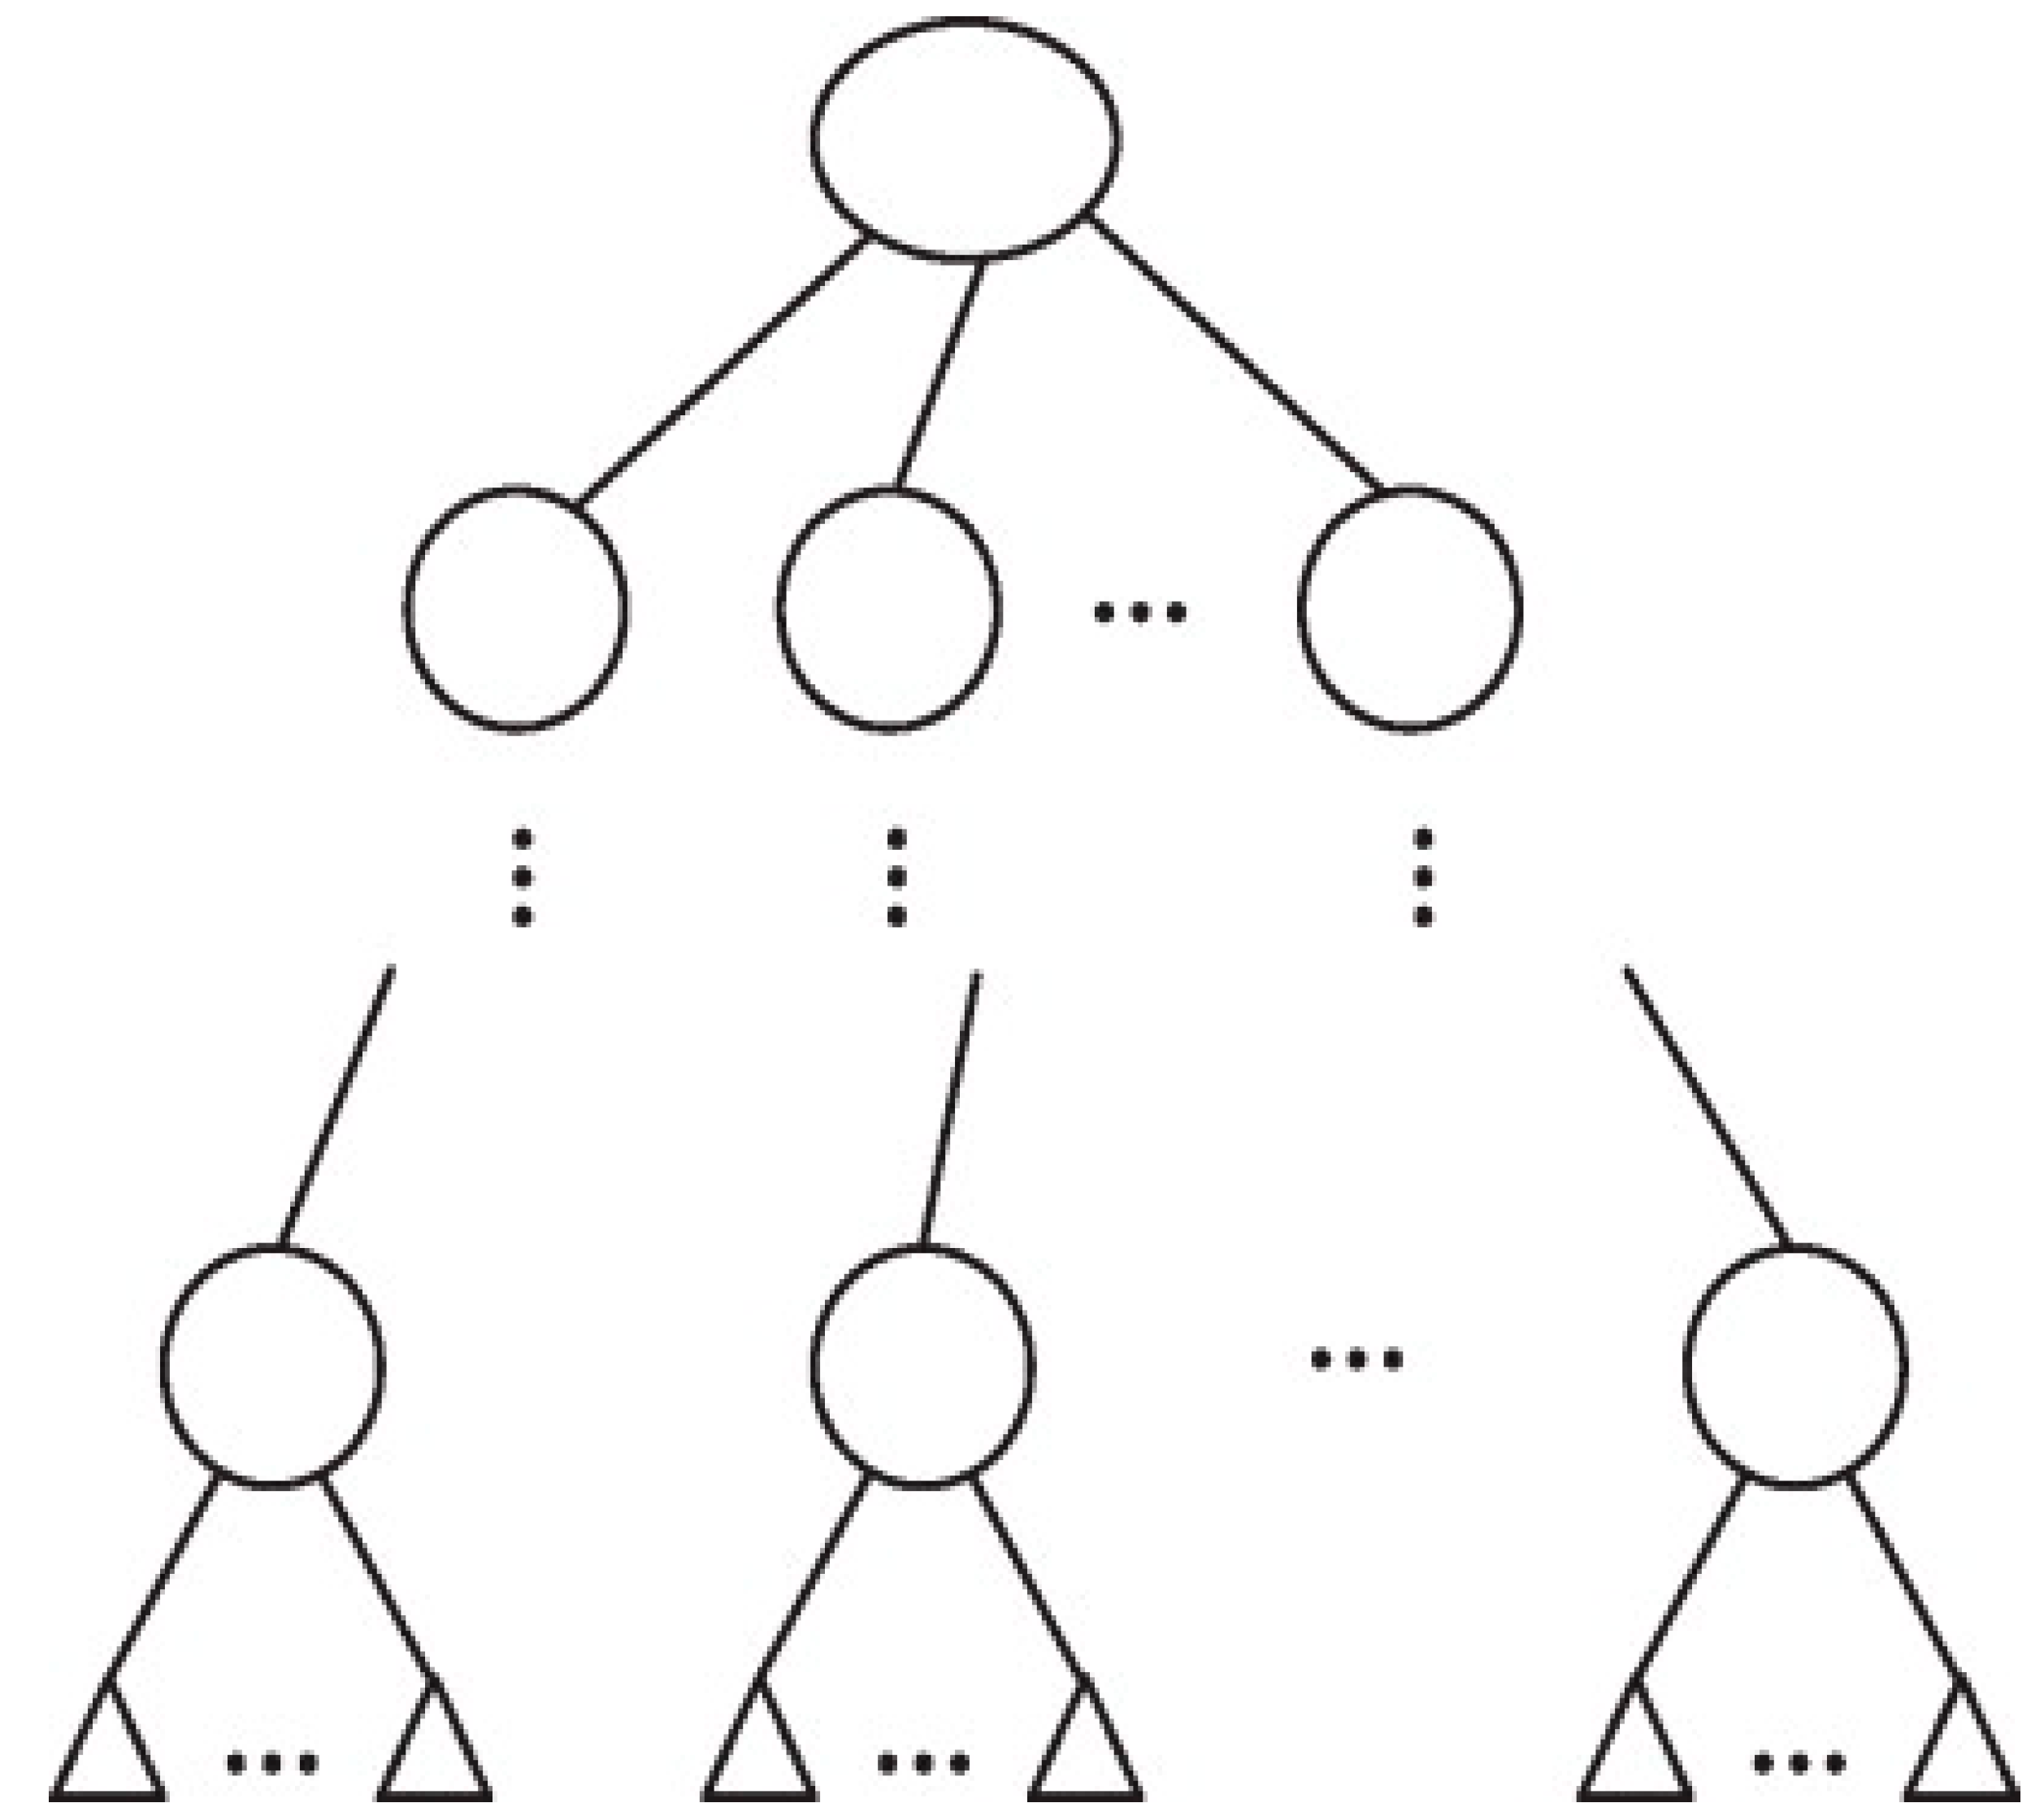
However, other target functions of the decision tree can also include, minimizing the number of nodes or minimizing the average depth to find the most important predictors. Pruning is the practice of removing redundant nodes from a tree to obtain the best decision tree possible. A general decision tree structure is represented in Figure 2.
Figure 2. A general decision tree structure
[31].
In
[32], the authors in their work proposed an equipment reliability model for pumps, designed by applying a data extraction algorithm on equipment maintenance records residing in SAP applications. The author has initially applied unsupervised learning to perform cluster evaluation. Thereafter, the data from the finalized model was applied to a supervised learning algorithm where the classifier was trained to predict equipment breakdown. The classifier was tested on test data sets where it was observed that support vector machine (SVM) and decision tree (DT) algorithms were able to classify and predict equipment breakdown with high accuracy and a true positive rate (TPR) of more than 95 percent.
In
[33], the authors proposed the fault diagnosis method of an industrial ventilator (Fan) based on analysis-decision trees. The operating of the fan was followed in five different conditions: a healthy condition and then affected by four different faults, those affecting inner and outer races of rolling bearings, the mass unbalance and mechanical looseness. Fifteen factors including mean, median, variance indicators (including the greatest three peaks by amplitude in each condition) that described the vibration signals were extracted for each spectrum. In each condition, 30 signals were recorded to have 150 indicator vectors, divided into two sets. Twelve trees were built on the base of numeric attributes, DecisionStump, FT, J48, J48graft, LADTree, LMT, NBTree, RandomForest, RandomTree, REPTree, and SimpleCart. Genetic algorithms optimized the finding of the best choice representative tree. The RandomForest Tree is preconized for establishing a diagnostic tool for the studied industrial Fan. In
[34], the authors emphasize the problem of finding out good features that discriminate the different fault conditions of the bearing. The selection of good features is an important phase in pattern recognition and requires detailed domain knowledge. Their paper illustrated the use of a Decision Tree that identifies the best features from a given set of samples for the purpose of classification. It uses Proximal Support Vector Machine (PSVM), which has the capability to efficiently classify the faults using statistical features. The criterion used to identify the best feature invokes the concepts of entropy reduction and information gain that are used in Decision Tree. The vibration signal from a piezoelectric transducer is captured for the following conditions: good bearing, bearing with inner race fault, bearing with outer race fault, and inner and outer race fault. The statistical features are extracted using decision tree and classified successfully using PSVM and SVM. In
[35], the authors used Decision Tree combined with Bayesian network for fault diagnosis of motor faults. This entry describes the model structure and the basic ideas of Decision Tree and Bayesian network, combines the advantages of the two, and solves the uncertainty of diagnosis information effectively.
5. Logistic Regression
In binary classification, logistic regression analysis performs exceptionally well, particularly with categorical variables with [0, 1] classes. Based on the values of predictor variables, either categorical or numerical, logistic regression models can estimate the likelihood of a failure occurrence
[36]. In logistic regression, the dependent variable has a Bernoulli distribution. Thus, for any given linear combination of independent variables, an unknown probability, P, of the response variable is estimated. To do so, a link function must be used to link the independent variables to Bernoulli’s distribution, with the natural log of the odds ratio or the logit acting as the link function. This function converts a linear combination of explanatory variables to Bernoulli’s probability distribution, which has a domain of 0 to 1.
Logistic regression is a supervised learning technique often used in failure predictions and preventive maintenance strategies. Cost data, failure data, sensor data and acoustic electric signals were the input data used in logistic regression in previous work. The algorithm was used to predict economic success, RPN, machine state in the next 24 h given the current state and equipment reliability.
In
[37], the authors used logistic regression models based on cost to accurately predict economic success or failure using the fleet data for 378 single axle dump trucks. In
[38], the authors proposed a systematic approach for developing a standard equation for the risk priority number (RPN) measure, using the methodology of interval number-based logistic regression. The aim is to reduce risks of failure, using FMEA in terms of the risk priority number (RPN). The logistic regression model helped identify the probability of risk of failure of high-capacity submersible pumps. Another study aimed to propose a model for predicting mechanical equipment failure from various sensor data collected in the manufacturing process. This study constructed a Hadoop-based big data platform to distribute many datasets for research, and performed logistic regression modelling to predict the main variables causing the failure from various collected variables. As a result of the study, the main variables in the manufacturing process that cause equipment failure were derived from the collected sensor data, and the fitness and performance evaluations for the prediction model were made using the ROC curve
[39]. In
[40], the authors applied logistic regression to predict machine state 24 h in the future, given the current machine state. A confusion matrix was used to evaluate model performance. In
[41], the authors used logistic regression models and acoustic emissions (AE) to evaluate the reliability of the cutting tool to determine best maintenance practice. As it is difficult to monitor cutting forces in practice, a combination of both AE and logistic models are effective in reliability analysis. Reliability models are constructed using AE signals and cutting force as parameters. The results show that AE feature extractions and logistic models work effectively in reliability estimations.
6. K-Means Algorithm
K-Means clustering is an unsupervised learning approach that is used in machine learning to handle clustering problems. It divides the unlabeled data into many clusters. The K-Means clustering method is easy and accurate, flexible to handle large data, has a good speed of convergence, and has adaptability to sparse data. K-Means clusters the data into different groups and provides a simple technique to determine the categories of groups in an unlabeled dataset without any training. It is a centroid-based approach, where each cluster has its own centroid. The goal of this algorithm is to minimize the sum of distances between the data point and their corresponding clusters. The K-means clustering algorithm finds the best value for K center points or centroids by an iterative process and assigns each data point to its closest K-center. Those points which are near to the K-center create a cluster. The distance of the point from the centroid in each step is calculated using Euclidean method. Hence data points from each cluster are similar in some way and are far from other clusters. The K value is user defined for the algorithm that is generated. The Elbow method is the most popular way that helps in selecting the optimal K value. The method is based on minimizing within cluster sum of square values (WCSS) that defines total variation in the data
[42].
In
[43], the authors have tried to implement a clustering method to group maintainable equipment based on their need for maintenance according to time to failure, and the location of these machines. The main aim was to reduce scheduling process and time and a standard maintenance procedure for the machines in each cell. In
[44], the authors examined the condition-based equipment data using a data analytics approach to develop a predictive maintenance program. K-means for clustering the failure characteristic, support vector regression (SVR) model used for predicting equipment failure were the two models used in their study.
7. The Neural Network ANN
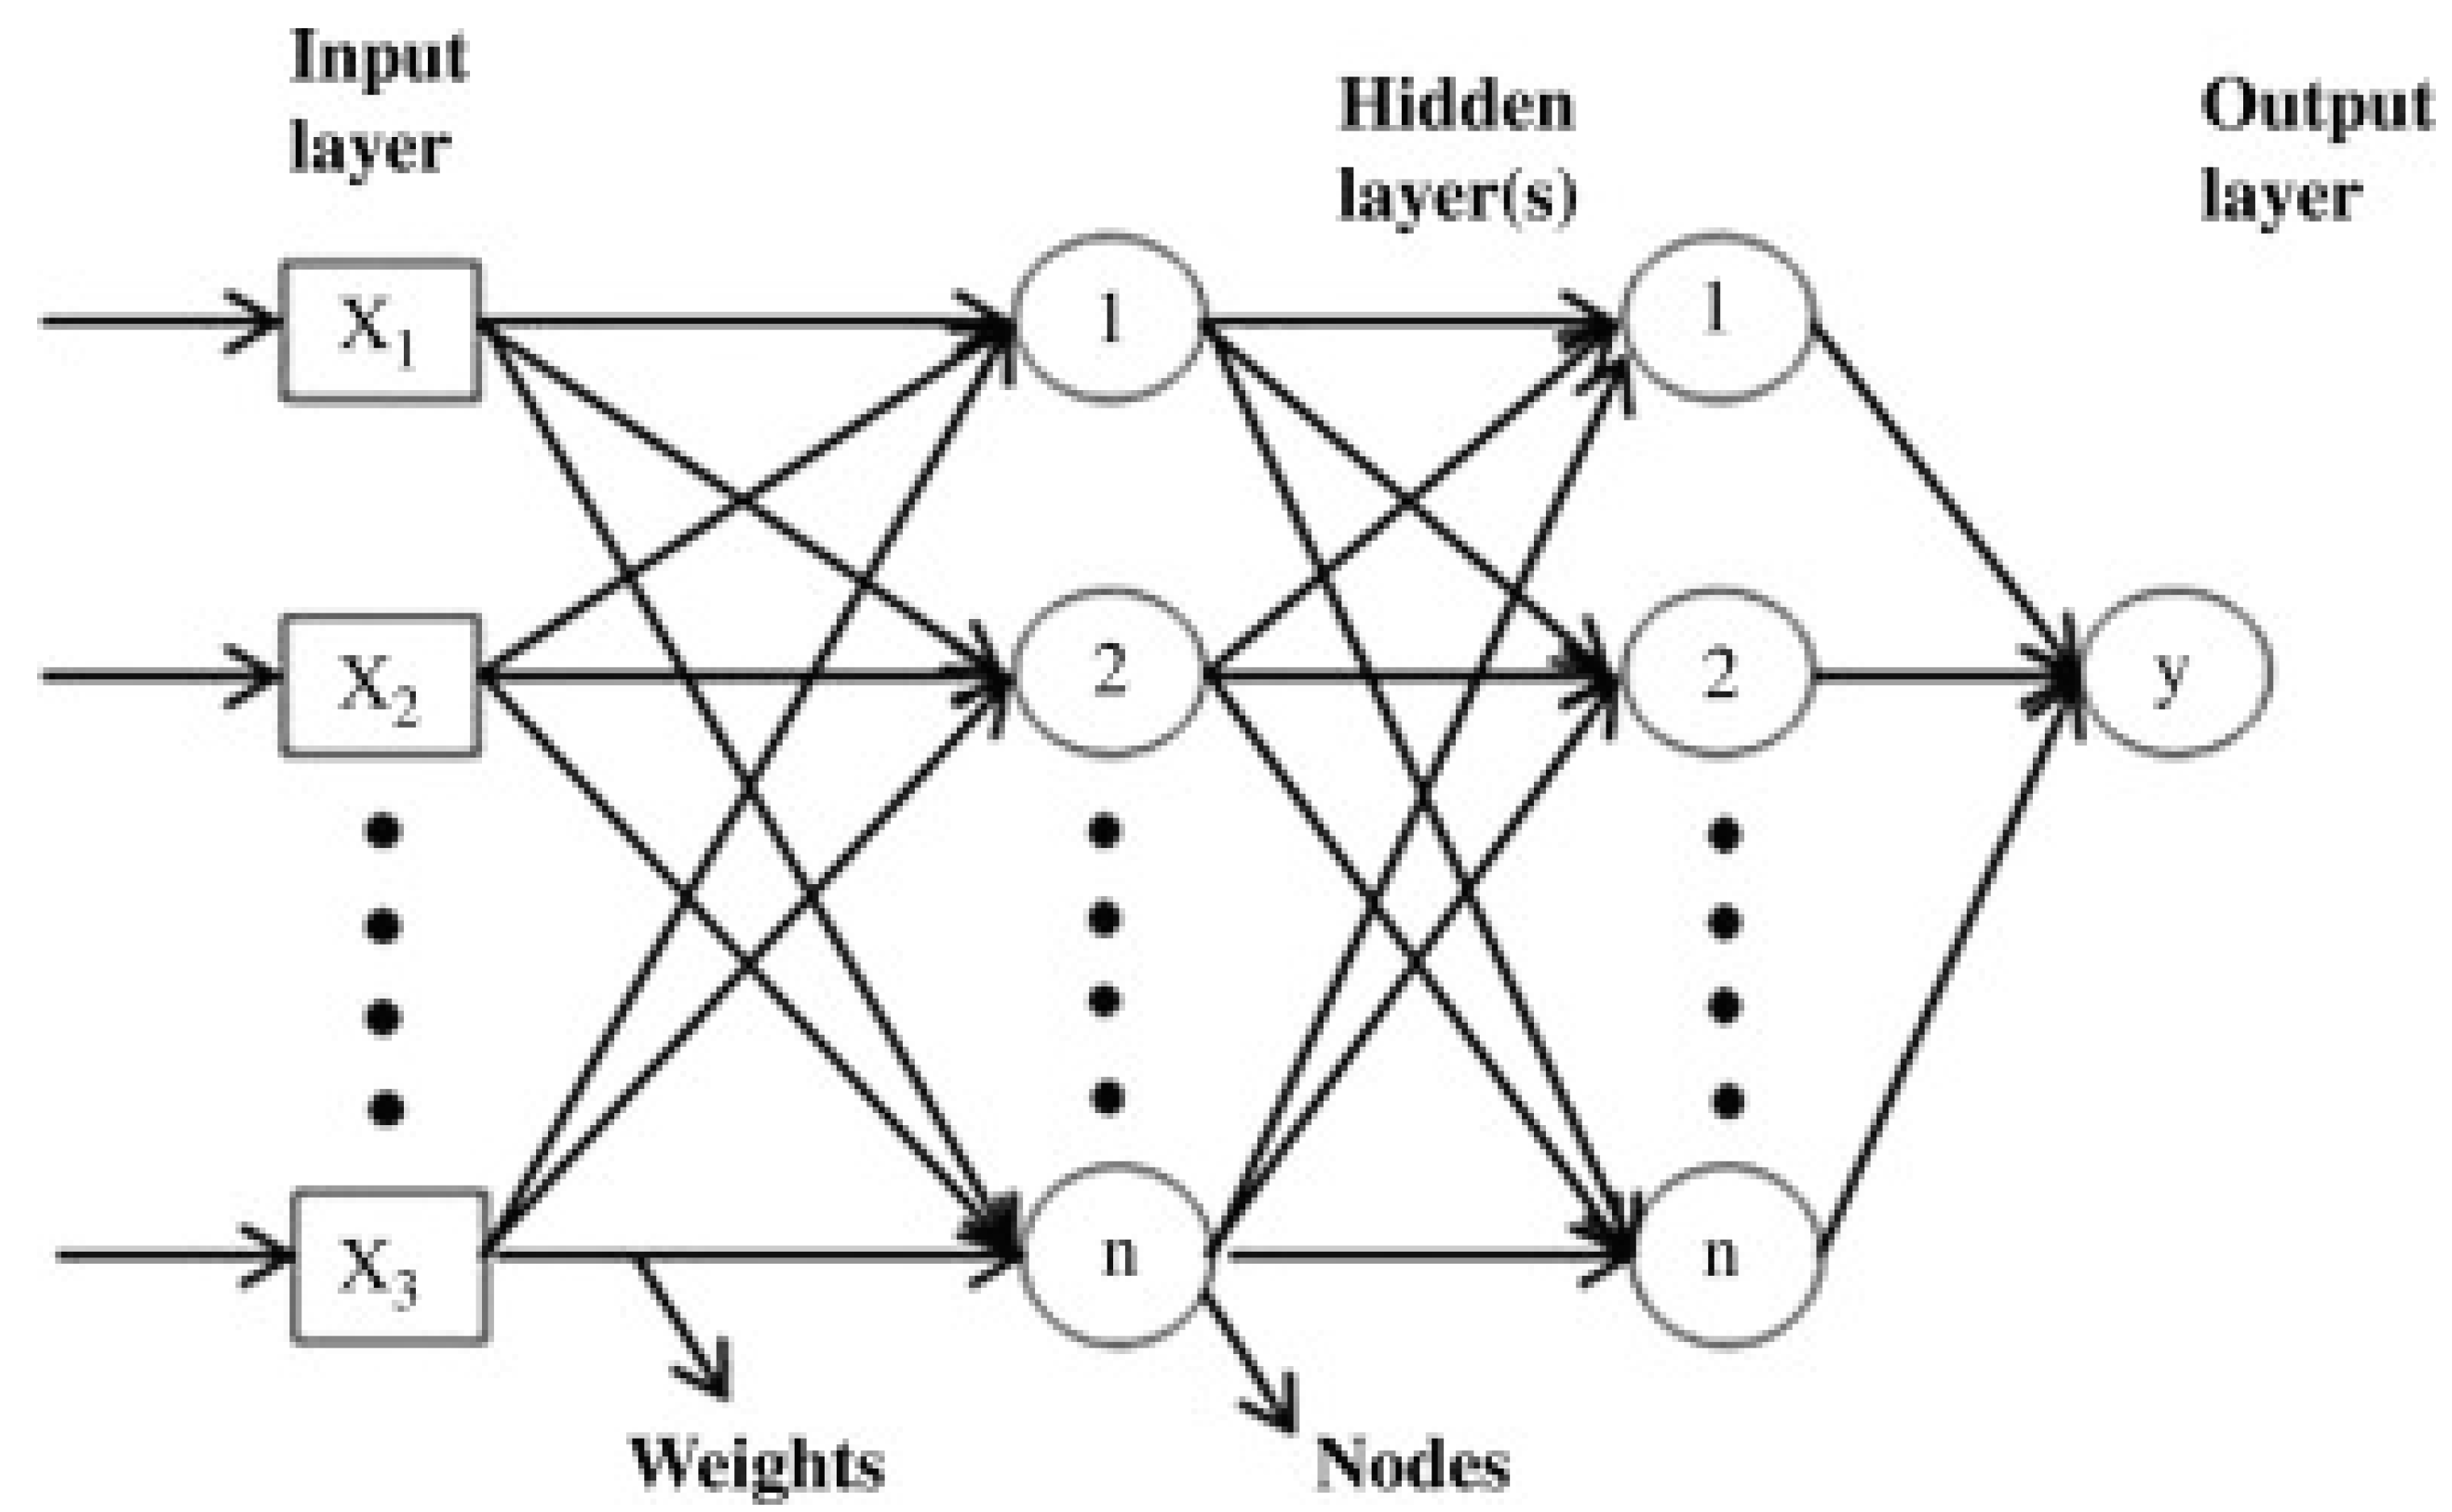
The neural network (NN) plays a vital part in the human brain, and ANN is an unsupervised learning technique created from biology. ANN stands for artificial neural networks, and biological neurons inspired it. It is a massively parallel computing system made up of many basic processors connected by a large number of interconnections. ANNs learn the basic rules from a series of given symbolic circumstances in instances rather than following a set of laws specified by human experts. They are organized into three layers (i.e., input layer, several hidden layers, and an output layer).
Furthermore, the relationships between the network processing units are the source of the ANNs’ analytical activity. ANNs are the most extensively used machine learning algorithms. Multilayer perceptrons (MLPs) with backpropagation learning are based on a supervised technique and have three layers: input, hidden, and output
[45][46]. Compared to other classic machine learning techniques, ANN models have significant advantages in dealing with random, fuzzy, and nonlinear data. ANNs are best suited for systems with a complicated, large-scale structure and ambiguous data. They are commonly employed for a wide range of issues
[47][48]. ANNs do, however, also have some drawbacks. As a hardware-dependent algorithm, ANN requires GPU for processing and to create them in the first place. ANN requires a large amount of training data to build the appropriate algorithm. When using the sigmoid activation function, ANN algorithms frequently encounter vanishing and expanding gradient difficulties and the challenge remains in finding the loss function. The algorithms of ANN are black boxes in nature, where results are based on the experience of training data and not a specified program, making it difficult for modification and explanation to business stakeholders. Despite the shortcomings of ANN, neural networks are gaining wide popularity in the mining industry and researchers are mostly moving towards the use of ANN in failure analysis and predictive maintenance. The sample neural network architecture is shown in
Figure 3.
Figure 3. Sample neural network architecture
[49].
ANN is widely used in reliability and fault analysis of mining machines. Several literature works can be found using ANN for analysis. ANN has been used in mining since the early 2000s. However, the ANN architecture was not as developed as it is today, and only feed-forward networks were used in the algorithm. Presently, ANN is used with higher accuracy and better results in predicting equipment failures and reliability. ANN is used for fault diagnostics of numerous types of rotating machinery that use signal processing techniques to extract features and further input these to the ANN model to classify faults
[50][51][52][53]. In
[54] the authors studied electric motor faults with ANN feedforward networks and self-organizing maps. Data was taken from stator current and mechanical vibration signals for major motor faults. The study showed the effectiveness of both algorithms and feedforward networks looked more promising for electric motor analysis. In
[55], the authors used multilayer perceptrons (MLP) in ANN to classify dragline faults using two years failure data. There were 16 causes in total that lead to dragline failure. Two different models for analysis of these faults, using seven causes, seven symptoms and five fault parameters of drag systems have been developed. The prediction accuracy of symptoms using the cause was 94.2% and that of fault using symptom was 97.1%. In
[48], the authors demonstrated on how neural networks can be used in vibration monitoring analysis of rolling element bearing and derived how it can be effective in handling noisy data. In
[56], presented a multi-state algorithm for dynamic condition monitoring of a gear. The algorithm information referred to the gear status and estimated the mesh stiffness per shaft revolution in case that any abnormality is detected. This network was fed with statistical parameters obtained from the wavelet coefficients derived for the most sensitive levels of decomposition to damage; the output resulted in the drop in the averaged torsional meshing stiffness when a failure appears, which is highly related to local failure. In
[47], the authors proposed a rotor vibration fault diagnosis approach, that transforms multiple vibration signals into symmetrized dot pattern (SDP) images, and then identifies the SDP graphical feature characteristic of different vibration states using a convolutional neural network (CNN). A CNN can reliably and accurately identify vibration faults by extracting the feature information of SDP images adaptively through deep learning. The proposed approach was tested experimentally using a rotor vibration test bed, and the results obtained were compared to those obtained with an equivalent CNN-based image recognition approach using orbit plot images. The rotor fault diagnosis precision was improved from 92% to 96.5%.
 +1 credit