Your browser does not fully support modern features. Please upgrade for a smoother experience.
Submitted Successfully!
 +1 credit
Thank you for your contribution! You can also upload a video entry or images related to this topic.
For video creation, please contact our Academic Video Service.
| Version | Summary | Created by | Modification | Content Size | Created at | Operation |
|---|---|---|---|---|---|---|
| 1 | CHONG TAK YAW | -- | 4243 | 2022-09-01 08:39:09 | | | |
| 2 | Sirius Huang | -2 word(s) | 4241 | 2022-09-02 02:53:36 | | |
Video Upload Options
We provide professional Academic Video Service to translate complex research into visually appealing presentations. Would you like to try it?
Cite
If you have any further questions, please contact Encyclopedia Editorial Office.
Balakrishnan, G.K.; Yaw, C.T.; Koh, S.P.; Abedin, T.; Raj, A.A.; Tiong, S.K.; Chen, C.P. Infrared Thermography for Condition-Based Monitoring in Electrical Energy. Encyclopedia. Available online: https://encyclopedia.pub/entry/26773 (accessed on 23 July 2026).
Balakrishnan GK, Yaw CT, Koh SP, Abedin T, Raj AA, Tiong SK, et al. Infrared Thermography for Condition-Based Monitoring in Electrical Energy. Encyclopedia. Available at: https://encyclopedia.pub/entry/26773. Accessed July 23, 2026.
Balakrishnan, Ganesh Kumar, Chong Tak Yaw, Siaw Paw Koh, Tarek Abedin, Avinash Ashwin Raj, Sieh Kiong Tiong, Chai Phing Chen. "Infrared Thermography for Condition-Based Monitoring in Electrical Energy" Encyclopedia, https://encyclopedia.pub/entry/26773 (accessed July 23, 2026).
Balakrishnan, G.K., Yaw, C.T., Koh, S.P., Abedin, T., Raj, A.A., Tiong, S.K., & Chen, C.P. (2022, September 01). Infrared Thermography for Condition-Based Monitoring in Electrical Energy. In Encyclopedia. https://encyclopedia.pub/entry/26773
Balakrishnan, Ganesh Kumar, et al. "Infrared Thermography for Condition-Based Monitoring in Electrical Energy." Encyclopedia. Web. 01 September, 2022.
Copy Citation
Condition-based monitoring (CBM) has emerged as a critical instrument for lowering the cost of unplanned operations while also improving the efficacy, execution, and dependability of tools. Thermal abnormalities can be thoroughly examined using thermography for condition monitoring.
condition-based monitoring
diagnosis
fault detection
infrared thermography
1. Theoretical on Thermography and Thermal Imaging
The cornerstone for IRT is the physical phenomenon that anybody with a temperature over absolute zero (−273.15 °C) emits electromagnetic radiation. The strength and spectrum composition of emitted radiation from a body is inextricably linked to its surface. Calculating the radiation intensity of an object may be used to determine its temperature in a non-contact method [1]. Figure 1 and Figure 2 demonstrate the electromagnetic spectrum and emissive power distribution as a function of wavelength, respectively.
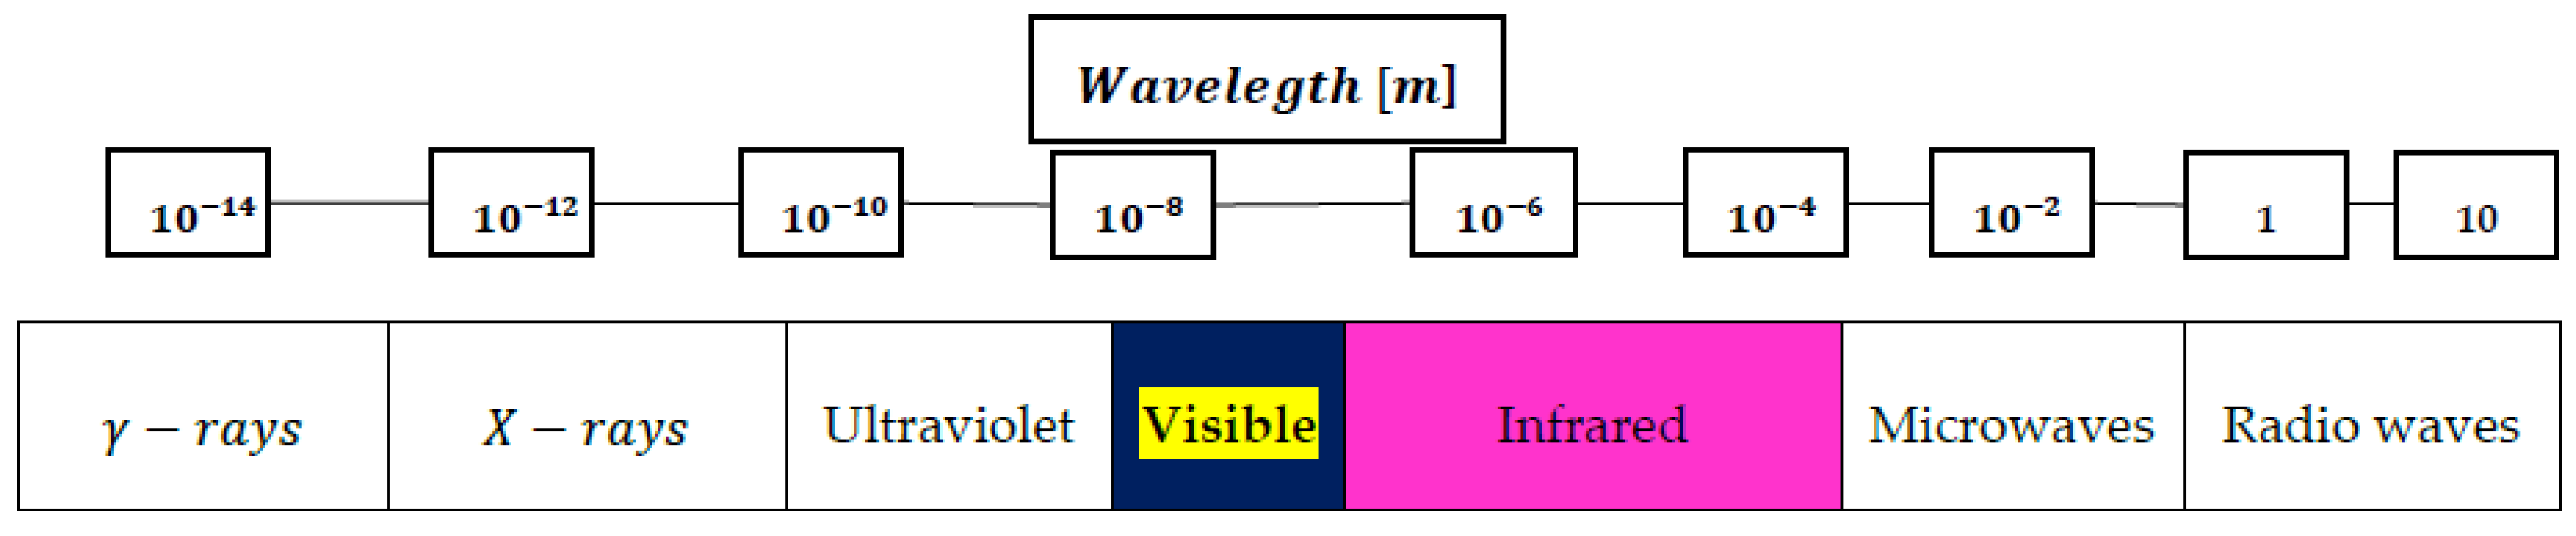
Figure 1. The electromagnetic spectrum [2].
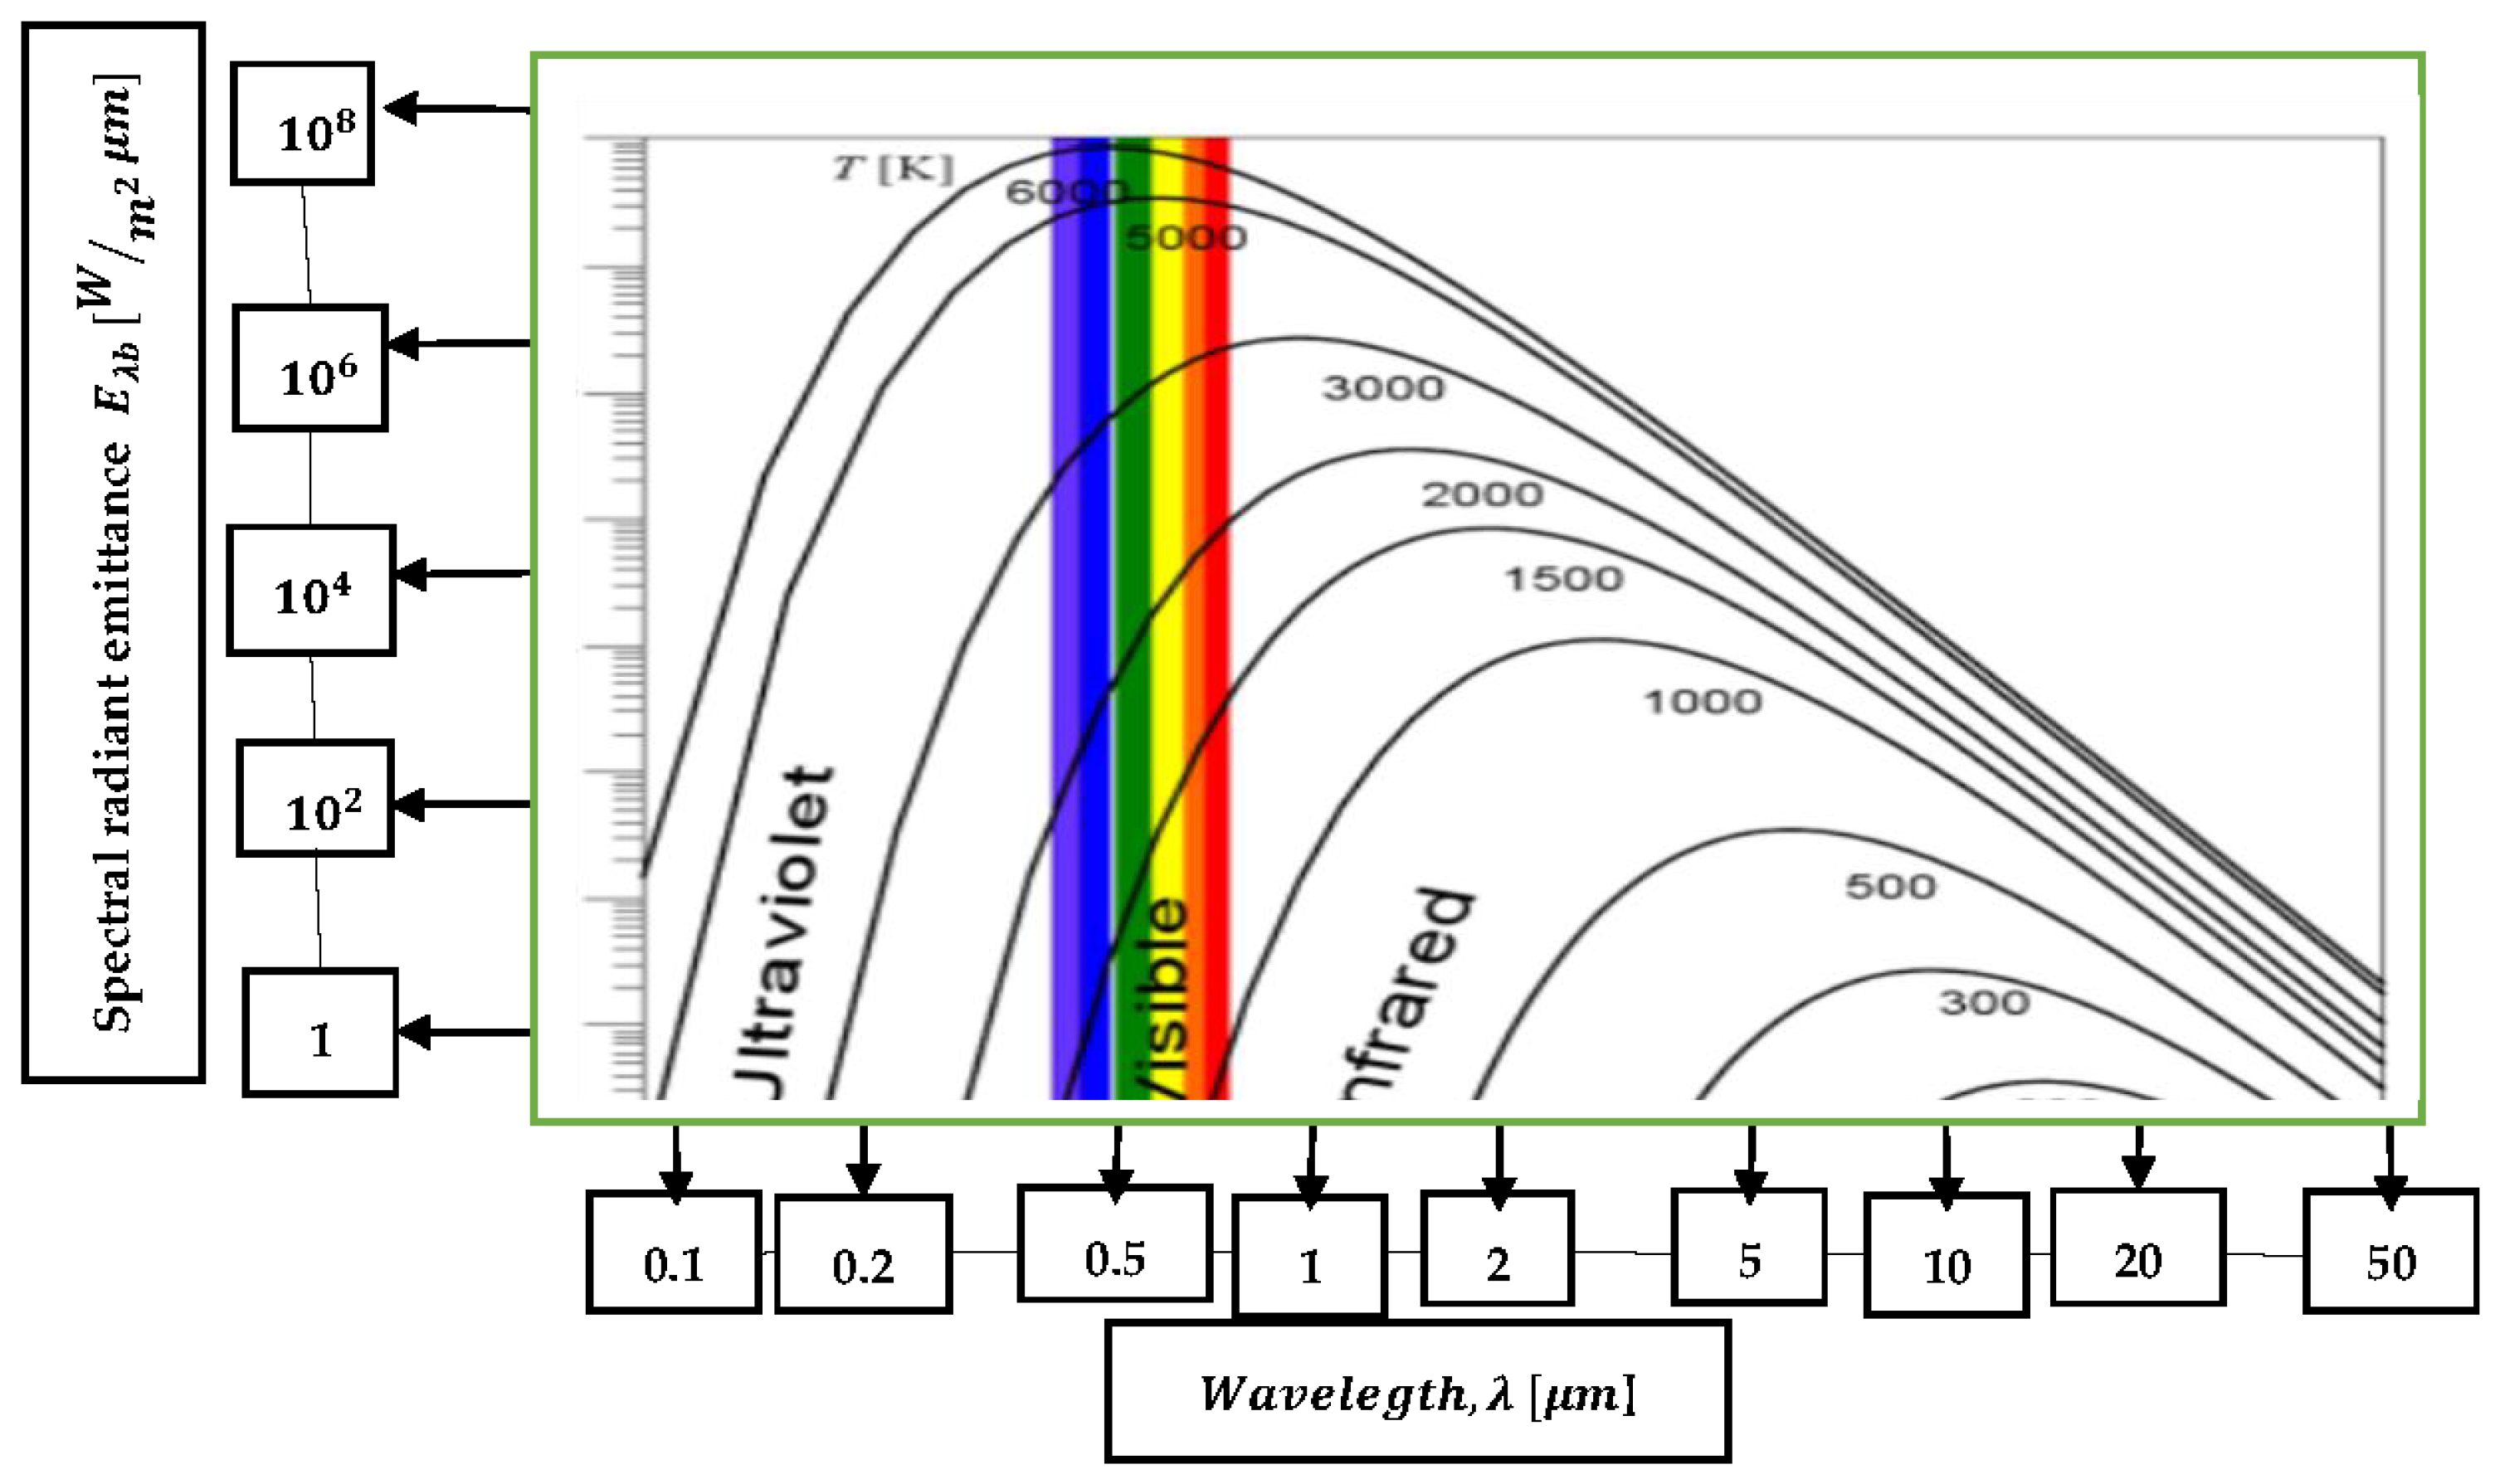
Figure 2. Distribution of emissive power with wavelength [3].
Amongst the most significant benefits of IRT-based condition monitoring is the minimal amount of equipment needed. The equipment includes a thermal camera, a tripod or camera platform, and video output devices to show the gathered infrared thermal pictures for such applications. Infrared cameras have progressed through three generations since their inception [4]. Zhang et al. [5] and Wan [6] go into considerable detail about the creation and basic concepts of various infrared sensors. The first cameras employed a single element sensor and two scanning mirrors to create pictures. They were apprehensive about the possibility of whiteout (i.e., saturation owing to high intensity). The second-generation cameras used two scanning mirrors, a significant linear array or a tiny 2-D array as detectors, and a time delay integration system for picture improvement. The lack of mirrors in third-generation cameras and the use of large focal plane array (FPA) sensors and on-chip image processing leads to higher system dependability and sensitivity [4]. The two kinds of thermal detectors are cooled and uncooled. Modern solid-state advancements have cleared the road for developing novel sensors that are more precise and have better resolutions. Uncooled cameras have a thermal sensitivity of about 0.05 degrees Celsius (°C), while cooled cameras have a thermal sensitivity of 0.01 °C [7]. These cameras provide excellent spatial and temperature solutions, compactness, and mobility to mention a few benefits. Furthermore, these cameras are lighter, use silicon wafer technology, and are less costly than cooled infrared cameras [8][9]. As a result, current IRT technology will aid electrical utilities for CBM analysis since all advancements will provide accurate data analysis using recent AI algorithms in computer vision.
A standard experimental setup for IRT-based condition monitoring research can be seen in Figure 3. The produced thermal pictures are exhibited on a computer, enabling the specific temperature of the object to be calculated without touching it. The obtained thermal pictures are often pseudo-color-coded, making interpretation more straightforward and faster. The source snapshot and a typical infrared thermal picture of a structural element are shown in [7].
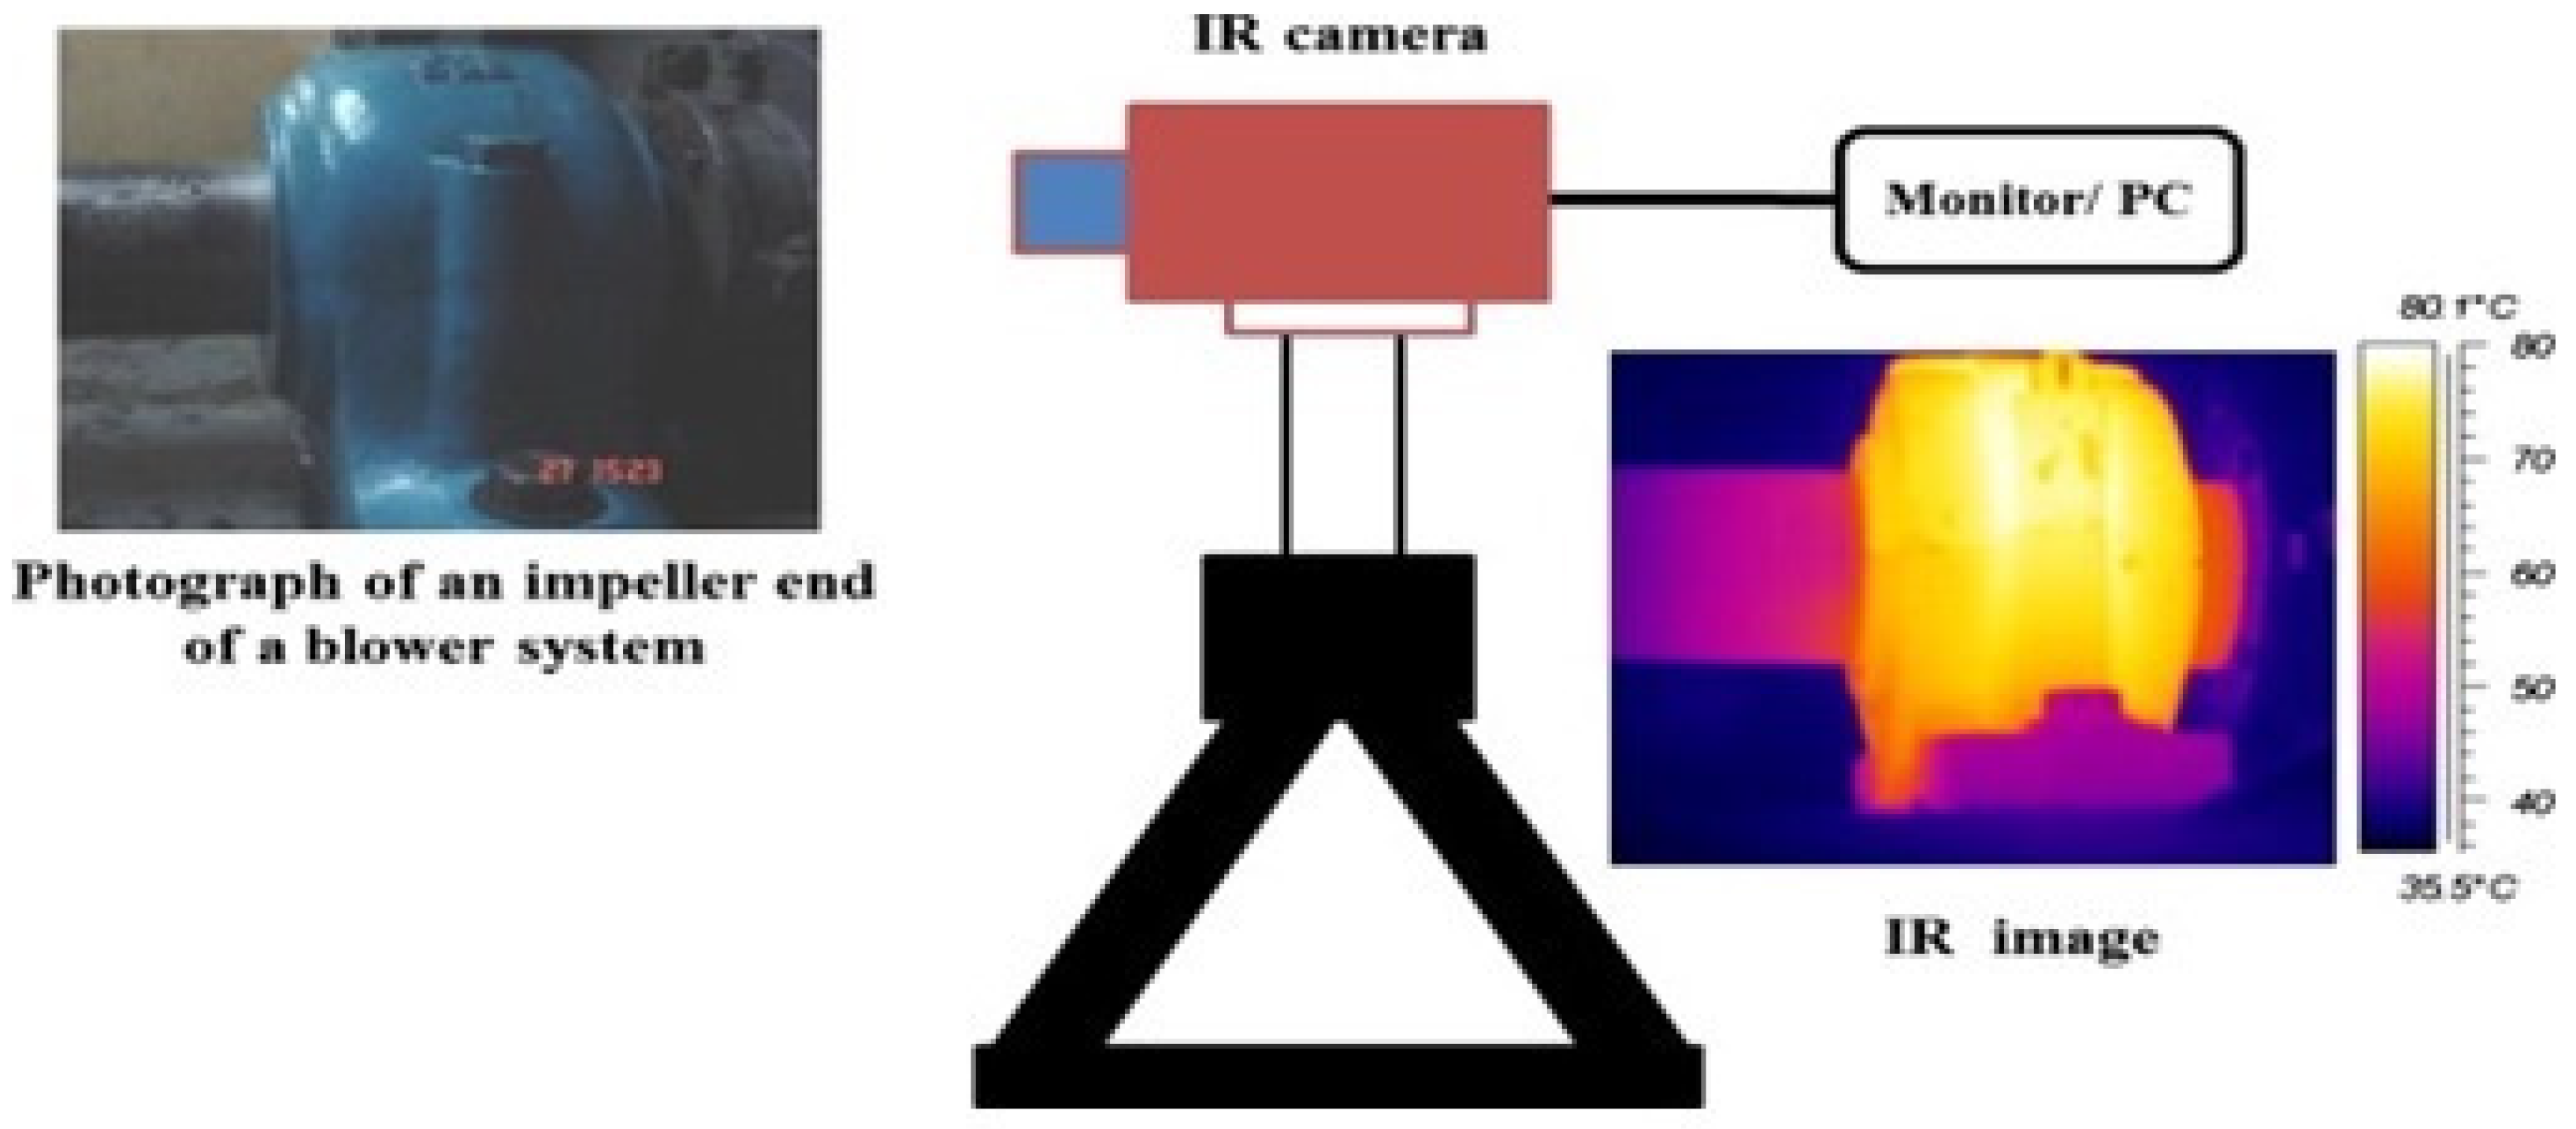
Figure 3. Schematic of a typical experimental setup for IRT.
Before selecting an infrared camera, many factors must be examined since the ability to create a clear and accurate thermal picture is highly dependent on these performance criteria [10]. A few key factors are covered further down.
1.1. Spectral Range
The spectral range is the region of the infrared spectrum where the infrared camera will work. The thermal radiation that an item generates gets more concentrated in shorter wavelength bands as its temperature increases. For observing objects at ambient temperature, a long-wavelength band (7.5–14 μm) is preferable. This is due to two factors: first, bodies at room temperature emit mainly at these wavelengths; second, measurements taken at some of these wavelength ranges are unaffected by solar radiation (accurate for outdoor measurements) since solar radiation is primarily in the relatively short wavelength bands. The use of short wave (2–5 m) technology is recommended [11].
1.2. Spatial Resolution
Temperature resolution refers to the minor temperature fluctuation seen by the infrared camera in view. Object temperature, ambient room temperature, object to camera distance, filters, and other experimental factors all affect temperature resolution. Noise equivalent temperature difference (NETD), minimal resolvable temperature difference (MRTD), and minimum detectable temperature difference (MDTD) are the most often utilized temperature resolution criteria. NETD readings for Stirling cycle cooled cameras at room temperature are usually smaller than 0.025 Kelvin (K) [7].
1.3. Spatial Resolution Laser Pointer and Interchangeable Lens
To see where the camera’s lens is aimed and prevent coming into close contact with hot regions, laser pointers may be utilized. You may change lenses based on your requirements using interchangeable lenses. Flexibility with external equipment and measuring equipment, as well as speedy data transfer through cable, Wi-Fi, and Bluetooth, and the inclusion of text and voice feedback, are all benefits [12]. The thermal camera has become a more helpful instrument.
1.4. Temperature Range
The temperature range specifies the temperature values that an infrared camera can detect at the highest and lowest levels. Temperatures typically range from 20 degrees Celsius (°C) to 500 °C. Different filters may be used to extend the content up to 1700 °C [7].
1.5. Frame Rate
The number of frames acquired every second by an infrared camera is the frame rate. Higher frame rate cameras are often preferred for monitoring motion information or dynamic events like the propagation of heat fronts. The standard frame rate is 50 Hertz (Hz) [7].
1.6. Accuracy
The precision with which the thermal camera measures the temperature is reflected in its accuracy. The advanced thermal camera is accurate to within 1 percent (%) [13].
2. IRT Applications in Condition Monitoring for Electrical Energy
Component failure is mainly caused by excessive heat and resistance. Figure 4 shows how infrared cameras monitor this heat, which may be employed in several applications. An infrared camera detects the IR energy of an object, converts it to temperature, and displays the temperature distribution for structural health monitoring and non-destructive examination [14]. Thermography is a valuable diagnostic technique in the electrical sector that is crucial to assessing problems across various assets such as switchboards, transformers, cables, and other electrical components with electrical defects and high resistance connections. Non-contact temperature monitoring systems have grown in popularity as online condition monitoring technology has become an unavoidable aspect of today’s maintenance plan. As online condition monitoring technology has become an inevitable part of maintenance strategies in today’s scenario, with loss of insulation materials (e.g., refractory) in high or low-temperature process equipment, damage to rotating equipment, electrical and cooling issues that are not visible to the naked eye, non-contact type monitoring strategies have become more popular. Non-contact temperature monitoring systems have grown in popularity as online condition monitoring technology has become an unavoidable aspect of today’s maintenance plan. Infrared thermography [15] is a non-contact method of obtaining a precise, reproducible surface temperature profile. The applications for which infrared thermography may be used are shown in Figure 5.
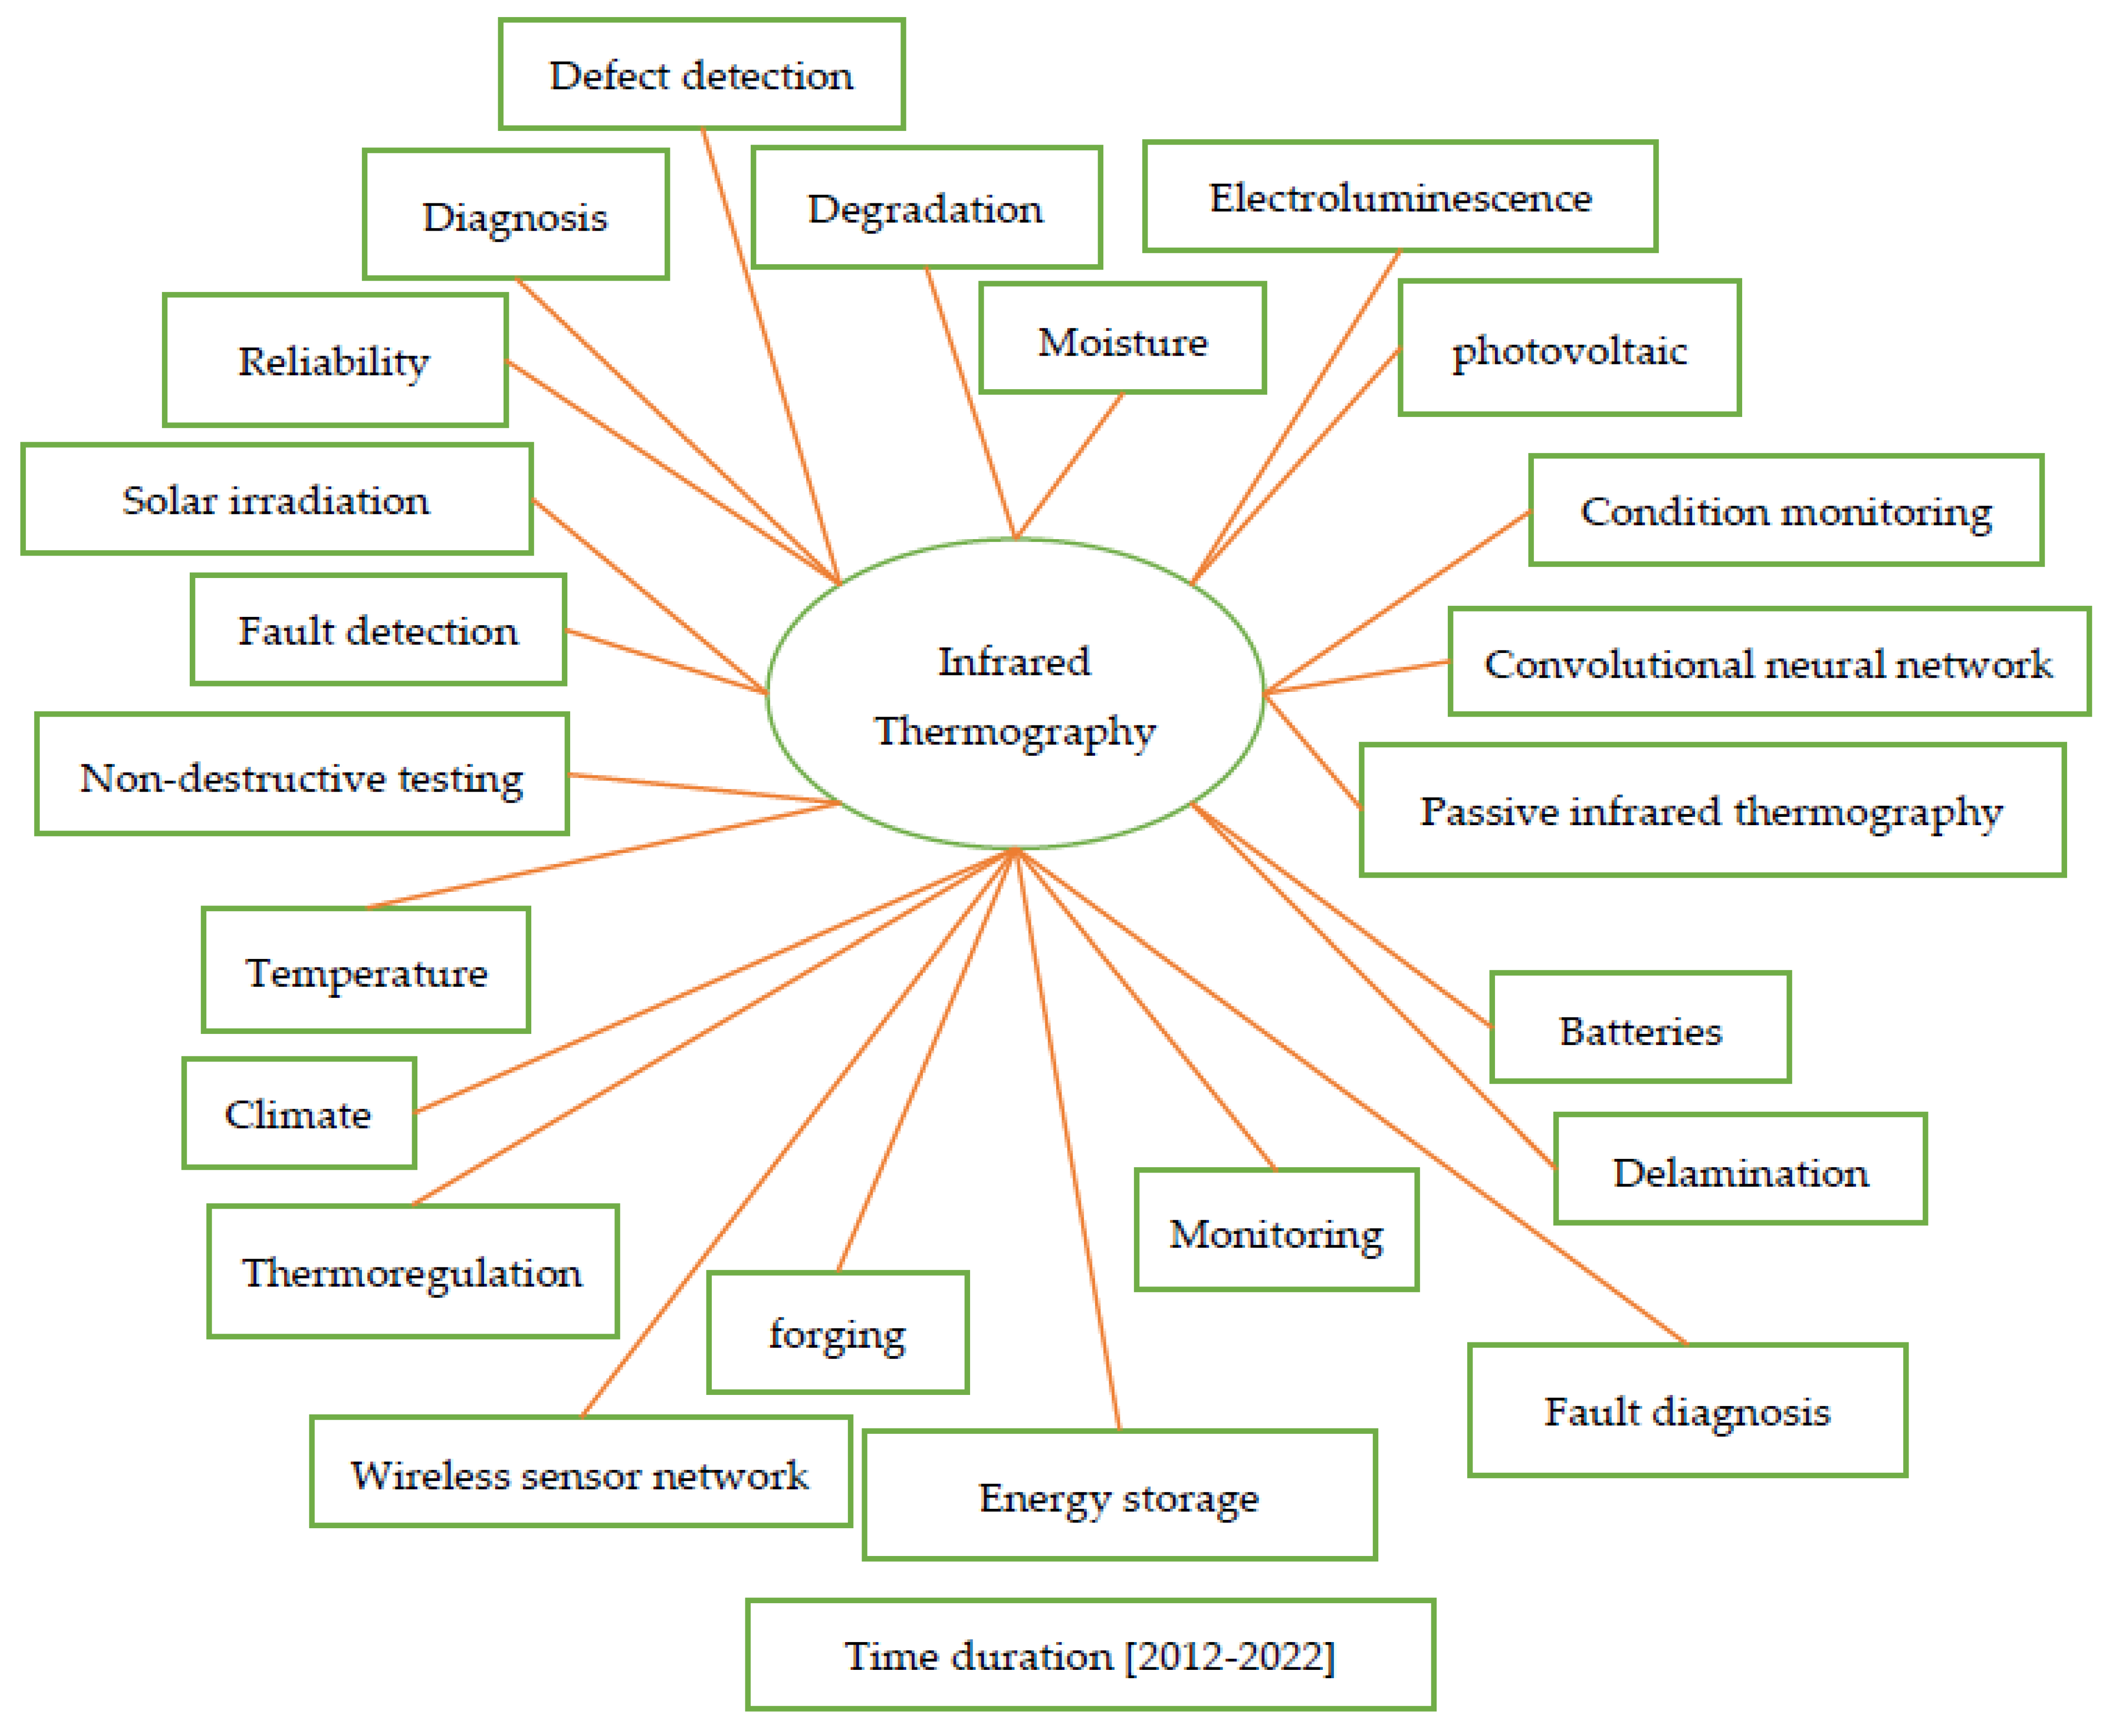
Figure 4. Keyword co-occurrence map in the context of IRT [16].
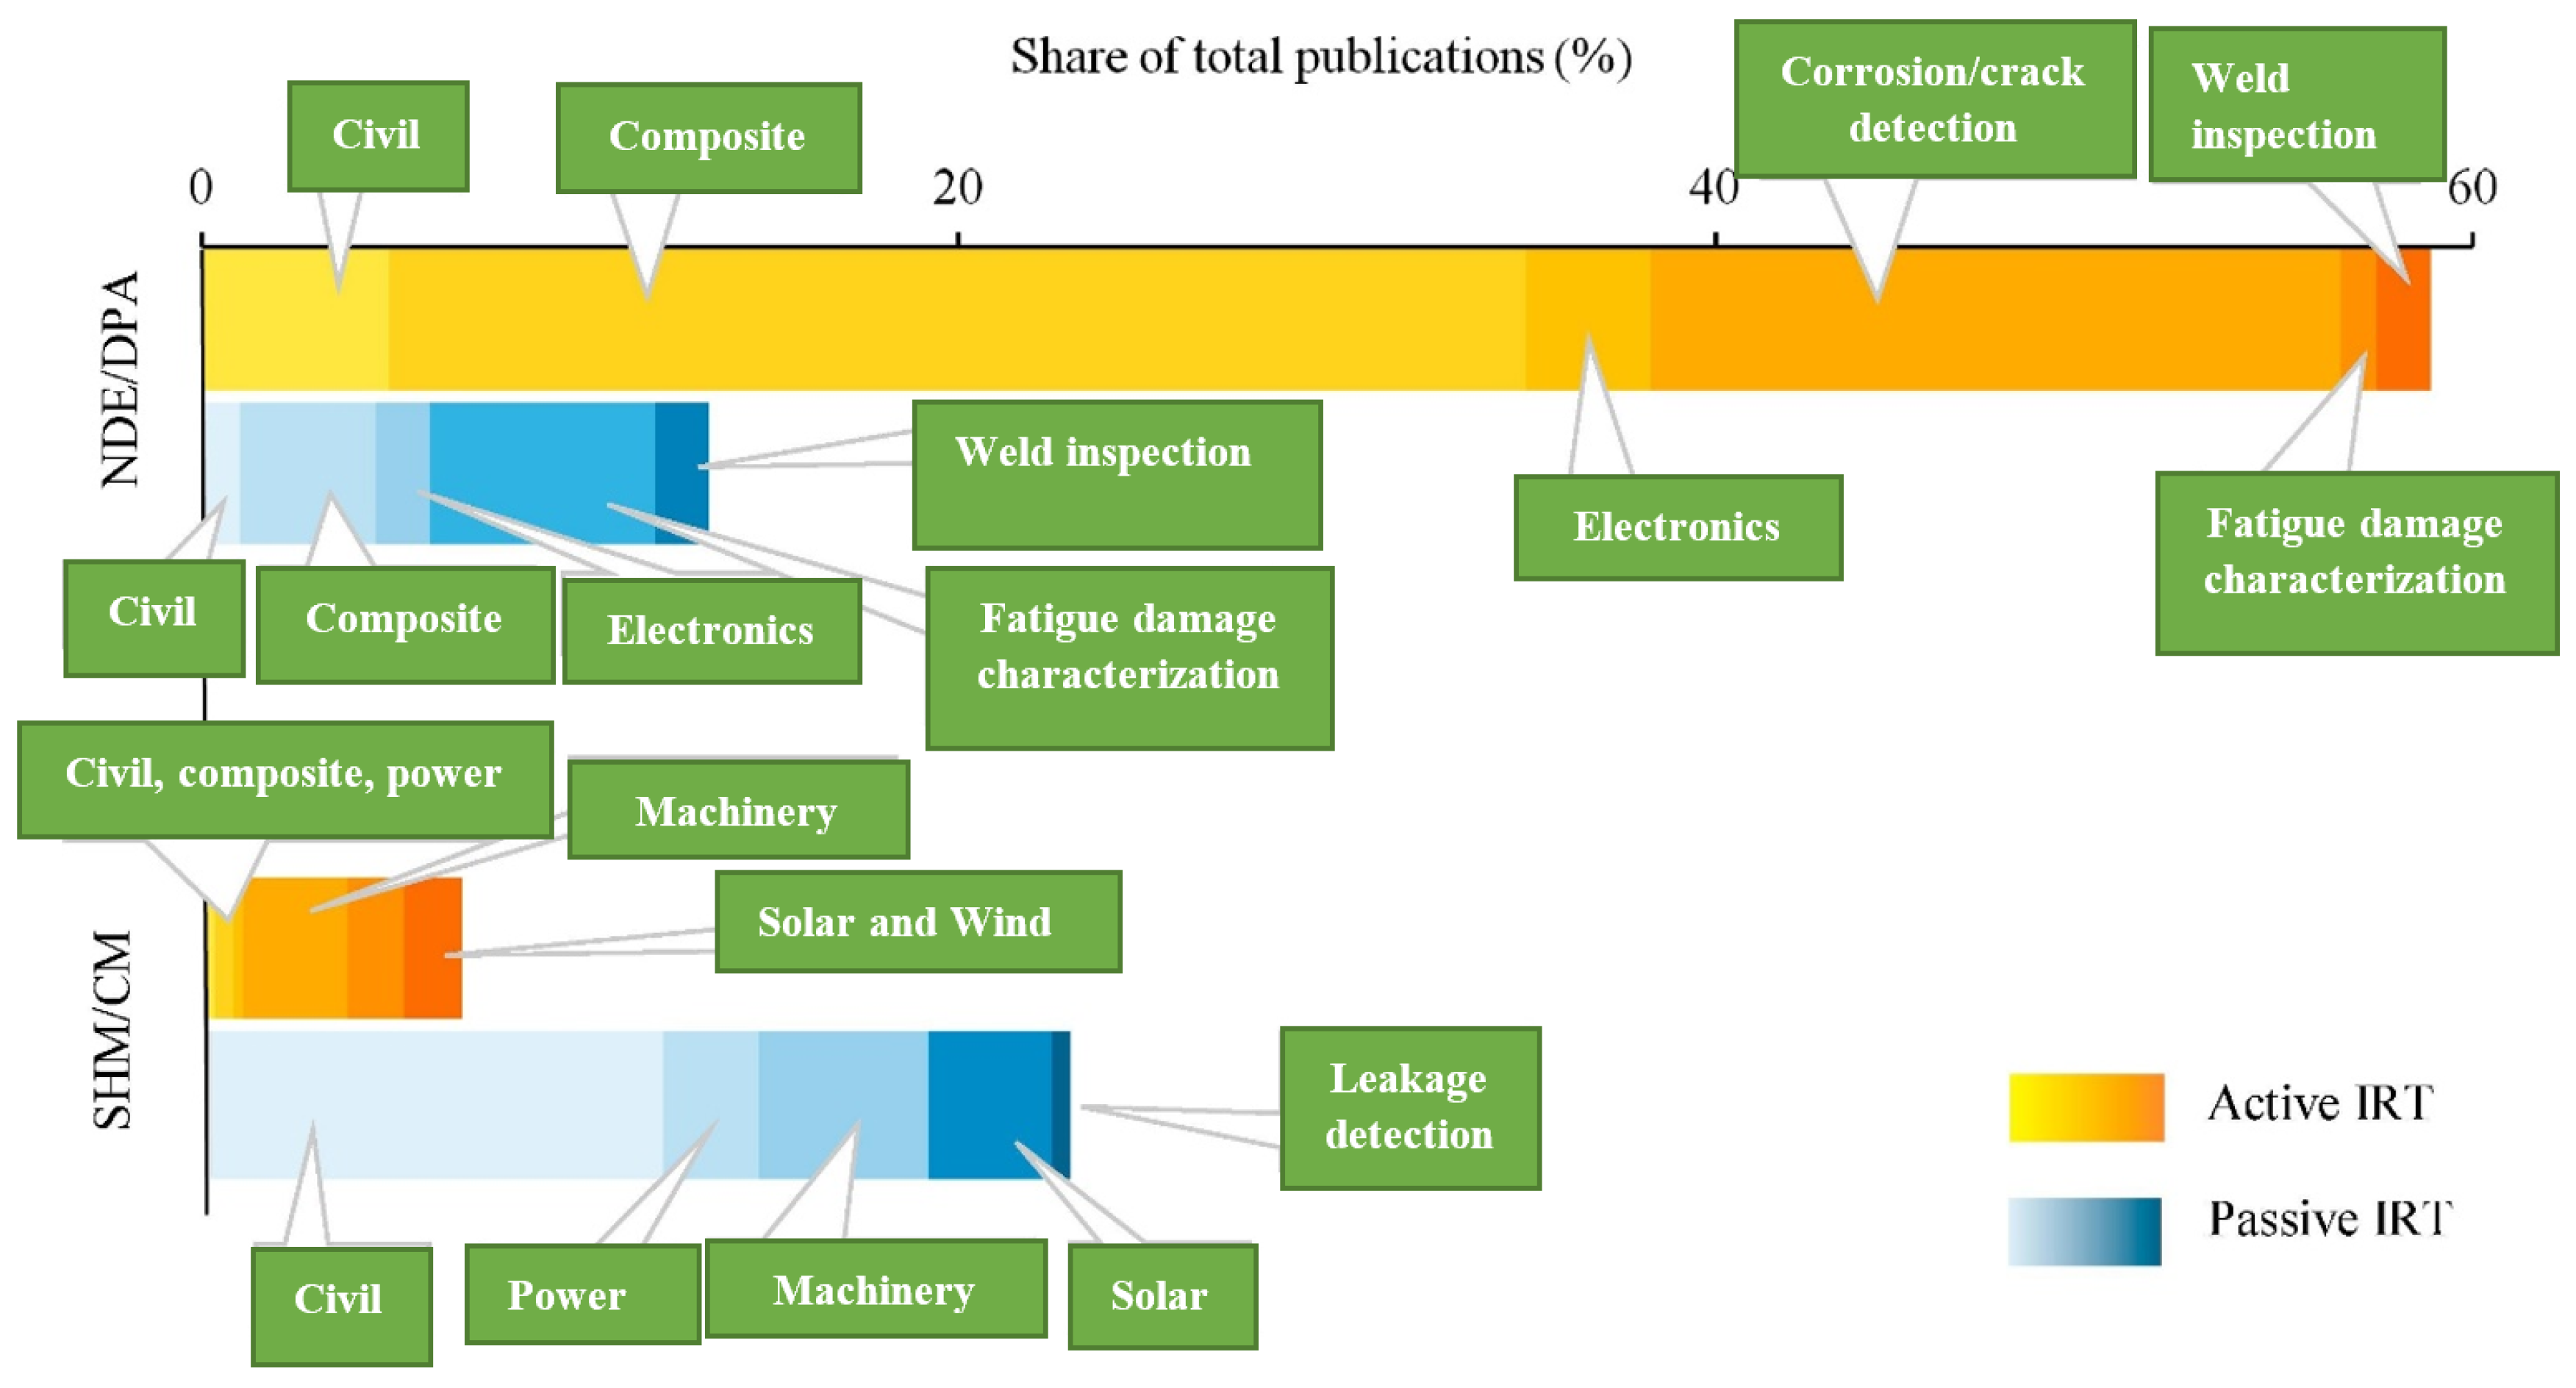
Figure 5. Different methods and applications of IRT [17]. (SHM: Structural Health Monitoring, CM: Condition Monitoring. NDE: Non-Destructive Examination, DPA: Destructive Physical Analysis.)
2.1. Results in the Electrical and Electronics Applications
According to numerous assessments, IRT thermography is widely employed in the electrical and electronics engineering field [11][18][19]. Many of the applications in this field are connected to industry, but they also include tertiary sectors, transportation, and power plants, to name a few. The maintenance of electrical systems is an essential application of IRT. Experts have used the IRT camera for years to inspect panel boards, bus bars, electric cables, and other critical elements of these installations like transformers, power meters, or capacitor banks for reactive power compensation [18][20][21][22][23][24][25][26], where experts use the IRT camera to observe the correct operation of the equipment based on established limits. For electrical and electronic applications in condition monitoring, Bellow identified numerous criteria, examples, and methodologies.
2.2. Hotspot Detection
The easiest approach to find the hotspot inside the IRT picture is to use segmentation. The authors of [27] compare many picture segmentation approaches and discuss their advantages and disadvantages. Because of its straightforward implementation, the thresholding approach has become a popular picture segmentation technique. The grey-level histogram separates the target object from the background at a defined threshold. The automatic threshold technique of the T. Otsu method is widely used in many applications. Capacitors, transformers, and other electronic components have been utilized to identify flaws using the Infrared Thermal Anomaly Detection Algorithm (ITADA). ITADA is based on Otsu’s statistical threshold selection technique and detects flaws in capacitors, transformers, and other electronic components using grey-level histograms. Support vector machines (SVMs), used to segment color images, have a promising future. In [28], it is shown how to segment stochastic photos using random walker segmentation based on partial differential equations (PDE). Additionally, ref. [29] describes the use of thermographic image processing to identify faults in lightning arresters. To perform fault categorization, it utilized a collection of neuro-fuzzy networks. The neuron-fuzzy classifier is used to detect faults. It is also possible to use edge-based segmentation algorithms such as the Robert, Sobel, Prewitt, and Canny operators [30]. This approach identifies the moment when grey level intensity levels abruptly shift. Color picture segmentation may be done using spectrum analysis. However, previous information about the object’s hues is difficult to come by. The topic of picture segmentation has seen a lot of research [28][30][31][32][33][34]. However, only a handful have been examined in terms of employing thermal image processing to monitor electrical equipment state [29][35][36][37][38][39][40][41]. Consequently, in the context of electrical equipment condition monitoring, this work focuses on picture segmentation methods for thermographic pictures obtained by IR cameras. The condition of the spinning gear is monitored using various signal processing techniques [42][43], e.g., the implementation of an unsupervised online detection using artificial neural networks (ANNs) has been described in [44]. Yazici et al. [45] have reported an adaptive, statistical time-frequency method for the detection of bearing faults. In [46], a fuzzy fault detector using Concordia patterns was used to detect stator unbalance and open-circuit faults. Broken bar faults can also be detected by time- and frequency-domain analysis of induced voltages in search coils placed internally around stator tooth tip and yoke and externally on the motor frame. Stator fault detection using external signal injection is discussed in [47]. Power transformers’ fault detection methods and techniques are also discussed in several articles, e.g., frequency-response analysis (FRA) addressed in [43] is a powerful diagnostic method in detecting winding deformation, core, and clamping structure for power transformers, the multiple linear regression model is proposed in [48], for the early detection of transformers with accelerated oil aging, the vibroacoustic method (first noticed in aviation technology) will be applicable, transformers with a rated power of several tens of MVA [49], and a numerical procedure has been developed using the wavelet transform for processing and analysis of vibration signatures produced by the operation of tap changers [50][51]. In certain circumstances, non-contact thermographic image measurement may be beneficial. As a result, the current project tries to address these issues. The majority of scholars in this field [28][29][31][37][40][52] have used grayscale for processing. It has been discovered that the Sobel operator performs better for thermal pictures based on several image criteria. Following that, the Otsu approach is used on the identical photos, yielding good results. Figure 6 depicts hot zone identification using grayscale pictures and image processing techniques: (a) RGB image, (b) grayscale image, (c) Prewitt, (d) Roberts, (e) Sobel, (f) Otsu. On the other hand, the offered approaches locate the interest area without classifying the intensity of the equipment’s condition, necessitating human determination of crucial parameters, most notably the method’s threshold value.
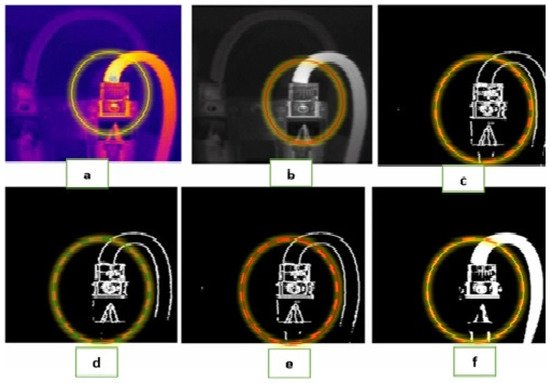
Figure 6. Identification of a hotspot area picture in grayscale: (a) RGB image, (b) grayscale image, (c) using Prewitt, (d) using Roberts, (e) using Sobel, (f) using Otsu [53].
2.3. Improving Inspection Techniques
The quality of measurements has increased as new advances in current IRT equipment have been made. Surface temperature variations of less than 0.1 °C may be resolved by most contemporary IR imagers [54][55]. Despite the advantages of modern IRT camera designs coupled with powerful image processing and display systems, there are still various considerations to consider while performing an inspection, even if temperatures can be reliably detected. This is crucial particularly for outside assessments conducted in substations, underground, and aerial distribution [56]. Procedural, technical, and environmental/ambient variables are the main elements that influence the accuracy of IRT measurements [54][57]. If certified or competent personnel are used, it may reduce the procedural component. The essential technical features are the emissivity of the equipment under examination, load current variation, the distance of the item under inspection, and IRT camera characteristics [54][57][58]. Results may be misconstrued or inaccurate if all these aspects are ignored. Table 1 highlights all the environmental consequences that must be considered when doing an IRT examination [54][57][58][59][60]. Before beginning, any IRT examination should complete preliminary research. In this case, most thermographers will need some data from the target site. It is sometimes required to investigate the history of the target place and the electrical power equipment. To acquire the most essential and most precise measurement, you need to use a suitable and appropriate tool. IRT devices’ long-wave (usually 8–14 m) sensing is ideal for prolonged outside inspections, particularly during bright seasons. This is because thermal detectors in this wave range are more sensitive to ambient temperature objects and have robust smoke transmission [59][61]. Table 1 and Table 2 outline all of the criteria for the inspection tools and the target equipment, respectively.
Table 1. Consideration of environmental factors during the inspection.
| The Aspect of the Environment | The Impact on the IRT Measurement |
|---|---|
| Ambient air temperature | When the ambient temperature rises, so does the temperature of the machinery. The IR system becomes less reliable at very hot or shallow temperatures. According to the temperature increase of 0–9, 10–20, 21–49, and >50 °C, the authors classified the severity of the flaw-induced overheating into four types: attention, moderate, severe, and critical [18]. |
| Precipitation/humidity (snow, rain, fog, etc.) | The temperature may drop drastically, causing the data to be misinterpreted. The only moderately heated equipment may be cooled below the abnormal temperature. |
| Wind or other convection | Wind velocities may drastically cool a high resistance fitting from speeds as minimal as 1–5 miles per hour (mph). The temperature differential between the equipment and the ambient space may be decreased to a few degrees above the ambient space at speeds greater than 5 mph. |
| Sun or solar radiation | Minor temperature swings will be hidden by the device’s sun heating, mainly if it absorbs much solar light (such as old conductors). |
Table 2. The characteristics of factors related to the target equipment and the inspection tool.
| Tools and Equipment | Characteristic |
|---|---|
| Electrical Loads | The proper load on the wires must be negotiated with the customer before the inspection.
|
| Equipment Emissivity | The emissivity of most conductors is between 0.1 and 0.3. While emissivity values as high as 0.97 may be found in greasy, dark, hot, and aging conductors, visual evaluation in the field from a distance is frequently difficult [54][58]. Moreover, there are several non-contact and nondestructive inspection tools that have already been introduced such as the Laser Ultrasound Inspection system, Study of Flip Chip Solder Joint Cracks [62], Laser-SQUID Microscopy, monitoring and Analysis of Large Scale Integration (LSI) -Chip-Defects [63], laser line photoluminescence imaging for outdoor inspections [64][65], Ultrasonic Suspension for force measurement [66], and laser ultrasonic signals from particles suspensions [67]. |
| Thermal Gradient | High-resistance heat is typically generated at the surface on the inside. Thermal gradients exist between the apparatus’s hottest point and the surface under investigation [60]. |
| IRT Device (camera) | The observed waveband and the spatial and measurement resolution are all elements to consider [60]. It is also essential to consider the sensitivity and signal processing speed [54]. |
| Distance andAngle | As the distance between them widens, the IRT picture’s resolution drops. An acute angle image has less information than one shot at a straight angle. |
2.4. Methods of Measurement and Analysis
Electrical equipment’s thermal condition may be measured in two ways. The first is known as quantitative, and it involves taking the equipment’s precise temperature. The second form is qualitative, which measures a hotspot’s relative temperature to other equipment areas under comparable circumstances. Electrical components’ evaluation often employs qualitative analysis [68][69]. IRT inspection is governed by the International Electrical Testing Association (NETA), the American Society for Testing and Materials (ASTM)—E 1934, and the National Fire Protection Association (NFPA)—NFPA 70-B. The application of methods allows for a quick, reliable, and comprehensive assessment of the severity of observed issues. The NETA standard is often used in the testing process for electronic components, employing the delta T criterion as indicated in Table 3 to establish the degree of severity. Temperature increases over a predefined reference, such as ambient air temperature, a comparable component under similar circumstances, or the maximum allowable temperature, determine these delta Ts. Rather than using current standards, some thermographers create their testing specification tables from their own experiences. The severity level rating is often based on the highest temperatures for both qualitative and quantitative data. As shown in Figure 7a, the maximum temperature values may be estimated using any commercial infrared image analysis tool by choosing an area or specifying a spot on the components or equipment. As shown in Figure 7b, a single line temperature profile can depict the temperature changes throughout all stages. In general, automated area of interest selection may improve the human selection process.
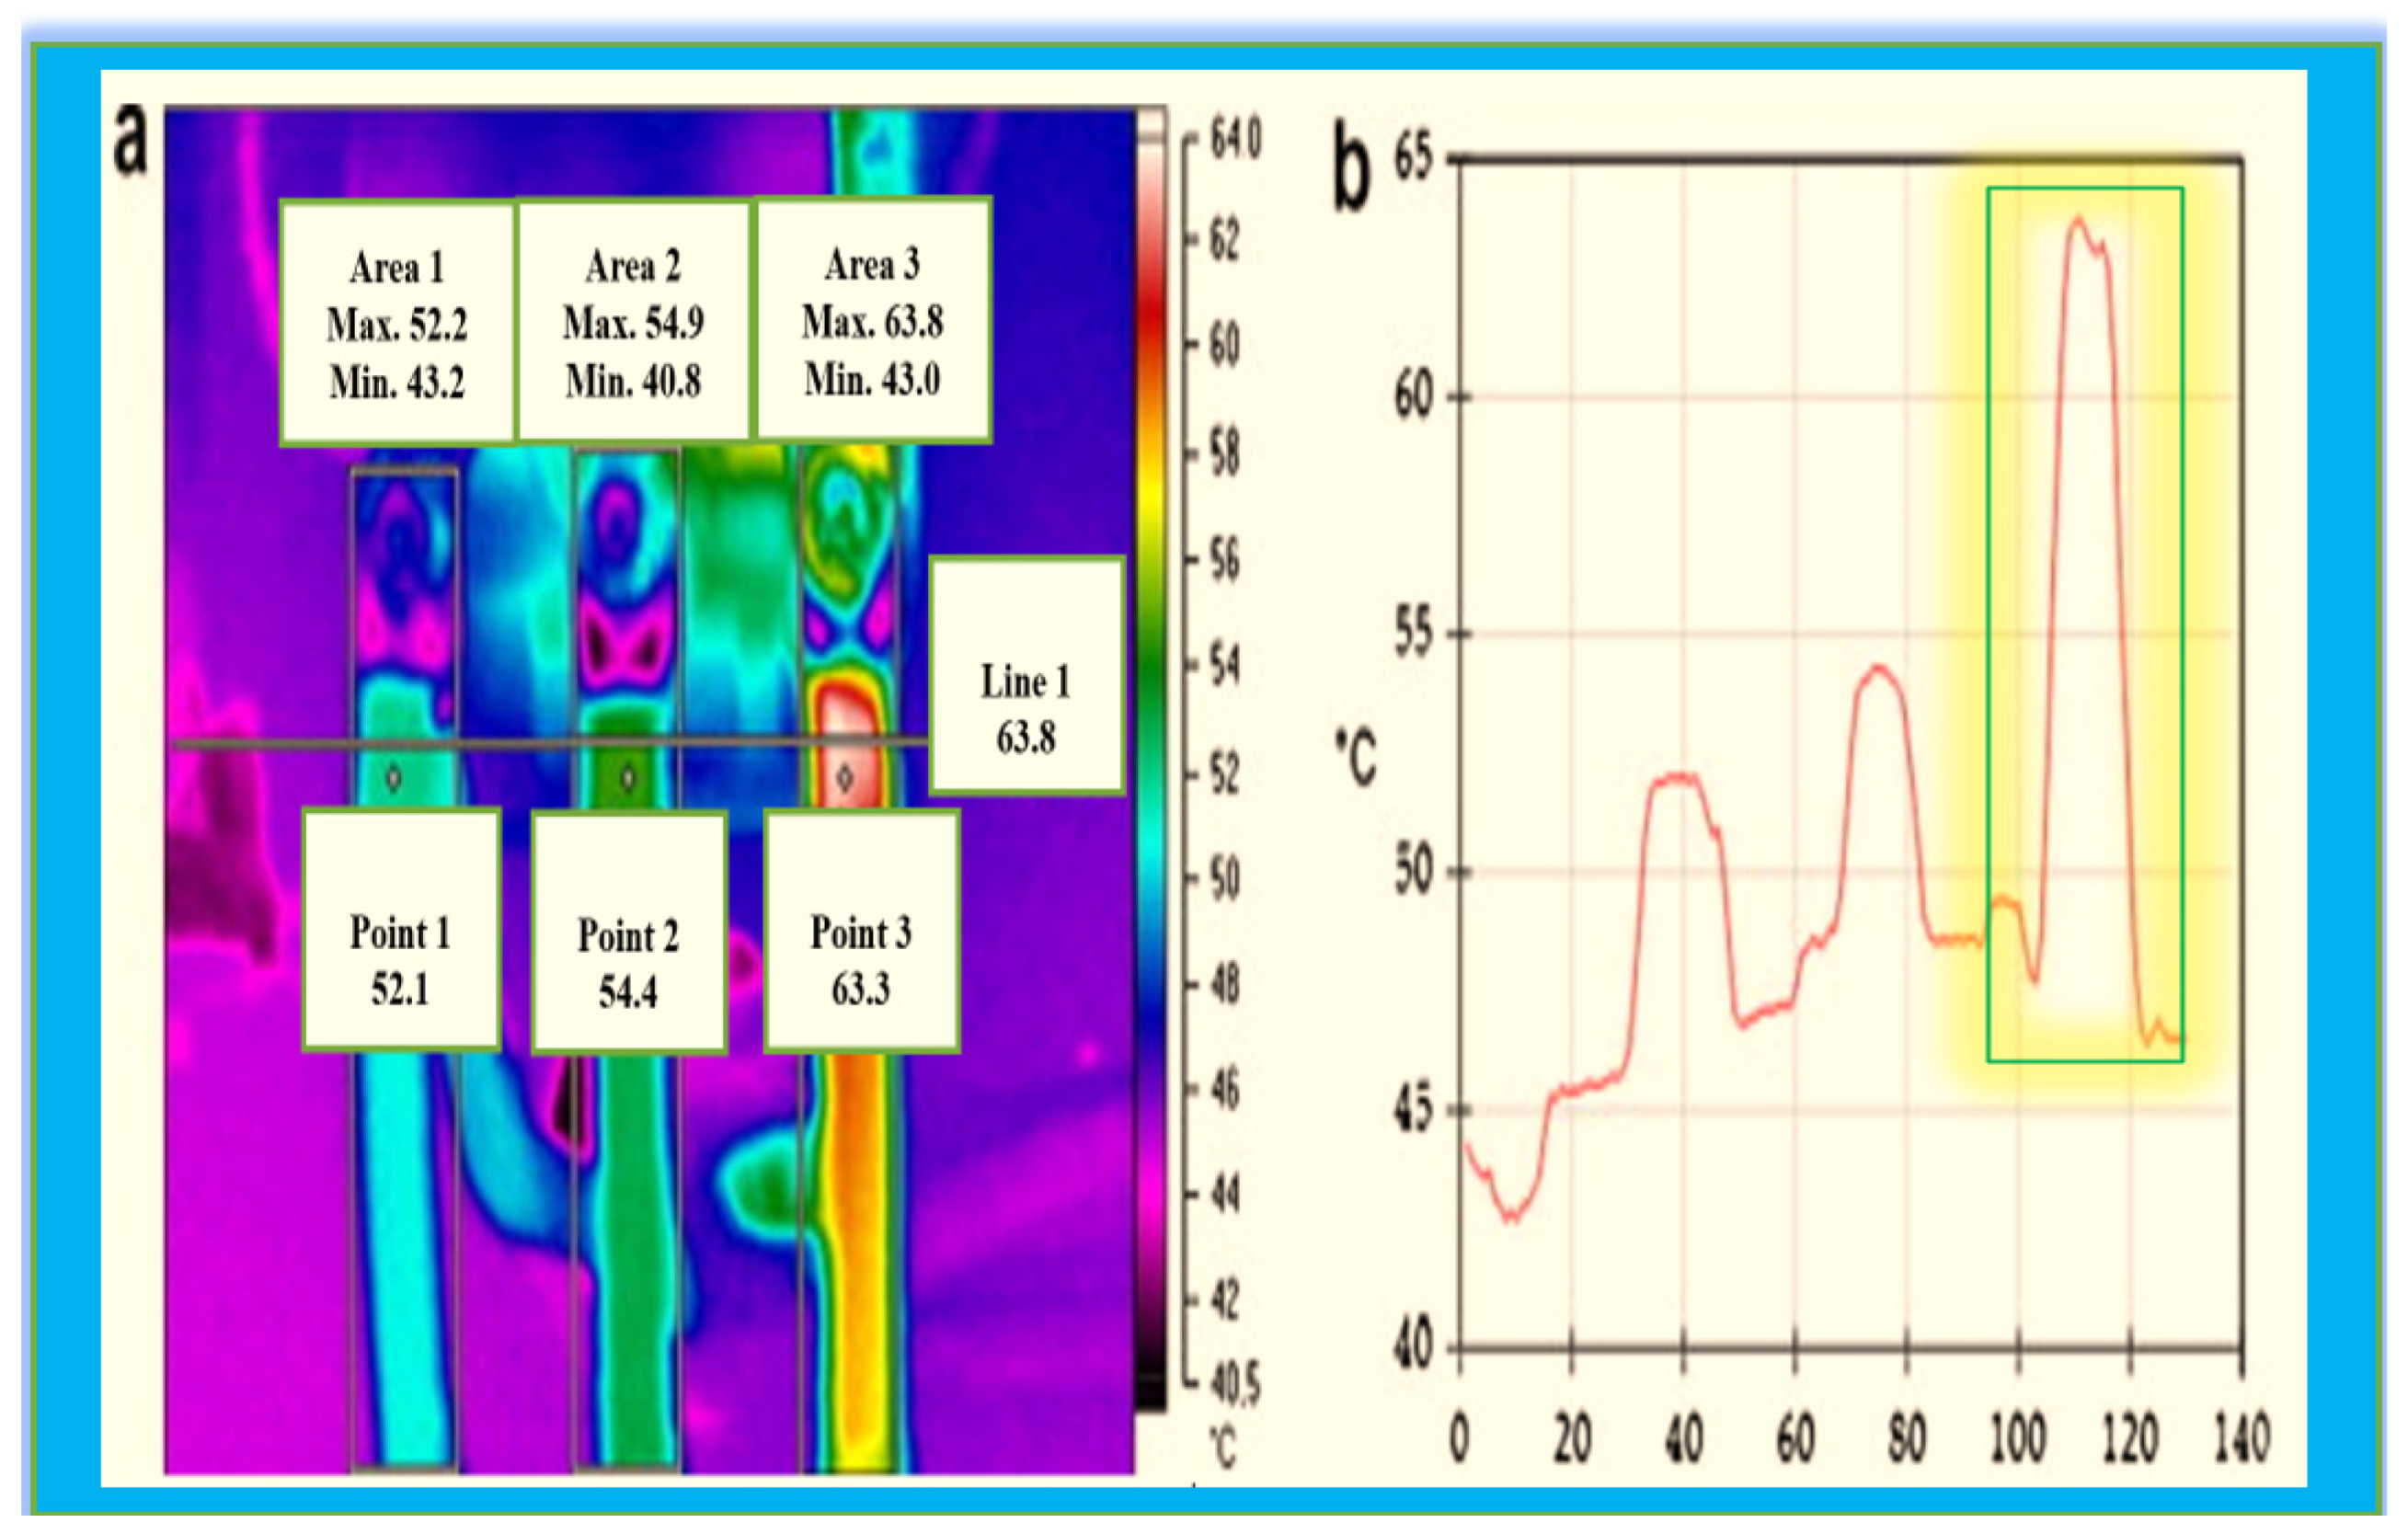
Figure 7. (a) Techniques for extracting temperature values and (b) the temperature profile across Line 1 [11].
Table 3. NETA and MIL-STD2194 standards for IRT-based electrical equipment inspection features [11][16][70].
| Standards | Temperature Difference (ΔT) (°C) | Actions to Be Taken | |
|---|---|---|---|
| Under Equivalent Stress, between Comparable Components | ΔT over Ambient Temperature (°C) | ||
| NETA | 1–3 | 1–10 | A potential shortage needs further examination. |
| 4–15 | 11–20 | Indicates a potential flaw that has to be fixed as soon as feasible. | |
| - | 22–40 | Continuously monitor until a solution can be found. | |
| >15 | >40 | There is a significant imbalance that must be addressed once and for all. | |
| MIL-STD2194 | 10–20 | - | Despite the remote possibility of component failure, corrective steps must be conducted at the next scheduled routine maintenance period. |
| 24–40 | - | Failure of a component is likely unless it is repaired. | |
| 40–70 | - | Component failure is almost inevitable unless something is done. | |
| >70 | - | A component is on the verge of failing. | |
| Introspection Institute Standard for Electrical Components | 1–10 | - | During the following maintenance period, corrective action should be conducted. |
| >10–20 | - | Corrective actions are necessary when time allows. | |
| >20–40 | - | Immediate corrective action is essential. | |
| >40 | - | Immediate corrective action is required. | |
2.5. Application to Motors
Induction motors with three phases are the most used prime movers in numerous industrial applications. Thermography for motor condition monitoring and problem diagnostics is necessary and may be justified economically [71]. The stator, rotor, and bearings are the main components of an induction motor (IM). IMs will fail if any of these components or their subcomponents are damaged. The stator, bearing, rotor, and other mechanical flaws are the most common IM faults, although the wide categorization of IM faults is presented in Figure 8.
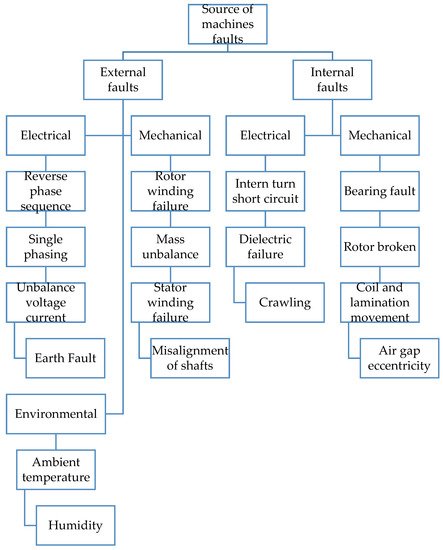
Figure 8. Classification of faults in induction motors [72].
Although IMs are quite constant in their functioning, their failure limits the smooth operation of IMs, which costs the industries a lot of money. The Electric Power Research Institute (EPRI) and the Institution of Electrical and Electronics Engineers conducted statistical analyses of IM failures, as shown in Figure 9 (IEEE). In Figure 9, a bar chart depicts a comparison of several problems that often occur in rotating machinery. Bearing, stator, rotor, and other defects are the different types of faults. The percentage frequency of their occurrence is clearly shown in the bar chart. According to [73], the majority of induction motor defects (41%) and winding (37%) are connected, as indicated in Figure 9’s bar chart. The inter-turn defect is the more dangerous of the two since it may cause a rise in motor surface temperature. Due to a short circuit, this might result in a full loss of phase and potentially deadly accidents. However, a failure of the cooling system might cause a temperature increase in an induction motor [74][75].
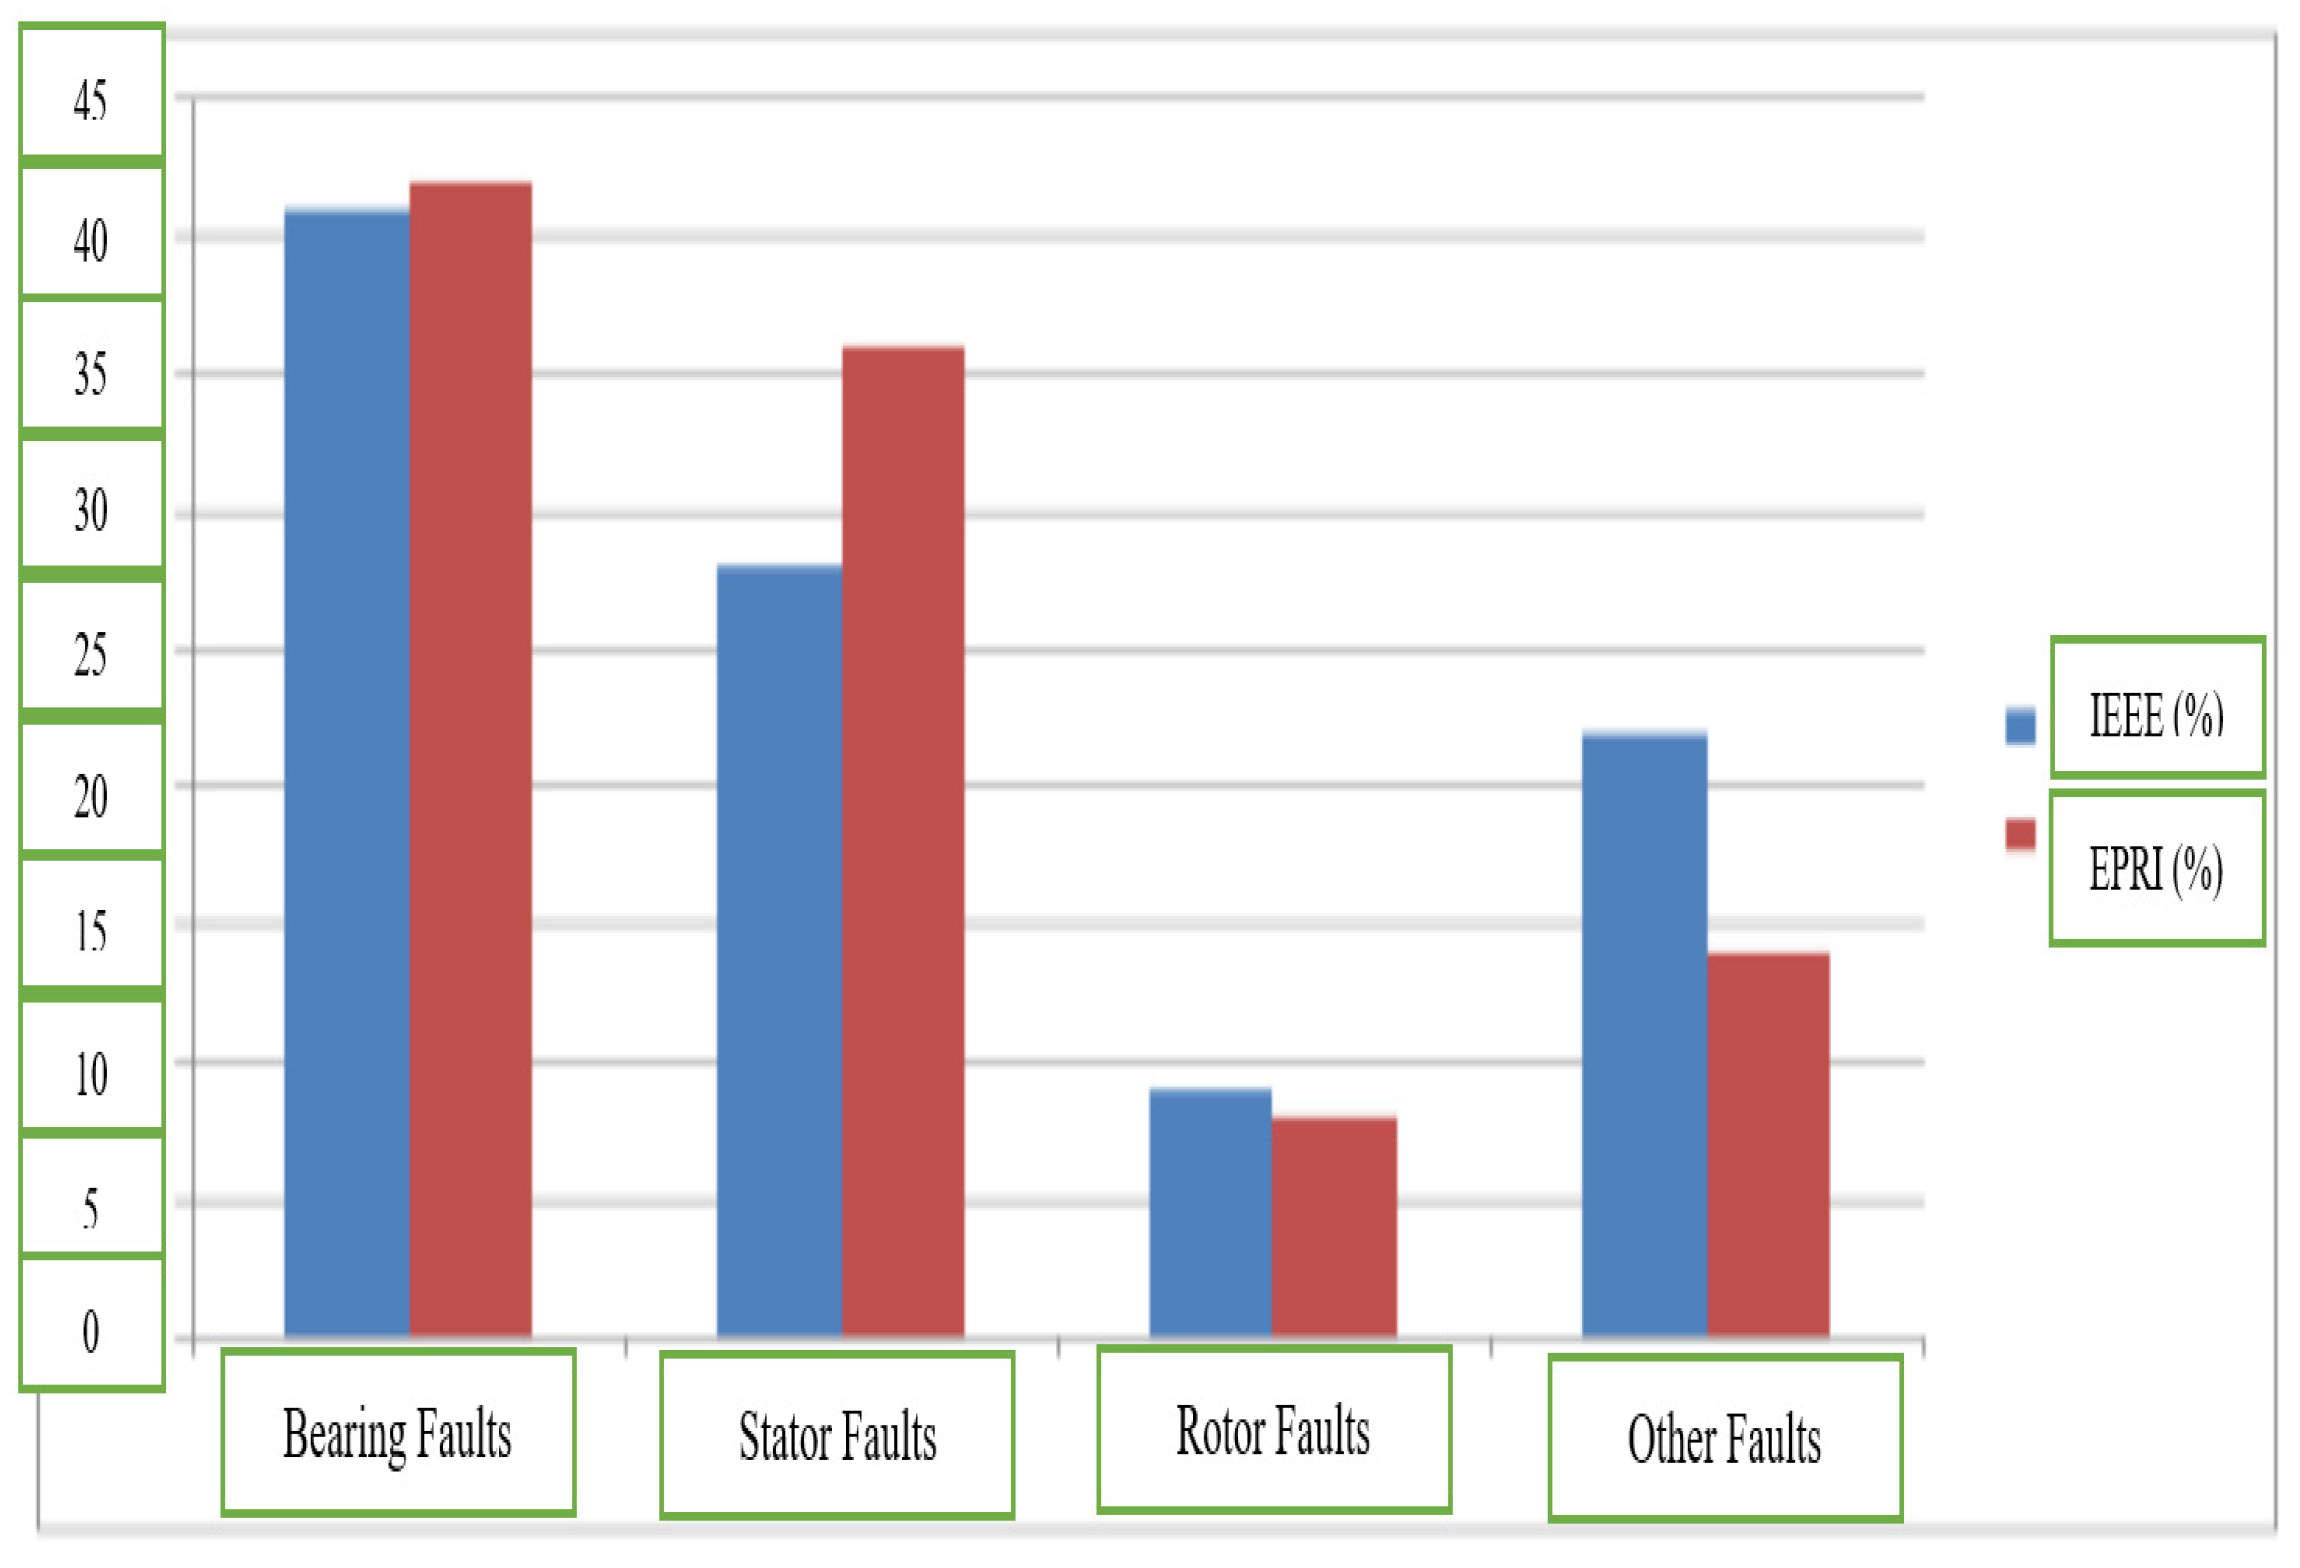
Figure 9. Study of induction motor faults by IEEE and EPRI [72].
2.5.1. Failure of Cooling System
The discrepancy between the input electrical power Pi and the output mechanical power P0 is referred to as Ploss(1). These losses are dissipated in the form of heat. This heat is evacuated into the environment through convection and radiation processes. Heat is dispersed into the surroundings in a self-cool motor by forced convection Pfconv radiation Prad, as defined in (2) [39]. The collection of debris, obstruction of air passages, damage or loose fans, and poor clearance during installation are all major causes of cooling system failure [71]. When the cooling system fails, forced convection is disrupted, causing the motor surface temperature to rise. A thermographic examination can identify this temperature increase. The International Electrical Testing Association (NETA) suggested a standard for thermographic testing of electrical systems, as illustrated in Table 3. This is used to determine the severity of a malfunction and the degree of maintenance priority for electrical systems and spinning machinery. Early identification of cooling system failure may be aided by recreating this defect in the laboratory and measuring the temperature of the motor at the target area of interest in line with NETA standards. Figure 10 and Figure 11 depict a healthy cooling system and a cooling system failure, respectively, using thermography [71].
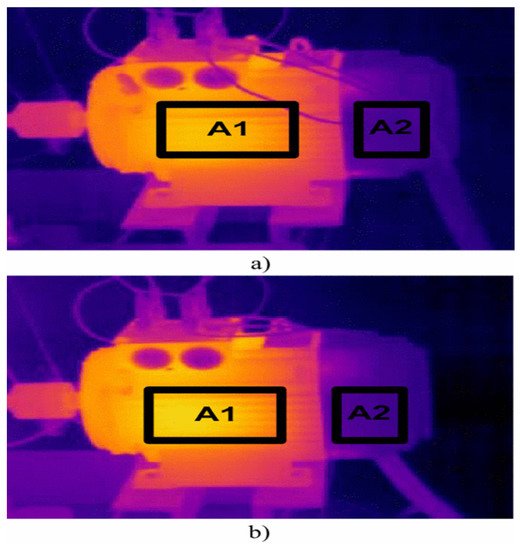
Figure 10. Thermal image of healthy motor at (a) no load and (b) at 50% load condition [71]. Region A1 is motor stator and region A2 is fan cowing.
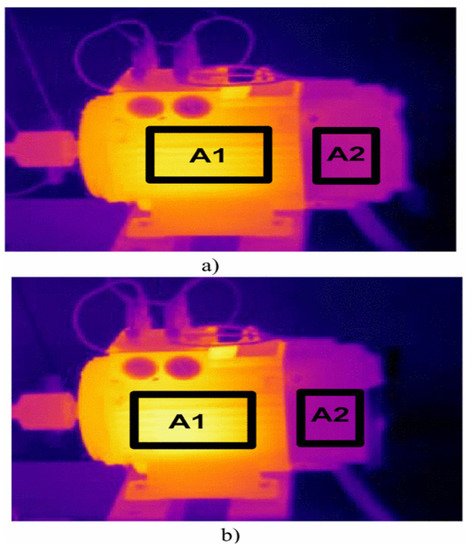
Figure 11. Thermal images of faulty motor at (a) no load and (b) 50% load condition [71]. Region A1 is motor stator and region A2 is fan cowing.
The regions Al and A2 in Figure 10 and Figure 11 indicate the surface temperature of the motor stator and fan cowing, respectively. The maximum surface temperature of the motor stator and the cooling section are represented by TA1 and TA2. All these tests were carried out at a constant temperature of 27 °C (Ta).
2.5.2. Bearing Faults
Bearings are one of the most important components of rotating equipment, and they are used in a wide range of technical applications such as turbines, heavy machinery, rolling mills, and ships. Bearings, being the principal component of a rotating machine, provide a number of tasks, including decreasing friction between relative moving components and providing support for the spinning shaft [76]. According to IEEE and EPRI, 41 percent and 42 percent of bearing faults occur during operation, respectively, as illustrated in Figure 9. For the CM of bearings in IMs, acoustic emission and vibration signal analysis were compared [77]. Figure 12 depicts an autonomous bearing problem detection framework that uses thermal imaging to identify four distinct bearing states in an induction motor.
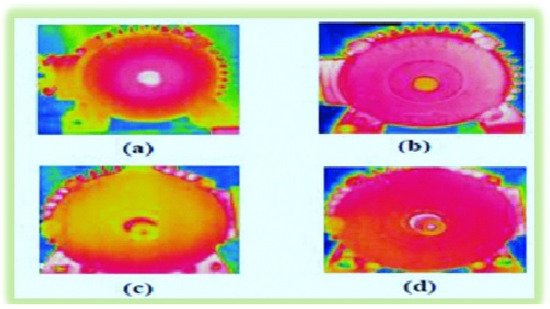
Figure 12. Thermal picture of four bearing states (a) No lubrication (b) Inner race defect (c) Outer race defect (d) Healthy. In an electrical laboratory at NITTTR, Chandigarh, thermal pictures of an induction motor were captured using a FLIR E-60 (thermal camera). During the experiment, the camera was placed 2 feet away from the induction motor. Under laboratory circumstances, thermal pictures of an induction motor were recorded. Thermal photos of the four bearing states in the three-phase squirrel-cage induction motor were captured: outer race, inner race, lake of lubrication problems, and healthy. Each condition included 24 thermal photographs [78].
2.5.3. Stator Fault
One of the most well-known issues in IMs is stator winding failure [79]. If an IM isn’t working properly, it might slow down production or even shut down the facility, which can lead to an increase in the frequency of accidents. Early defect identification lowers production time lost, increases operator safety, and decreases maintenance costs [80]. Stator windings, stator frames, and winding laminations are some of the most prevalent stator problems, although stator windings are the most common. Thermal, mechanical, electrical, and environmental stressors all contribute to stator winding breakdown [81]. Thermal stress is one of the most important factors in the breakdown of insulation. According to IEEE and EPRI, stator winding faults occur 28 percent of the time and 36 percent of the time, respectively, as illustrated in Figure 9. An infrared investigation of winding asymmetry is shown in Figure 13.
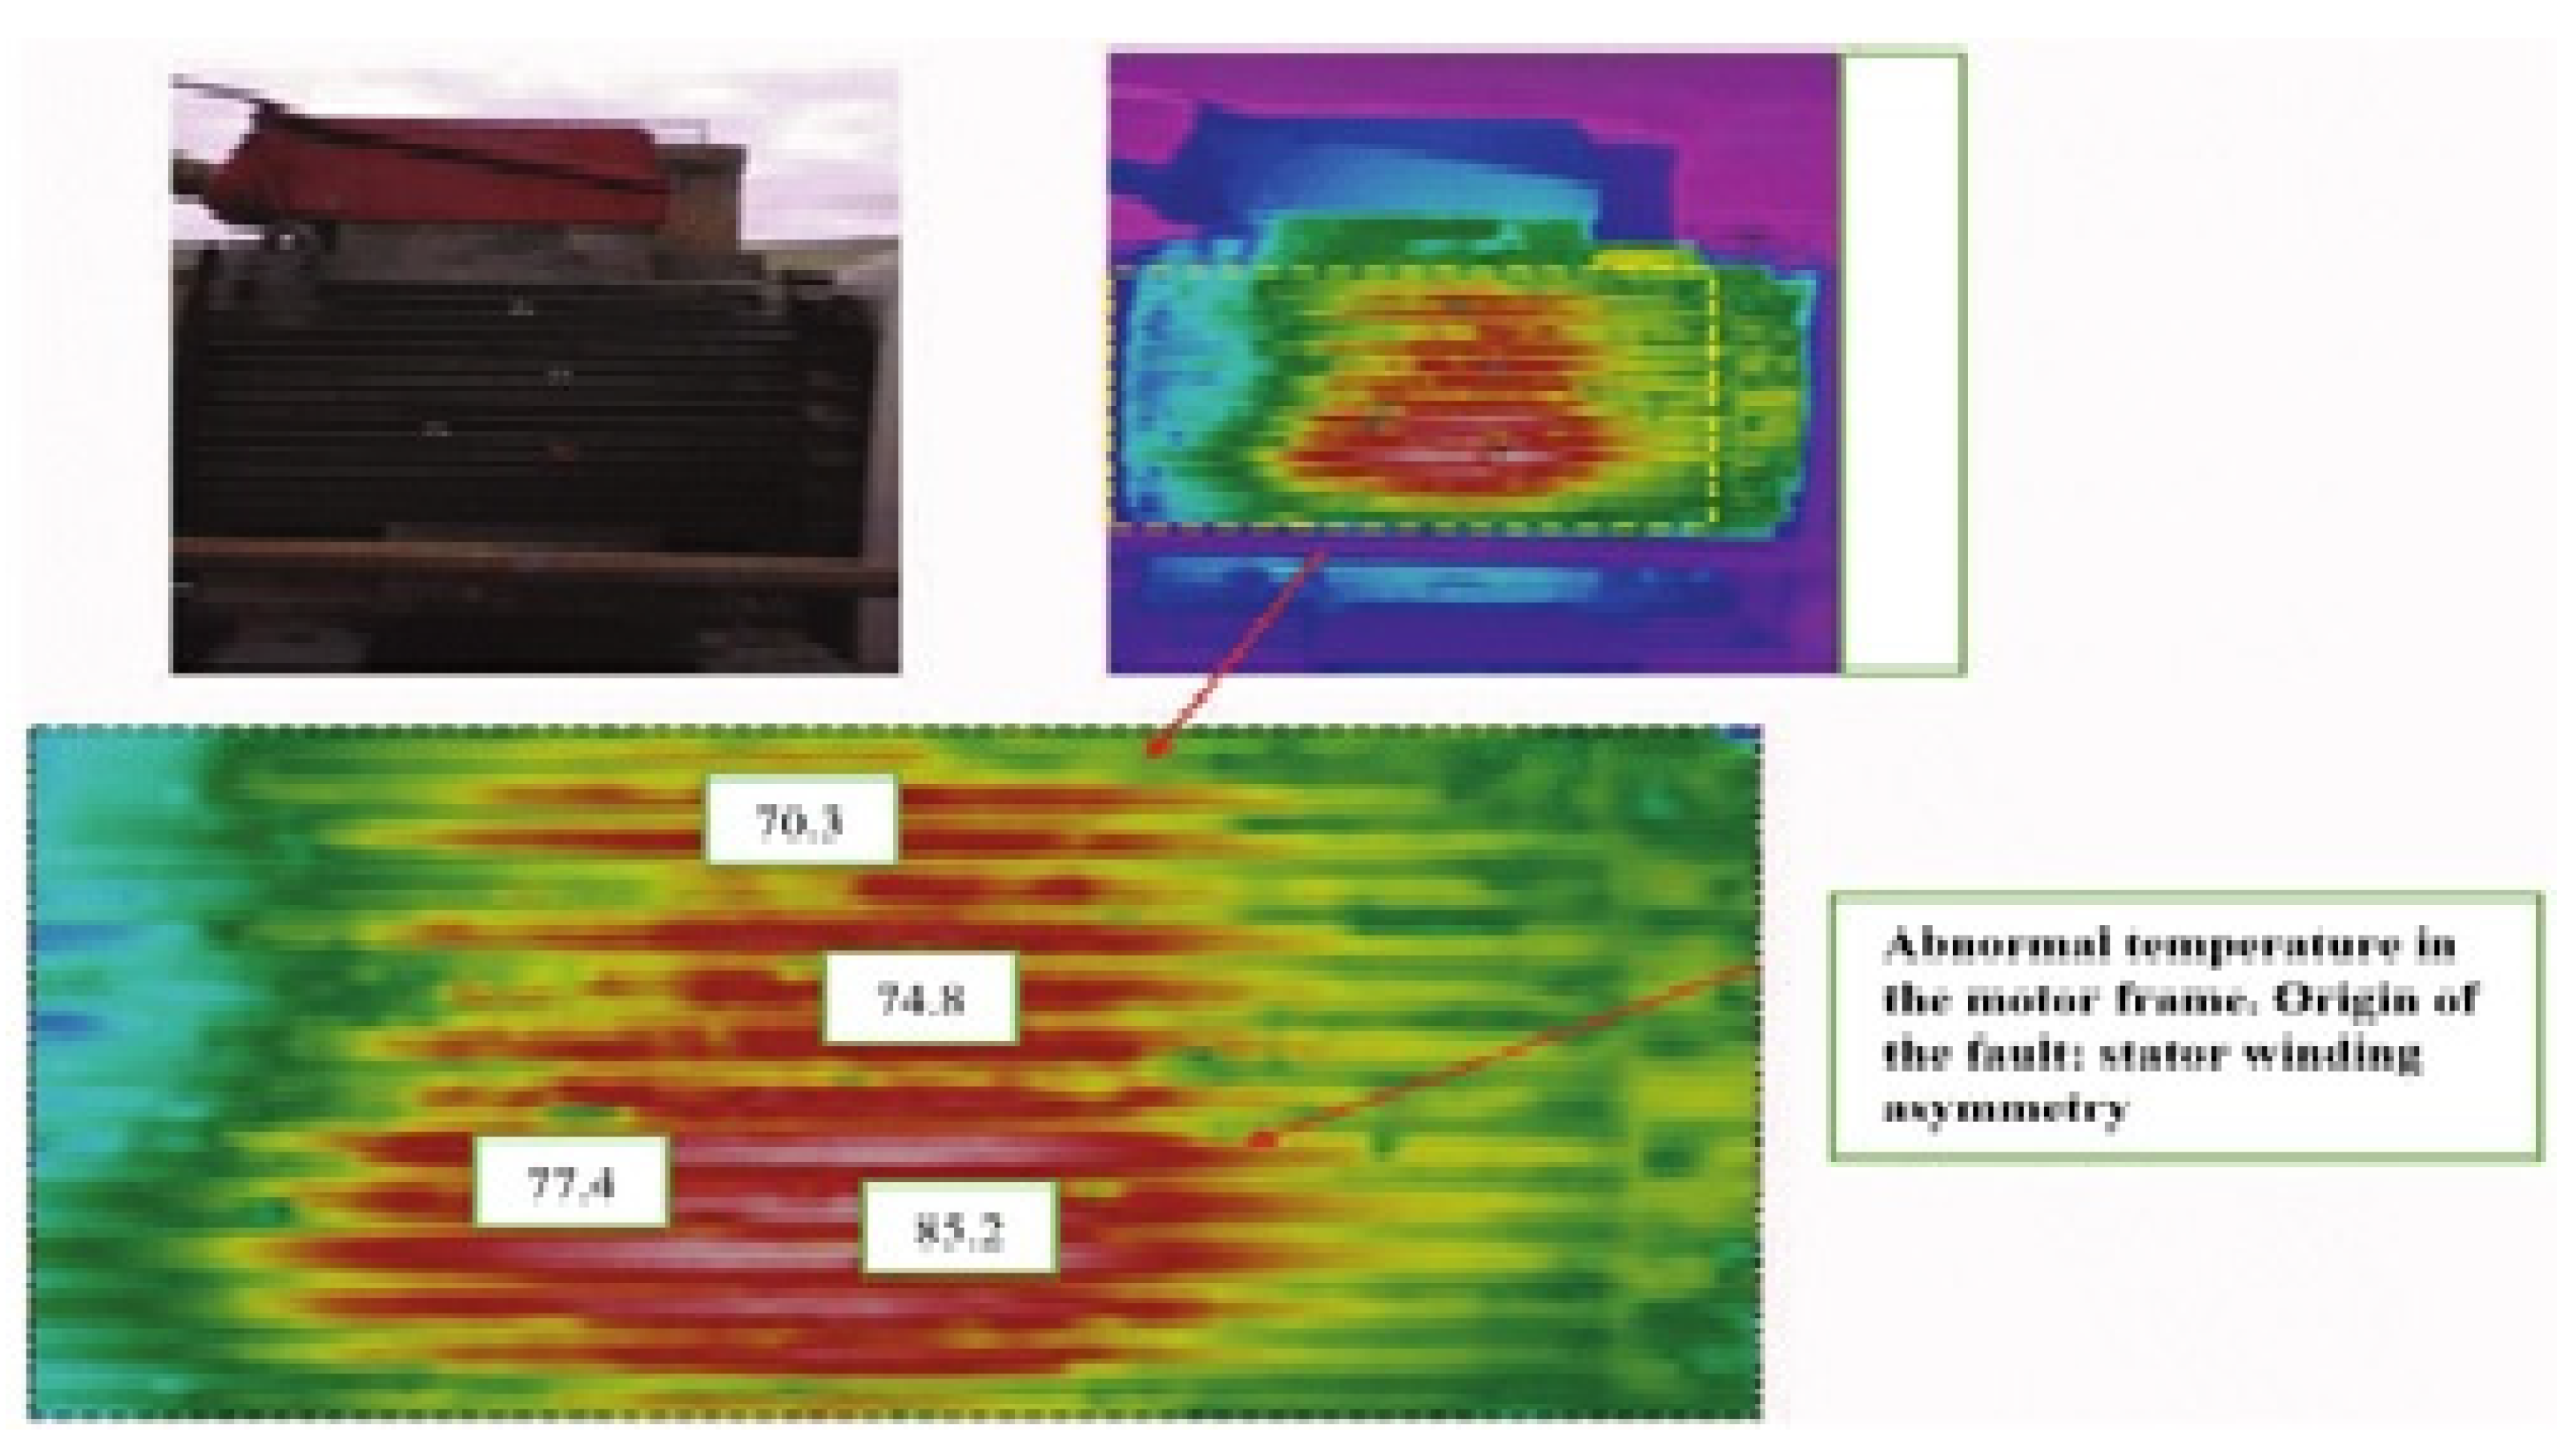
Figure 13. Infrared investigation of asymmetry in motor windings [82]. The infrared examination of the motor revealed high heating in the motor frame (85.2 °C on the surface and, most likely, over 100 °C within). During the examination, no cooling irregularities were discovered. The bearings were re-lubricated and repaired at a workshop as a preliminary step, but no temperature decrease was noted. After that, the motor terminal box was examined, and just a little temperature differential was discovered between the connections. An ohmmeter was used to test the winding resistance of each phase, and the findings were rather fascinating; there was a large winding asymmetry across phases, resulting in a Max Delta R value of about 9%. Internal high resistance connections, broken twists, or internal shorts might all be the cause of this. This might be the source of the unusual heat dissipation. Finally, rewinding the motor was advised.
2.5.4. Eccentricity Fault
The situation is known as air-gap eccentricity when the distance between the rotor and the stator in the airgap is not uniform. The two types of eccentricity defects are static and dynamic eccentricity, as illustrated in Figure 14. The condition of static eccentricity occurs when the offset between the center of the shaft and the center of the stator is constant, while dynamic eccentricity occurs when the offset between the center of the shaft and the center of the stator is changeable. As indicated in Figure 14, Rr is the rotor’s radius and Rs is the stator’s radius. Methods such as FFT, wavelet, and Hilbert transform have been utilized to extract signals for the detection of eccentricity defects in IMs [83].
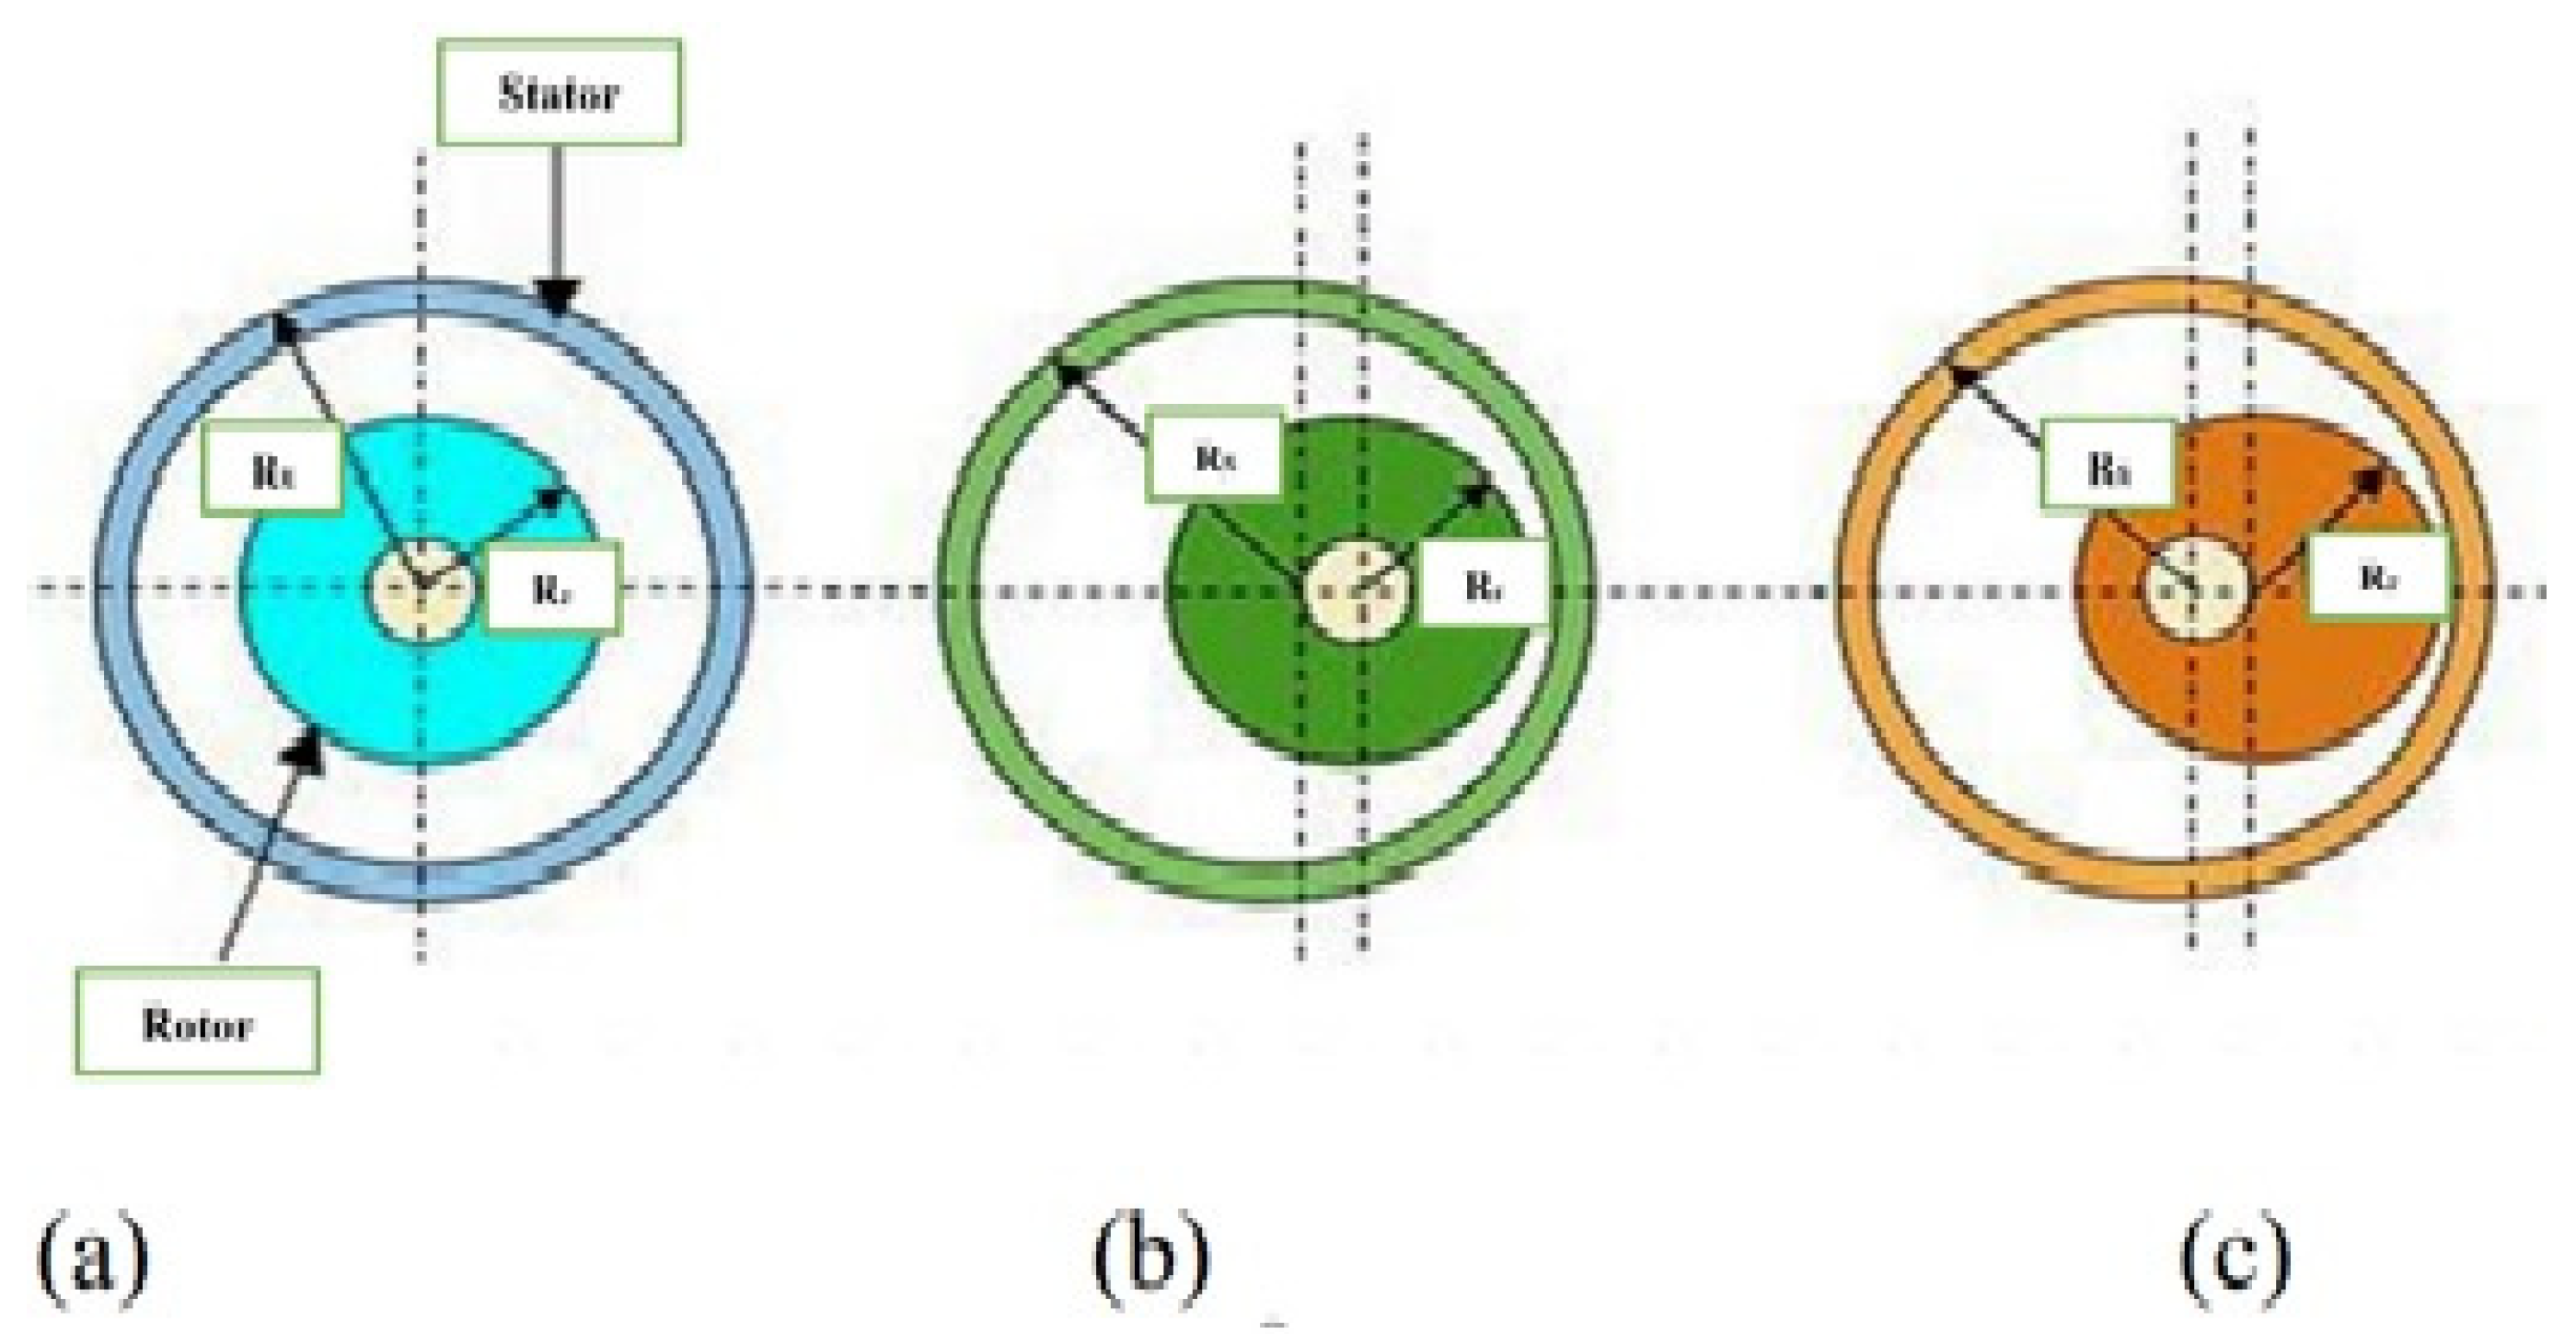
Figure 14. Cross-section of induction motor (a) normal (b) static eccentricity (c) dynamic eccentricity [83].
References
- Thermography Theory—Physical Basics|InfraTec GmbH. Available online: https://www.infratec.eu/thermography/service-support/glossary/theory/ (accessed on 9 June 2021).
- Theoretical Principle of Thermography|Infrared Detection|Testo® India. Available online: https://www.testo.com/en-IN/Theoretical+principles+of+thermography+/services_knowledgebase_thermography_theory (accessed on 9 June 2021).
- Meola, C. (Ed.) Infrared Thermography Recent Advances and Future Trends—Google Books. Available online: https://books.google.com.my/books?hl=en&lr=&id=ngMqDgAAQBAJ&oi=fnd&pg=PA3&dq=infrared+thermography+theory&ots=K1QjiEeLDF&sig=E1HCbZw3_MhBvzsB7bVKDrorQP4#v=onepage&q&f=false (accessed on 9 June 2021).
- Lahiri, B.B.; Bagavathiappan, S.; Jayakumar, T.; Philip, J. Medical applications of infrared thermography: A review. Infrared Phys. Technol. 2012, 55, 221–235.
- Radiometric Temperature Measurements: I. Fundamentals—Google Books. Available online: https://books.google.com.my/books?hl=en&lr=&id=SmL7HOyEn1QC&oi=fnd&pg=PP1&ots=f6icGs68B1&sig=oHZalyBM92Wbgn7KXlRQTKStWkk&redir_esc=y#v=onepage&q&f=false (accessed on 25 August 2021).
- Biomedical Sensors—Google Books. Available online: https://books.google.com.my/books?hl=en&lr=&id=7cI83YOIUTkC&oi=fnd&pg=PR5&ots=mMwZ0Nhpv_&sig=_9MPAsny6-g-v_8oMJO6yPs898o&redir_esc=y#v=onepage&q&f=false (accessed on 25 August 2021).
- Kylili, A.; Fokaides, P.A.; Christou, P.; Kalogirou, S.A. Infrared thermography (IRT) applications for building diagnostics: A review. Appl. Energy 2014, 134, 531–549.
- Scopus—Document Details—New Developments in Low Cost Infrared Imaging System|Signed in. Available online: https://www.scopus.com/record/display.uri?eid=2-s2.0-84862180679&origin=inward&txGid=b18f13a6446695c3ee52b1985c6dbecf (accessed on 25 August 2021).
- White, T.; Marshall, C.; Butler, N. Uncooled infrared sensor with digital focal plane array for medical applications. In Proceedings of the 18th Annual International Conference of the IEEE Engineering in Medicine and Biology Society, Amsterdam, The Netherlands, 31 October–3 November 1996; Volume 5, pp. 2081–2082.
- Venkataraman, S.B.; Raj, B. Performance parameters for thermal imaging systems. Insight Non-Destr. Test. Cond. Monit. 2003, 45, 531–535.
- Jadin, M.S.; Taib, S. Recent progress in diagnosing the reliability of electrical equipment by using infrared thermography. Infrared Phys. Technol. 2012, 55, 236–245.
- An Informative Guide for the Use of Thermal Imaging Cameras in Industrial Applications Thermal Imaging Guidebook for Industrial Applications Content . Available online: https://www.flirmedia.com/MMC/THG/Brochures/T820264/T820264_EN.pdf (accessed on 16 June 2022).
- Sarawade, A.A.; Charniya, N.N. Infrared Thermography and its Applications: A Review. In Proceedings of the 2018 3rd International Conference on Communication and Electronics Systems (ICCES), Coimbatore, India, 15–16 October 2018; pp. 280–285.
- Vinay, C.; Reddy, K.; Ramana, K.V. A review of methods on Condition Monitoring and Fault Diagnosis using IR Thermography-An Expert System approach. IOP Conf. Ser. Mater. Sci. Eng. 2020, 981, 042027.
- The Latest Reliability & Uptime Maintenance News—Reliabilityweb: A Culture of Reliability. Available online: https://reliabilityweb.com/ (accessed on 31 August 2021).
- Kandeal, A.; Elkadeem, M.; Thakur, A.K.; Abdelaziz, G.B.; Sathyamurthy, R.; Kabeel, A.; Yang, N.; Sharshir, S.W. IInfrared thermography-based condition monitoring of solar photovoltaic systems: A mini review of recent advances. Sol. Energy 2021, 223, 33–43.
- Doshvarpassand, S.; Wu, C.; Wang, X. An overview of corrosion defect characterization using active infrared thermography. Infrared Phys. Technol. 2018, 96, 366–389.
- Bagavathiappan, S.; Lahiri, B.B.; Saravanan, T.; Philip, J.; Jayakumar, T. Infrared thermography for condition monitoring—A review. Infrared Phys. Technol. 2013, 60, 35–55.
- Suguna, M.; Roomi, S.M.M.; Sanofer, I. Fault localisation of electrical equipments using thermal imaging technique. In Proceedings of the 2016 International Conference on Emerging Technological Trends (ICETT), Kollam, India, 21–22 October 2016.
- Infrared Thermography—Google Books. Available online: https://books.google.com.my/books?hl=en&lr=&id=thyaDwAAQBAJ&oi=fnd&pg=PA209&dq=+Thermal+imaging+for+enhancing+inspection+reliability:+Detection+and+characterization&ots=2tiB1TvZA0&sig=zl2g5htQopKLxNss-SCLtW40h58&redir_esc=y#v=onepage&q=Thermal+imaging+for+enhancing+inspection+reliability%3A+Detection+and+characterization&f=false (accessed on 2 September 2021).
- Gade, R.; Moeslund, T.B. Thermal cameras and applications: A survey. Mach. Vis. Appl. 2013, 25, 245–262.
- Huda, A.S.N.; Taib, S.; Jadin, M.S.; Ishak, D. A semi-automatic approach for thermographic inspection of electrical installations within buildings. Energy Build. 2012, 55, 585–591.
- IEEE Xplore Full-Text PDF. Available online: https://ieeexplore.ieee.org/stamp/stamp.jsp?tp=&arnumber=8656979&tag=1 (accessed on 24 February 2021).
- Utami, N.Y.; Tamsir, Y.; Pharmatrisanti, A.; Gumilang, H.; Cahyono, B.; Siregar, R. Evaluation condition of transformer based on infrared thermography results. In Proceedings of the 2009 IEEE 9th International Conference on the Properties and Applications of Dielectric Materials, Harbin, China, 19–23 July 2009; pp. 1055–1058.
- Weiping, M.; Fangxiao, C.; Ying, S.; Chungui, X.; Ming, A. Fault diagnosis on power transformers using non-electric method. IEEE Int. Symp. Ind. Electron. 2006, 3, 1769–1773.
- Pearson, J.C.; Pandya, D.A. Utilizing infrared and power quality techniques to diagnose and re-commission 33 old power, lighting & receptacles panels and distribution transformers at the New Jersey International & Bulk Mail Center. In Proceedings of the 2007 Electrical Insulation Conference and Electrical Manufacturing Expo, Nashville, TN, USA, 22–24 October 2007; pp. 1–4.
- Pal, N.R.; Pal, S.K. A review on image segmentation techniques. Pattern Recognit. 1993, 26, 1277–1294.
- Pätz, T.; Preusser, T. Segmentation of stochastic images with a stochastic random walker method. IEEE Trans. Image Process. 2012, 21, 2424–2433.
- Almeida, C.A.L.; Braga, A.; Nascimento, S.; Paiva, V.; Martins, H.J.A.; Torres, R.; Caminhas, W.M. Intelligent thermographic diagnostic applied to surge arresters: A new approach. IEEE Trans. Power Deliv. 2009, 24, 751–757.
- Sergyán, S. Edge detection techniques of thermal images. In Proceedings of the 2012 IEEE 10th Jubilee International Symposium on Intelligent Systems and Informatics, Subotica, Serbia, 20–22 September 2012; pp. 227–231.
- Chacon, M.; Manickavasagan, A.; Flores-Tapia, D.; Thomas, G.; Joyas, D.S. Segmentation of wheat grains in thermal images based on pulse coupled neural networks. In Proceedings of the 2007 IEEE International Conference on Image Processing, San Antonio, TX, USA, 16 September–19 October 2007; Volume 2.
- Kapoor, P.; Prasad, S.V.A.V. Image processing for early diagnosis of breast cancer using infrared images. In Proceedings of the 2010 the 2nd International Conference on Computer and Automation Engineering (ICCAE), Singapore, 26–28 February 2010; Volume 3, pp. 564–566.
- Gomez-Moreno, H.; Maldonado-Bascon, S.; Gil-Jimenez, P.; Lafuente-Arroyo, S. Goal evaluation of segmentation algorithms for traffic sign recognition. IEEE Trans. Intell. Transp. Syst. 2010, 11, 917–930.
- Meng, F.; Li, H.; Liu, G.; Ngan, K.N. From logo to object segmentation. IEEE Trans. Multimed. 2013, 15, 2186–2197.
- Yang, C.; Xiaoming, G.; Qi, J. Infrared technology in the fault diagnosis of substation equipment. In Proceedings of the 2008 China International Conference on Electricity Distribution, Guangzhou, China, 10–13 December 2008.
- Kabir, S.; Jadin, M.S.; Taib, S.; Yusof, M.A.B. Image processing methods for evaluating infrared thermographic image of electrical equipments. In Proceedings of the Progress in Electromagnetics Research Symposium, Marrakesh, Morocco, 20–23 March 2011.
- Chan, W.L.; So, A.T.P.; Lai, L.L. Three-dimensional thermal imaging for power equipment monitoring. IEE Proc. Gener. Transm. Distrib. 2000, 147, 355–360.
- Fan, S.; Yang, S.; He, P.; Nie, H. Infrared Electric Image Thresholding Using Two-Dimensional Fuzzy Renyi Entropy. Energy Procedia 2011, 12, 411–419.
- Picazo-Rodenas, M.J.; Royo, R.; Antonino-Daviu, J.; Roger-Folch, J. Use of infrared thermography for computation of heating curves and preliminary failure detection in induction motors. In Proceedings of the 2012 XXth International Conference on Electrical Machines, Marseille, France, 2–5 September 2012; pp. 525–531.
- Eftekhari, M.; Moallem, M.; Sadri, S.; Hsieh, M.F. A novel indicator of stator winding inter-turn fault in induction motor using infrared thermal imaging. Infrared Phys. Technol. 2013, 61, 330–336.
- Amaral, T.G.; Pires, V.F.; Martins, J.F.; Pires, A.J.; Crisóstomo, M.M. Image processing to a neuro-fuzzy classifier for detection and diagnosis of induction motor stator fault. In Proceedings of the IECON 2007—33rd Annual Conference of the IEEE Industrial Electronics Society, Taipei, Taiwan, 5–8 November 2007; pp. 2408–2413.
- Han, Y.; Song, Y.H. Condition monitoring techniques for electrical equipment—A literature survey. IEEE Trans. Power Deliv. 2003, 18, 4–13.
- Abu-Siada, A.; Islam, S. A novel online technique to detect power transformer winding faults. IEEE Trans. Power Deliv. 2012, 27, 849–857.
- Farag, S.; Lin, B.K.; Habetler, T.G.; Schlag, J.H. An Unsupervised, On-Line System for Induction Motor Fault Detection Using Stator Current Monitoring. IEEE Trans. Ind. Appl. 1995, 31, 1280–1286.
- Yazici, B.; Kliman, G.B.; Premerlani, W.J.; Koegl, R.A.; Robinson, G.B.; Abdel-Malek, A. Adaptive, on-line, statistical method for bearing fault detection using stator current. In Proceedings of the IAS ’97. Conference Record of the 1997 IEEE Industry Applications Conference Thirty-Second IAS Annual Meeting, New Orleans, LA, USA, 5–9 October 1997; Volume 1, pp. 213–220.
- Zidani, F.; Benbouzid, M.E.H.; Diallo, D.; Naït-Saïd, M.S. Induction Motor Stator Faults Diagnosis by a Current Concordia Pattern-Based Fuzzy Decision System. IEEE Trans. Energy Convers. 2003, 18, 469–475.
- Briz, F.; Degner, M.W.; Zamarrón, A.; Guerrero, J.M. Online Stator Winding Fault Diagnosis in Inverter-Fed AC Machines using High-Frequency Signal Injection. IEEE Trans. Ind. Appl. 2003, 39, 1109–1117.
- Shutenko, O.; Ponomarenko, S. Diagnostics of Transformer Oils Using the Multiple Linear Regression Model. In Proceedings of the 2020 IEEE Problems of Automated Electrodrive. Theory and Practice (PAEP), Kremenchuk, Ukraine, 21–25 September 2020.
- Gielniak, J.; Czerniak, M. Investigation of Distribution Transformers Vibrations in Terms of Core and Winding Condition Assessment. Energies 2021, 15, 13.
- Kang, P.; Kang, P.; Birtwhistle, D. On-Line Condition Assessment of Power Transformer on-Load Tap Changers: Transient Vibration Analysis Using Wavelet Transform and Self-Organizing Map. 2000. Available online: http://citeseerx.ist.psu.edu/viewdoc/summary?doi=10.1.1.1006.6343 (accessed on 29 May 2022).
- Kang, P.; Birtwhistle, D. Condition assessment of power transformer on-load tap-changers using wavelet analysis. IEEE Trans. Power Deliv. 2001, 16, 394–400.
- Chien, C.-L.; Tseng, C. Information and Control ICIC International 2011 ISSN. Int. J. Innov. Comput. 2011, 7, 6691–6710.
- Dutta, T.; Sil, J.; Chottopadhyay, P. Condition monitoring of electrical equipment using thermal image processing. In Proceedings of the 2016 IEEE First International Conference on Control, Measurement and Instrumentation (CMI), Kolkata, India, 8–10 January 2016; pp. 311–315.
- Hellier, C.J. Handbook of Nondestructive Evaluation, 2nd ed.; McGraw-Hill Education: New York, NY, USA, 2013; p. 720. Available online: https://www.accessengineeringlibrary.com/content/book/9780071777148 (accessed on 2 September 2021).
- Griffith, D.A.; Zeybek, A.Y.; O’Brien, M. Knowledge Transfer as a Means for Relationship Development: A Kazakhstan–Foreign International Joint Venture Illustration. J. Int. Mark. 2018, 9, 1–18.
- Azmat, Z.; Turner, D.J. Infrared thermography and its role in rural utility environment. In Proceedings of the Rural Electric Power Conference, San Antonio, TX, USA, 8–10 May 2005.
- Santos, L.D.; Bortoni, E.C.; Souza, L.E.; Bastos, G.S.; Craveiro, M.A.C. Infrared thermography applied for outdoor power substations. In Proceedings of the SPIE Defense and Security Symposium, Orlando, FL, USA, 16–20 March 2008.
- Gašperič, S.; Šprajcar, B.; Bernard, R.; Glavič, R.; Elektro, S.; -Slovenija, L.D.D. The analysis of thermographic reports with emphasis on emissivity coefficient determination of bare conductors and joints. Connections 2007, 20, 21–24.
- Balaras, C.A.; Argiriou, A.A. Infrared thermography for building diagnostics. Energy Build. 2001, 34, 171–183.
- Snell, J.; Renowden, J. Improving results of thermographic inspections of electrical transmission and distribution lines. In Proceedings of the 2000 IEEE ESMO-2000 9th International Conference on Transmission and Distribution Construction, Operation and Live-Line Maintenance Proceedings, ESMO 2000 Proceedings, Global ESMO 2000, The Powa, Montreal, QC, Canada, 8–12 October 2000; pp. 303–311.
- Epperly, R.A.; Heberlein, G.E.; Eads, L.G. Tool for reliability and safety: Predict and prevent equipment failures with thermography. In Proceedings of the Record of Conference Papers, IEEE Industry Applications Society 44th Annual Petroleum and Chemical Industry Conference, Banff, AB, Canada, 15–17 September 1997; pp. 59–68.
- Zhang, L.; Ume, I.C.; Gamalski, J.; Galuschki, K.P. Study of flip chip solder joint cracks under temperature cycling using a laser ultrasound inspection system. IEEE Trans. Components Packag. Technol. 2009, 32, 120–126.
- IEICE Trans—Laser-SQUID Microscopy as a Novel Tool for Inspection, Monitoring and Analysis of LSI-Chip-Defects: Nondestructive and Non-Electrical-Contact Technique. Available online: https://search.ieice.org/bin/summary.php?id=e85-c_3_746 (accessed on 30 May 2022).
- dos Reis Benatto, G.A.; Chi, M.; Lancia, A.A.S.; Riedel-Lyngskær, N.; Jensen, O.B.; Thorseth, A.; Dam-Hansen, C.; Thorsteinsson, S.; Poulsen, P.B. Scaling up Laser Line Photoluminescence Imaging for Outdoor Inspections. In Proceedings of the 35th European Photovoltaic Solar Energy Conference and Exhibition, Brussels, Belgium, 24–28 September 2018; Volume 10, p. 2020.
- Benatto, G.A.D.R.; Chi, M.; Jensen, O.B.; Lancia, A.A.S.; Riedel, N.; Iandolo, B.; Davidsen, R.S.; Hansen, O.; Thorsteinsson, S.; Poulsen, P.B. Photoluminescence Imaging Induced by Laser Line Scan: Study for Outdoor Field Inspections. In Proceedings of the 2018 IEEE 7th World Conference on Photovoltaic Energy Conversion (WCPEC) (A Joint Conference of 45th IEEE PVSC, 28th PVSEC & 34th EU PVSEC), Waikoloa, HI, USA, 10–15 June 2018; pp. 395–399.
- Takasaki, M.; Chino, S.; Kato, Y.; Ishino, Y.; Mizuno, T. Actuation Force Measurement Mechanism for Non-Contact Ultrasonic Suspension. Key Eng. Mater. 2012, 523–524, 727–732.
- Zhao, Z.; Törmänen, M.; Myllylä, R. Frequency spectrum of laser ultrasonic signals from fibers and particles suspensions. Mol. Quantum Acoust. 2006, 27, 319–326.
- Chou, Y.C.; Yao, L. Automatic diagnosis system of electrical equipment using infrared thermography. In Proceedings of the 2009 International Conference of Soft Computing and Pattern Recognition, Malacca, Malaysia, 4–7 December 2009; pp. 155–160.
- Lindquist, T.M.; Bertling, L.; Eriksson, R. Estimation of disconnector contact condition for modelling the effect of maintenance and ageing. In Proceedings of the 2005 IEEE Russia Power Tech, St. Petersburg, Russia, 27–30 June 2005.
- Standard for Maintenance Testing Specifications for Electrical Power Equipment and Systems Secretariat NETA (InterNational Electrical Testing Association). 2011. Available online: www.netaworld.org (accessed on 29 August 2021).
- Singh, G.; Kumar, T.C.A.; Naikan, V.N.A. Fault diagnosis of induction motor cooling system using infrared thermography. In Proceedings of the 2016 IEEE 6th International Conference on Power Systems (ICPS), New Delhi, India, 4–6 March 2016.
- Infrared Thermography Based Fault Diagnosis and Prognosis for Rotating Machines|Semantic Scholar. Available online: https://www.semanticscholar.org/paper/Infrared-Thermography-Based-Fault-Diagnosis-and-for-Mehta-Choudhary/fbdba0c7610e445a234c98008246846ddff54960 (accessed on 16 June 2022).
- Thomson, W.T.; Fenger, M. Current signature analysis to detect induction motor faults. IEEE Ind. Appl. Mag. 2001, 7, 26–34.
- Picazo-Ródenas, M.J.; Antonino-Daviu, J.; Climente-Alarcon, V.; Royo-Pastor, R.; Mota-Villar, A. Combination of noninvasive approaches for general assessment of induction motors. IEEE Trans. Ind. Appl. 2014, 51, 2172–2180.
- Picazo-Ródenas, M.J.; Royo, R.; Antonino-Daviu, J.; Roger-Folch, J. Use of the infrared data for heating curve computation in induction motors: Application to fault diagnosis. Eng. Fail. Anal. 2013, 35, 178–192.
- Ramirez-Nunez, J.A.; Morales-Hernandez, L.A.; Osornio-Rios, R.A.; Antonino-Daviu, J.A.; Romero-Troncoso, R.J. Self-adjustment methodology of a thermal camera for detecting faults in industrial machinery. In Proceedings of the IECON 2016—42nd Annual Conference of the IEEE Industrial Electronics Society, Florence, Italy, 23–26 October 2016; pp. 7119–7124.
- Othman, M.S.; Nuawi, M.Z.; Mohamed, R. Experimental Comparison of Vibration and Acoustic Emission Signal Analysis Using Kurtosis-Based Methods for Induction Motor Bearing Condition Monitoring. Prz. Elektrotechniczny 2016, 92, 208–212.
- Choudhary, A.; Shimi, S.L.; Akula, A. Bearing fault diagnosis of induction motor using thermal imaging. In Proceedings of the 2018 International Conference on Computing, Power and Communication Technologies (GUCON), Greater Noida, India, 28–29 September 2018; pp. 950–955.
- Cruz, S.M.A.; Cardoso, A.J.M. Stator winding fault diagnosis in three-phase synchronous and asynchronous motors, by the extended park’s vector approach. IEEE Trans. Ind. Appl. 2001, 37, 1227–1233.
- Joksimovic, G.M.; Penman, J. The detection of inter-turn short circuits in the stator windings of operating motors. IEEE Trans. Ind. Electron. 2000, 47, 1078–1084.
- Bonnett, A.H.; Soukup, G.C. Cause and Analysis of Stator and Rotor Failures in Three-Phase Squirrel-Cage Induction Motors. IEEE Trans. Ind. Appl. 1992, 28, 921–937.
- Lopez-Perez, D.; Antonino-Daviu, J. Application of infrared thermography to fault detection in industrial induction motors: Case stories. In Proceedings of the 2016 XXII International Conference on Electrical Machines (ICEM), Lausanne, Switzerland, 4–7 September 2016; pp. 2172–2177.
- Choudhary, A.; Goyal, D.; Shimi, S.L.; Akula, A. Condition Monitoring and Fault Diagnosis of Induction Motors: A Review. Arch. Comput. Methods Eng. 2018, 26, 1221–1238.
More
Information
Subjects:
Engineering, Electrical & Electronic
Contributors
MDPI registered users' name will be linked to their SciProfiles pages. To register with us, please refer to https://encyclopedia.pub/register
:
View Times:
3.3K
Revisions:
2 times
(View History)
Update Date:
02 Sep 2022
Table of Contents


Notice
You are not a member of the advisory board for this topic. If you want to update advisory board member profile, please contact office@encyclopedia.pub.
OK
Confirm
Only members of the Encyclopedia advisory board for this topic are allowed to note entries. Would you like to become an advisory board member of the Encyclopedia?
Yes
No
${ textCharacter }/${ maxCharacter }
Submit
Cancel
Back
Comments
${ item }
|
${ item.createdUser.fullName }
${ item.createdAt }
${ item.vote }
${ item.reply }
Delete
${ reply.createdUser.fullName }
${ reply.createdAt }
${ reply.vote }
Delete
There is no reply to this comment~
${ item.replyTextCharacter }/${ item.replyMaxCharacter }
Submit
Cancel
More
No more~
There is no comment~
${ textCharacter }/${ maxCharacter }
Submit
Cancel
${ selectedItem.replyTextCharacter }/${ selectedItem.replyMaxCharacter }
Submit
Cancel
Confirm
Are you sure to Delete?
Yes
No