Your browser does not fully support modern features. Please upgrade for a smoother experience.
Submitted Successfully!
 +1 credit
Thank you for your contribution! You can also upload a video entry or images related to this topic.
For video creation, please contact our Academic Video Service.
| Version | Summary | Created by | Modification | Content Size | Created at | Operation |
|---|---|---|---|---|---|---|
| 1 | Soisungwan Satarug | -- | 2039 | 2022-08-31 04:02:23 | | | |
| 2 | Conner Chen | -25 word(s) | 2014 | 2022-09-01 09:03:01 | | |
Video Upload Options
We provide professional Academic Video Service to translate complex research into visually appealing presentations. Would you like to try it?
Cite
If you have any further questions, please contact Encyclopedia Editorial Office.
Satarug, S.; Gobe, G.C.; Vesey, D.A. Targets of Toxicity in Environmental Exposure to Cadmium. Encyclopedia. Available online: https://encyclopedia.pub/entry/26704 (accessed on 16 June 2026).
Satarug S, Gobe GC, Vesey DA. Targets of Toxicity in Environmental Exposure to Cadmium. Encyclopedia. Available at: https://encyclopedia.pub/entry/26704. Accessed June 16, 2026.
Satarug, Soisungwan, Glenda C. Gobe, David A. Vesey. "Targets of Toxicity in Environmental Exposure to Cadmium" Encyclopedia, https://encyclopedia.pub/entry/26704 (accessed June 16, 2026).
Satarug, S., Gobe, G.C., & Vesey, D.A. (2022, August 31). Targets of Toxicity in Environmental Exposure to Cadmium. In Encyclopedia. https://encyclopedia.pub/entry/26704
Satarug, Soisungwan, et al. "Targets of Toxicity in Environmental Exposure to Cadmium." Encyclopedia. Web. 31 August, 2022.
Copy Citation
Dietary assessment reports and population surveillance programs show that chronic exposure to low levels of environmental cadmium (Cd) is inevitable for most people, and adversely impacts the health of children and adults.
cadmium
dietary exposure
fecundity
1. Introduction
Cadmium (Cd) is a toxic metal of growing public health concern due to its widespread contamination of staple foods and air, and its exquisite toxicity to multiple organ systems [1][2][3]. Like all other metals, Cd persists indefinitely in the environment because of its nonbiodegradability. Despite its low levels in Earth’s crust and most soils, it can accumulate in vegetation because of its efficient soil-to-plant transference [4][5][6]. Cd is found in high abundance and is associated with the zinc (Zn) ores greenockite and sphalerite; thus, it is a byproduct of the mining, smelting, and refining of Zn ores, and has been used in many industrial processes [5][6]. Due to the realization of its high toxicity, the worldwide production and industrial uses of Cd have greatly reduced. However, the continued use of Cd-contaminated phosphate fertilizers still adds Cd to the food chain in most parts of the world [7][8][9].
As food crops form the major source of non-workplace Cd exposure in the non-smoking population [10][11], and because an outbreak of severe Cd poisoning, called “itai-itai” disease, revealed a health threat from the Cd contamination of rice [12][13], exposure guidelines and toxicity threshold levels of Cd in the human diet were established [14][15]. In addition, dietary assessment methods such as food-frequency questionnaires, duplicate diet studies and total diet studies (TDSs) have been used to monitor population exposure [10][11][16].
TDS is known also as the “market basket survey” because it involves the collection of samples of foodstuffs from supermarkets and retail stores for the quantitation of various food additives, pesticide residues, contaminants, and nutrients [10][11]. It is a reasonable method to identify sources as well as to gauge the levels of various contaminants and food additives in the human diet. Various food authority agencies such as the U.S. Food and Drug Administration (FDA), the European Food Safety Agency (EFSA), and the Food Standards of Australia and New Zealand (FSANZ) are tasked with conducting these monitoring programs. Overall, the TDS data indicate that Cd intake varies widely among populations, but the foods that are frequently consumed in large quantities, such as rice, potatoes, wheat, and leafy salad vegetables, are consistently the major sources of Cd [1][2].
2. Cadmium Tolerable Intake Level and Toxicity Threshold Level
The Joint FAO/WHO Expert Committee on Food Additives and Contaminants (JECFA) considered the kidney to be the critical target of Cd toxicity [14]. By definition, the provisional tolerable weekly intake (PTWI) for a chemical with no known biological function is an estimate of the amount that can be ingested weekly over a lifetime without an appreciable health risk. In 2010, the PTWI for Cd was amended to a tolerable monthly intake (TMI) of 25 μg per kg body weight per month, equivalent to 0.83 μg per kg body weight per day. Similarly, a Cd excretion rate of 5.24 μg/g creatinine was adopted as a nephrotoxicity threshold value [14].
The tolerable intake level derived by JECFA was based on a risk assessment model that considered an increase in the excretion rate of the low-molecular-weight protein β2-microglubulin (β2M) above 300 μg/g creatinine to be a “critical” endpoint. The European Food Safety Authority (EFSA) accepted the same endpoint. However, the EFSA designated a Cd excretion rate of 1 μg/g creatinine as the toxicity threshold with their inclusion of an uncertainty factor (safety margin), where an intake of 0.36 μg/kg body weight per day for 50 years was derived as an acceptable Cd ingestion level or reference dose (RfD) [15][16]. In theory, a threshold of toxicity is defined as the highest dose that does not produce an adverse effect in the most sensitive organ [17].
In a recent assessment, β2M excretion levels of 100–299, 300–999, and ≥1000 μg/g creatinine were associated with 4.7-, 6.2- and 10.5-fold increases in the risk of an estimated glomerular filtration rate (eGFR) ≤ 60 mL/min/1.73 m2, commensurate with CKD [18]. Thus, a cut-off value for an elevation of β2M excretion above 300 μg/g creatinine does not appear to be an early warning sign of the nephrotoxicity of Cd. The utility of β2M excretion as a toxicity criterion to derive a toxicity threshold level for Cd is questionable.
3. Organs Susceptible to Cadmium Toxicity
3.1. Fate of Cadmium in the Body
As Figure 1 depicts, ingested Cd is absorbed by the intestine and transported via the portal blood system to the liver, where its uptake induces the synthesis of metallothionein (MT) and the formation of CdMT complexes [19]. Later, hepatic CdMT is released into the systemic circulation. The fraction of absorbed Cd not taken up by hepatocytes in the first pass reaches systemic circulation and is taken up by tissues and organs throughout the body, including the kidneys, pancreas [20], ovaries [21] and testes [22].
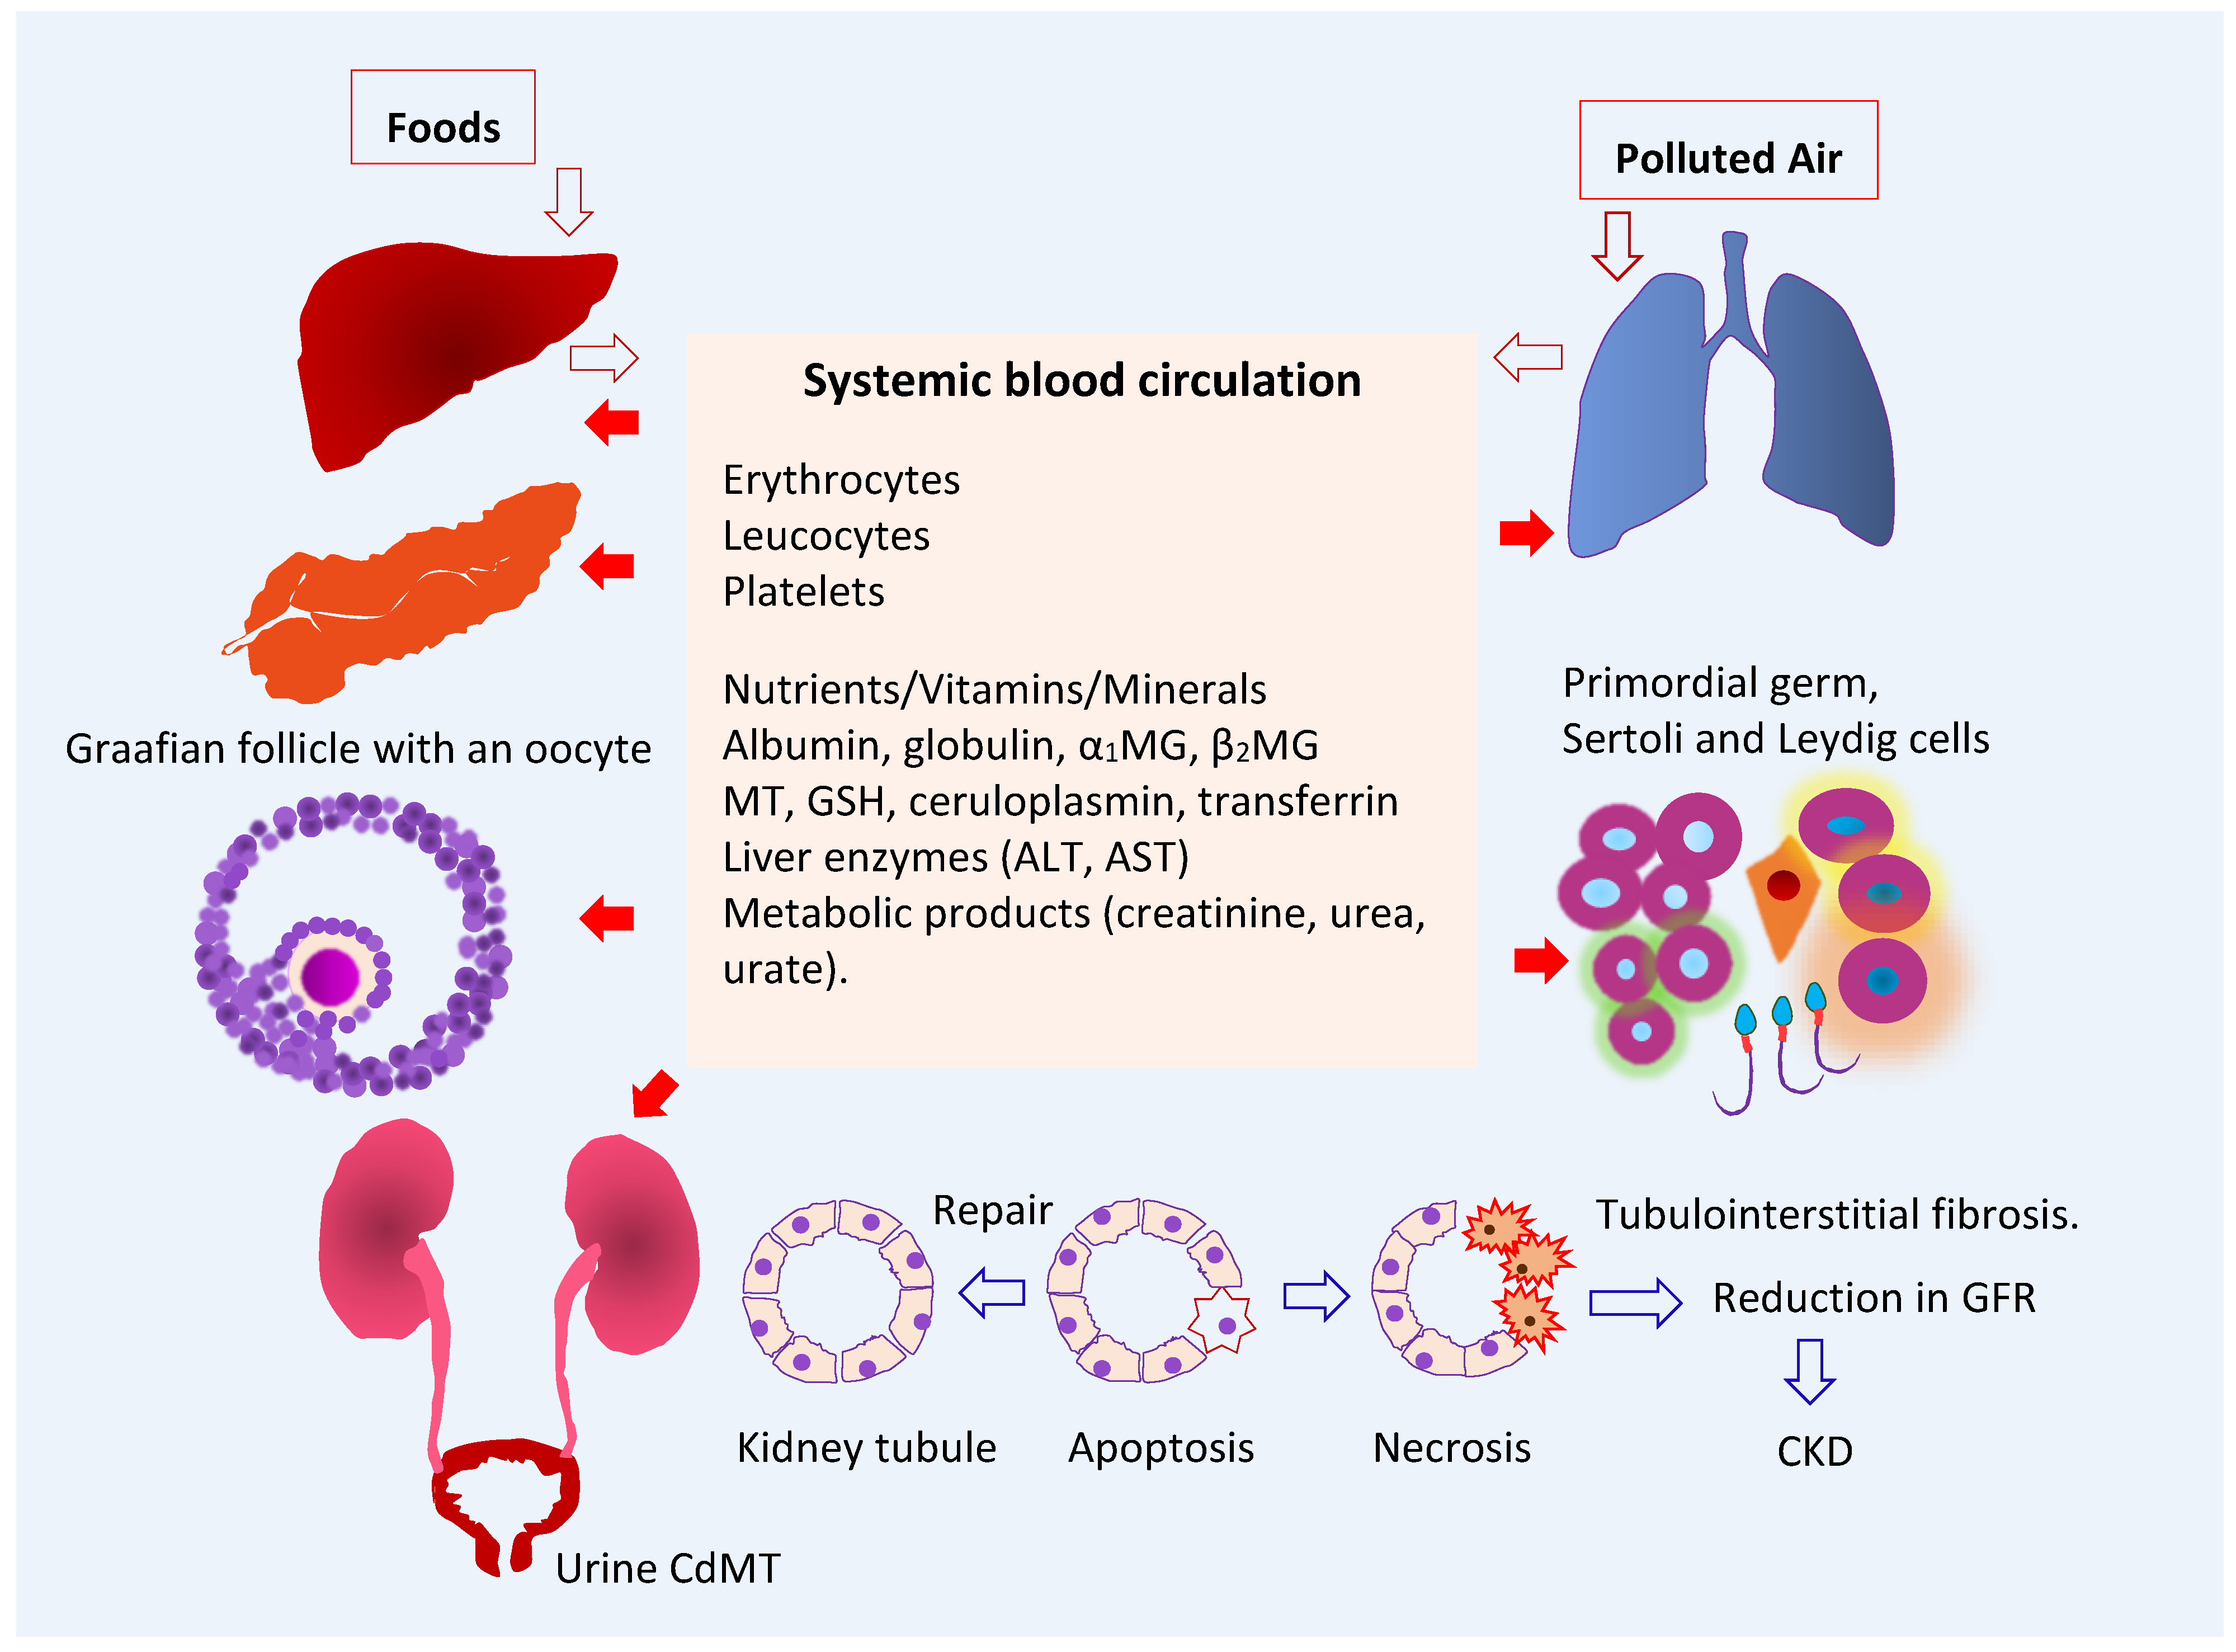
Figure 1. Multiple toxicity targets of cadmium. Ingested Cd is absorbed and transported to liver, where synthesis of MT is induced, and CdMT is formed. The fraction of absorbed Cd not taken up by hepatocytes in the first pass reaches systemic circulation and is taken up and accumulated by cells throughout the body. After glomerular filtration, CdMT is reabsorbed by kidney tubular cells. Other forms of filtered Cd can be reabsorbed by the kidney nephron transporters for iron, zinc, manganese, and calcium. Abbreviations: Cd—cadmium; MT—metallothionein; CdMT—cadmium-metallothionein complex; α1MG—α1-microgloulin; β2MG—β2-microglobulin; GSH—glutathione; ALT—alanine aminotransferase; AST—aspartate aminotransferase; GFR—glomerular filtration rate; CKD—chronic kidney disease.
The liver serves as an endogenous source of Cd2+ ions of dietary origin. From here, they are released and redistributed to kidneys as CdMT. In the circulation, less than 10% of Cd is present in plasma, and the remainder is in erythrocytes, where most Cd in whole blood is found. The whole-blood Cd level is indicative of recent exposure because the average lifespan of erythrocytes is 120 days [23].
In theory, Cd in non-MT forms can be taken up by all nucleated cells because they have the capacity to assimilate all the metals required for normal cellular metabolism and function. However, most cells do not take up CdMT because they lack the requisite mechanisms for protein internalization. Kidney proximal tubular epithelial cells provide an exception to this rule because of their capacity for receptor-mediated endocytosis, which facilitates the reabsorption of virtually all filtered proteins [24][25]. Filtered Cd in non-MT forms may be reabsorbed through many other nephron transporter systems.
3.2. Target Organ Toxicity Identified from U.S. NHANES
As discussed in above contents, an increase in β2M excretion above 300 μg/g creatinine was used as an endpoint in the health-risk assessment of Cd in the human diet, and urinary Cd excretion levels below 5.24 µg Cd/g creatinine were identified as the body burdens that were not associated with a change in β2M excretion [14]. Consequently, renal tubular dysfunction has become the most frequently reported adverse effect of environmental Cd exposure. However, many population-based studies in many countries and the U.S. general population study known as National Health and Nutrition Examination Survey (NHANES) have provided ample evidence that Cd exposure may impact the functions of many organ systems at Cd excretion levels below 5 µg/g creatinine.
NHANES is a cross-sectional study that has provided data on levels of exposure to more than 200 chemicals [26]. Urinary and blood Cd levels were quantified via a standardized methodology that enables the comparison of data across NHANES cycles [26]. The average Cd consumption estimated for the U.S. general population was 4.63 μg/d [27]. This figure was based on 24 h dietary recalls obtained for NHANES 2007–2012 participants aged 2 years and older (n = 12,523), plus the Cd levels of 260 food items in the 2006–2013 market basket surveys [27]. Cereals and bread, leafy vegetables, potatoes, legumes and nuts, stem/root vegetables, and fruits contributed to 34%, 20%, 11%, 7%, and 6% of total intake, respectively. Foods that contain relatively high Cd levels are spaghetti, bread, potatoes, and potato chips which contributed the most to total Cd intake, followed by lettuce, spinach, tomatoes, and beer. Lettuce was a main Cd source for White people and Black people. Tortillas and rice were the main Cd sources for Hispanic Americans and Asians plus other ethnicities [27].
The geometric mean, the 50th, 75th, 90th, and 95th percentile values for urinary Cd levels in the representative U.S. general population were 0.210, 0.208, 0.412, 0.678, and 0.949 µg/g creatinine, and the corresponding values for blood Cd were 0.304, 0.300, 0.500, 1.10, and 1.60 µg/L, respectively [28]. Based on the above figures for dietary exposure and urinary and blood Cd levels, environmental Cd exposure levels in the U.S. could be considered as low.
The urinary excretion of Cd and its blood levels associated with adverse effects on the kidneys [29][30][31][32], liver [33][34][35], and pancreas [36][37][38] are provided in Table 1.
Table 1. Kidney, liver and pancreas as targets of toxicity to chronic exposure to low-dose cadmium.
| Targets | NHANES Dataset | Adverse Effects and Risk Estimate | References |
|---|---|---|---|
| Kidneys | 1999–2006 | Blood Cd levels >1 µg/L were associated with low GFR a (OR 1.48) and albuminuria b (OR 1.41). The OR for albuminuria was increased to 1.63 in those with urinary Cd ≥ 1 µg/g creatinine plus blood Cd > 1 µg/L. |
Ferraro et al. 2010 [29] |
| Kidneys | 1999–2006 | Blood Cd levels ≥ 0.6 μg/L were associated with low GFR (OR 1.32), albuminuria (OR 1.92) and low GFR plus albuminuria (OR 2.91). | Navas-Acien et al. 2009 [30] |
| Kidneys | 2011–2012 | Blood Cd levels ≥ 0.53 μg/L were associated albuminuria (OR 2.04) and low GFR (OR 2.21). | Lin et al. 2014 [31] |
| Kidneys | 2007–2012 | Blood Cd ≥ 0.61 μg/L were associated with low GFR (OR 1.80) and albuminuria (OR 1.60). | Madrigal et al. 2019 [32] |
| Liver | 1988–1994 | Urinary Cd levels ≥ 0.83 μg/g creatinine were associated with liver inflammation in women (OR 1.26). Urinary Cd ≥ 0.65 μg/g creatinine were associated with liver inflammation (OR 2.21), NAFLD (OR 1.30), and NASH (OR 1.95) in men. |
Hyder et al. 2013 [33] |
| Liver | 1999–2015 | A 10-fold increment of urinary Cd was associated with elevated plasma levels of total bilirubin (OR 1.20), ALT (OR 1.36), and AST (OR 1.31). | Hong et al. 2021 [34] |
| Liver | 1999–2016 | A urinary Cd quartile 4 was associated with elevated plasma ALT (OR 1.40) and AST (OR 1.64). The effect was larger in boys than in girls. | Xu et al. 2022 [35] |
| Pancreas | 1988–1994 | Urinary Cd levels 1–2 μg/g creatinine were associated prediabetes (OR 1.48) and diabetes (OR 1.24). |
Schwartz et al. 2003 [36] |
| Pancreas | 2005–2010 | Urinary Cd levels ≥ 1.4 µg/g creatinine were associated with pre-diabetes in non-smokers. In a fully adjusted model including smokers and non-smokers, urinary Cd levels between 0.7 and 0.9 µg/g creatinine were associated with pre-diabetic risk. | Wallia et al. 2014 [37] |
| Pancreas | 1999–2006 | Urinary Cd levels of 0.198 and 0.365 μg/g creatinine were identified as exposure levels at which the prevalence of type 2 diabetes was smaller than 5% and 10%, respectively. | Shi et al. 2021 [38] |
NHANES—National Health and Nutrition Examination Survey; a low GFR is defined as estimated glomerular filtration rate (eGFR) ≤ 60 mL/min/1.73 m2; b albuminuria is defined as urinary albumin-to-creatinine ratio ≥ 30 mg/g. OR—odds ratio; NAFLD—non-alcoholic fatty liver disease; NASH—non-alcoholic steatohepatitis.
The associations between Cd expsoure and reduced eGFR and albuminuria were consistently observed among participants in NHANES cycles undertaken between 1999 and 2016. For liver outcomes, the hepatotoxicity of Cd in children appeared to be more pronounced in boys than girls [35]. In adults, urinary Cd levels ≥ 0.6 µg/g creatinine were associated with an increased risk of liver inflammation, NAFLD, and NASH in adults [33]. In Korean population studies, Cd hepatotoxicity was observed at blood Cd levels of 1–2 µg/L [39][40].
Urinary Cd levels of 1–2 µg/g creatinine were associated with increases in the risks of prediabetes and diabetes among U.S. adults [36][37]. Cd exposure was associated with an elevated risk of diabetes in a community-based study in Dallas, Texas [41]. A risk analysis using data from 4530 adults enrolled in NHANES 1999–2006, of which 10.3% had diabetes. Urinary Cd levels of 0.198 and 0.365 μg/g creatinine were found to be the benchmark dose (BMD) limit5 and BMDL10 for type 2 diabetes [38]. Thus, urinary Cd levels of 0.198 and 0.365 μg/g creatinine were the body burdens at which the prevalence of type 2 diabetes was likely smaller than 5% and 10%, respectively [38]. In a meta-analysis of pooled data from 42 studies, the risks of prediabetes and diabetes increased linearly with blood and urinary Cd; prediabetes risk reached a plateau at a urinary Cd of 2 µg/g creatinine, and the diabetes risk rose as blood Cd reached 1 µg/L [42]. These urinary Cd and blood Cd levels are also in range with those associated with reduced eGFR and albuminuria in studies conducted in the Torres Straits, Australia [43], Thailand [44], and Taiwan [45].
References
- Satarug, S.; Vesey, D.A.; Gobe, G.C. Current health risk assessment practice for dietary cadmium: Data from different countries. Food Chem. Toxicol. 2017, 106, 430–445.
- Satarug, S.; Gobe, G.C.; Vesey, D.A.; Phelps, K.R. Cadmium and lead exposure, nephrotoxicity, and mortality. Toxics 2020, 8, 86.
- Satarug, S.; Phelps, K.R. Cadmium Exposure and Toxicity. In Metal Toxicology Handbook; Bagchi, D., Bagchi, M., Eds.; CRC Press: Boca Raton, FL, USA, 2021; pp. 219–274.
- ATSDR (Agency for Toxic Substances and Disease Registry). Toxicological Profile for Cadmium; Department of Health and Humans Services, Public Health Service, Centers for Disease Control and Prevention: Atlanta, GA, USA, 2012.
- Järup, L. Hazards of heavy metal contamination. Br. Med. Bull. 2003, 68, 167–182.
- Garrett, R.G. Natural sources of metals to the environment. Hum. Ecol. Risk Assess. 2010, 6, 945–963.
- Verbeeck, M.; Salaets, P.; Smolders, E. Trace element concentrations in mineral phosphate fertilizers used in Europe: A balanced survey. Sci. Total Environ. 2020, 712, 136419.
- Zou, M.; Zhou, S.; Zhou, Y.; Jia, Z.; Guo, T.; Wang, J. Cadmium pollution of soil-rice ecosystems in rice cultivation dominated regions in China: A review. Environ. Pollut. 2021, 280, 116965.
- McDowell, R.W.; Gray, C.W. Do soil cadmium concentrations decline after phosphate fertiliser application is stopped: A comparison of long-term pasture trials in New Zealand? Sci. Total Environ. 2022, 804, 150047.
- Egan, S.K.; Bolger, P.M.; Carrington, C.D. Update of US FDA’s Total Diet Study food list and diets. J. Expo. Sci. Environ. Epidemiol. 2007, 17, 573–582.
- Callan, A.; Hinwood, A.; Devine, A. Metals in commonly eaten groceries in Western Australia: A market basket survey and dietary assessment. Food Addit. Contam. Part A 2014, 31, 1968–1981.
- Aoshima, K. Epidemiology of renal tubular dysfunction in the inhabitants of a cadmium-polluted area in the Jinzu River basin in Toyama Prefecture. Tohoku J. Exp. Med. 1987, 152, 151–172.
- Horiguchi, H.; Aoshima, K.; Oguma, E.; Sasaki, S.; Miyamoto, K.; Hosoi, Y.; Katoh, T.; Kayama, F. Latest status of cadmium accumulation and its effects on kidneys, bone, and erythropoiesis in inhabitants of the formerly cadmium-polluted Jinzu River Basin in Toyama, Japan, after restoration of rice paddies. Int. Arch. Occup. Environ. Health 2010, 83, 953–970.
- JECFA. Joint FAO/WHO Expert Committee on Food Additives, Seventy-third Meeting, Geneva, 8–17 June 2010. Summary and Conclusions. JECFA/73/SC. Geneva, Switzerland: Food and Agriculture Organization of the United Nations; World Health Organization. Available online: http://www.who.int/foodsafety/publications/chem/summary73.pdf (accessed on 20 July 2022).
- EFSA. European Food Safety Agency, Statement on tolerable weekly intake for cadmium. EFSA J. 2011, 9, 1975.
- Wong, C.; Roberts, S.M.; Saab, I.N. Review of regulatory reference values and background levels for heavy metals in the human diet. Regul. Toxicol. Pharmacol. 2022, 130, 105122.
- Moffett, D.B.; Mumtaz, M.M.; Sullivan, D.W., Jr.; Whittaker, M.H. Chapter 13, General Considerations of Dose-Effect and Dose-Response Relationships. In Handbook on the Toxicology of Metals (Fifth Edition), Volume I: General Considerations; Nordberg, G., Costa, M., Eds.; Academic Press: Cambridge, MA, USA, 2022; pp. 299–317.
- Satarug, S.; Vesey, D.A.; Nishijo, M.; Ruangyuttikarn, W.; Gobe, G.C. The inverse association of glomerular function and urinary β2-MG excretion and its implications for cadmium health risk assessment. Environ. Res. 2019, 173, 40–47.
- Sabolić, I.; Breljak, D.; Skarica, M.; Herak-Kramberger, C.M. Role of metallothionein in cadmium traffic and toxicity in kidneys and other mammalian organs. Biometals 2010, 23, 897–926.
- El Muayed, M.; Raja, M.R.; Zhang, X.; MacRenaris, K.W.; Bhatt, S.; Chen, X.; Urbanek, M.; O’Halloran, T.V.; Lowe, W.L., Jr. Accumulation of cadmium in insulin-producing β cells. Islets 2012, 4, 405–416.
- Varga, B.; Zsolnai, B.; Paksy, K.; Náray, M.; Ungváry, G. Age dependent accumulation of cadmium in the human ovary. Reprod. Toxicol. 1993, 7, 225–228.
- Oldereid, N.B.; Thomassen, Y.; Attramadal, A.; Olaisen, B.; Purvis, K. Concentrations of lead, cadmium and zinc in the tissues of reproductive organs of men. J. Reprod. Fertil. 1993, 99, 421–425.
- Järup, L.; Rogenfelt, A.; Elinder, C.G.; Nogawa, K.; Kjellström, T. Biological half-time of cadmium in the blood of workers after cessation of exposure. Scand. J. Work Environ. Health 1983, 9, 327–331.
- Christensen, E.I.; Birn, H.; Storm, T.; Weyer, K.; Nielsen, R. Endocytic receptors in the renal proximal tubule. Physiology 2012, 27, 223–236.
- Nielsen, R.; Christensen, E.I.; Birn, H. Megalin and cubilin in proximal tubule protein reabsorption: From experimental models to human disease. Kidney Int. 2016, 89, 58–67.
- Calafat, A.M. The U.S. National Health and Nutrition Examination Survey and human exposure to environmental chemicals. Int. J. Hyg. Environ. Health 2012, 215, 99–101.
- Kim, K.; Melough, M.M.; Vance, T.M.; Noh, H.; Koo, S.I.; Chun, O.K. Dietary cadmium intake and sources in the US. Nutrients 2018, 11, 2.
- Crinnion, W.J. The CDC fourth national report on human exposure to environmental chemicals: What it tells us about our toxic burden and how it assists environmental medicine physicians. Altern. Med. Rev. 2010, 15, 101–108.
- Ferraro, P.M.; Costanzi, S.; Naticchia, A.; Sturniolo, A.; Gambaro, G. Low level exposure to cadmium increases the risk of chronic kidney disease: Analysis of the NHANES 1999–2006. BMC Public Health 2010, 10, 304.
- Navas-Acien, A.; Tellez-Plaza, M.; Guallar, E.; Muntner, P.; Silbergeld, E.; Jaar, B.; Weaver, V. Blood cadmium and lead and chronic kidney disease in US adults: A joint analysis. Am. J. Epidemiol. 2009, 170, 1156–1164.
- Lin, Y.S.; Ho, W.C.; Caffrey, J.L.; Sonawane, B. Low serum zinc is associated with elevated risk of cadmium nephrotoxicity. Environ. Res. 2014, 134, 33–38.
- Madrigal, J.M.; Ricardo, A.C.; Persky, V.; Turyk, M. Associations between blood cadmium concentration and kidney function in the U.S. population: Impact of sex, diabetes and hypertension. Environ. Res. 2018, 169, 180–188.
- Hyder, O.; Chung, M.; Cosgrove, D.; Herman, J.M.; Li, Z.; Firoozmand, A.; Gurakar, A.; Koteish, A.; Pawlik, T.M. Cadmium exposure and liver disease among US adults. J. Gastrointest. Surg. 2013, 17, 1265–1273.
- Hong, D.; Min, J.Y.; Min, K.B. Association between cadmium exposure and liver function in adults in the United States: A Cross-sectional study. J. Prev. Med. Public Health 2021, 54, 471–480.
- Xu, Z.; Weng, Z.; Liang, J.; Liu, Q.; Zhang, X.; Xu, J.; Xu, C.; Gu, A. Association between urinary cadmium concentrations and liver function in adolescents. Environ. Sci. Pollut. Res. Int. 2022, 29, 39768–39776.
- Schwartz, G.G.; Il’yasova, D.; Ivanova, A. Urinary cadmium, impaired fasting glucose, and diabetes in the NHANES III. Diabetes Care 2003, 26, 468–470.
- Wallia, A.; Allen, N.B.; Badon, S.; El Muayed, M. Association between urinary cadmium levels and prediabetes in the NHANES 2005–2010 population. Int. J. Hyg. Environ. Health 2014, 217, 854–860.
- Shi, P.; Yan, H.; Fan, X.; Xi, S. A benchmark dose analysis for urinary cadmium and type 2 diabetes mellitus. Environ. Pollut. 2021, 273, 116519.
- Kang, M.-Y.; Cho, S.-H.; Lim, Y.-H.; Seo, J.-C.; Hong, Y.-C. Effects of environmental cadmium exposure on liver function in adults. Occup. Environ. Med. 2013, 70, 268–273.
- Park, E.; Kim, J.; Kim, B.; Park, E.Y. Association between environmental exposure to cadmium and risk of suspected non-alcoholic fatty liver disease. Chemosphere 2021, 266, 128947.
- Little, B.B.; Reilly, R.; Walsh, B.; Vu, G.T. Cadmium is associated with type 2 diabetes in a Superfund Site Lead Smelter Community in Dallas, Texas. Int. J. Environ. Res. Public Health 2020, 17, 4558.
- Filippini, T.; Wise, L.A.; Vinceti, M. Cadmium exposure and risk of diabetes and prediabetes: A systematic review and dose-response meta-analysis. Environ. Int. 2022, 158, 106920.
- Haswell-Elkins, M.; Satarug, S.; O’Rourke, P.; Moore, M.; Ng, J.; McGrath, V.; Walmby, M. Striking association between urinary cadmium level and albuminuria among Torres Strait Islander people with diabetes. Environ. Res. 2008, 106, 379–383.
- Yimthiang, S.; Pouyfung, P.; Khamphaya, T.; Kuraeiad, S.; Wongrith, P.; Vesey, D.A.; Gobe, G.C.; Satarug, S. Effects of environmental exposure to cadmium and lead on the risks of diabetes and kidney dysfunction. Int. J. Environ. Res. Public Health 2022, 19, 2259.
- Tsai, K.F.; Hsu, P.C.; Lee, C.T.; Kung, C.T.; Chang, Y.C.; Fu, L.M.; Ou, Y.C.; Lan, K.C.; Yen, T.H.; Lee, W.C. Association between enzyme-linked immunosorbent assay-measured kidney injury markers and urinary cadmium levels in chronic kidney disease. J. Clin. Med. 2021, 11, 156.
More
Information
Subjects:
Toxicology
Contributors
MDPI registered users' name will be linked to their SciProfiles pages. To register with us, please refer to https://encyclopedia.pub/register
:
View Times:
1.5K
Revisions:
2 times
(View History)
Update Date:
01 Sep 2022
Table of Contents


Notice
You are not a member of the advisory board for this topic. If you want to update advisory board member profile, please contact office@encyclopedia.pub.
OK
Confirm
Only members of the Encyclopedia advisory board for this topic are allowed to note entries. Would you like to become an advisory board member of the Encyclopedia?
Yes
No
${ textCharacter }/${ maxCharacter }
Submit
Cancel
Back
Comments
${ item }
|
${ item.createdUser.fullName }
${ item.createdAt }
${ item.vote }
${ item.reply }
Delete
${ reply.createdUser.fullName }
${ reply.createdAt }
${ reply.vote }
Delete
There is no reply to this comment~
${ item.replyTextCharacter }/${ item.replyMaxCharacter }
Submit
Cancel
More
No more~
There is no comment~
${ textCharacter }/${ maxCharacter }
Submit
Cancel
${ selectedItem.replyTextCharacter }/${ selectedItem.replyMaxCharacter }
Submit
Cancel
Confirm
Are you sure to Delete?
Yes
No