Your browser does not fully support modern features. Please upgrade for a smoother experience.
Submitted Successfully!
 +1 credit
Thank you for your contribution! You can also upload a video entry or images related to this topic.
For video creation, please contact our Academic Video Service.
| Version | Summary | Created by | Modification | Content Size | Created at | Operation |
|---|---|---|---|---|---|---|
| 1 | Andrew Clayton | -- | 2259 | 2022-08-25 02:15:55 | | | |
| 2 | Conner Chen | + 3 word(s) | 2262 | 2022-08-25 03:12:06 | | |
Video Upload Options
We provide professional Academic Video Service to translate complex research into visually appealing presentations. Would you like to try it?
Cite
If you have any further questions, please contact Encyclopedia Editorial Office.
Kabir, M.L.; Wang, F.; Clayton, A.H.A. Intrinsically Fluorescent Anti-Cancer Drugs. Encyclopedia. Available online: https://encyclopedia.pub/entry/26465 (accessed on 12 June 2026).
Kabir ML, Wang F, Clayton AHA. Intrinsically Fluorescent Anti-Cancer Drugs. Encyclopedia. Available at: https://encyclopedia.pub/entry/26465. Accessed June 12, 2026.
Kabir, Md. Lutful, Feng Wang, Andrew H. A. Clayton. "Intrinsically Fluorescent Anti-Cancer Drugs" Encyclopedia, https://encyclopedia.pub/entry/26465 (accessed June 12, 2026).
Kabir, M.L., Wang, F., & Clayton, A.H.A. (2022, August 25). Intrinsically Fluorescent Anti-Cancer Drugs. In Encyclopedia. https://encyclopedia.pub/entry/26465
Kabir, Md. Lutful, et al. "Intrinsically Fluorescent Anti-Cancer Drugs." Encyclopedia. Web. 25 August, 2022.
Copy Citation
About one-third of the total protein targets in the pharmaceutical research sector are kinase-based. While kinases have been attractive targets to combat many diseases, including cancer, selective kinase inhibition has been challenging, because of the high degree of structural homology in the active site where many kinase inhibitors bind. Spectroscopic approaches such as infrared, Raman, NMR and fluorescence have the potential to provide significant insights into drug-target and drug-non-target interactions because of sensitivity to molecular environment.
cancer
anti-cancer drugs
tyrosine kinase
1. What Is Fluorescence?
In order for people to appreciate intrinsically fluorescent anti-cancer drugs, the reader is first introduced to the basics of fluorescence itself [1]. Fluorescence, a form of luminescence that can occur either in gas, liquid or solid chemical systems, is the emission of electromagnetic radiation, usually visible light, by a material that has absorbed light or other electromagnetic radiation. In the case of fluorescence, as shown in Figure 1a, the emitted light has a longer wavelength, i.e., lower photon energy compared to the absorbed radiation. This difference in wavelength between the positions of those band maxima is called the Stokes shift.
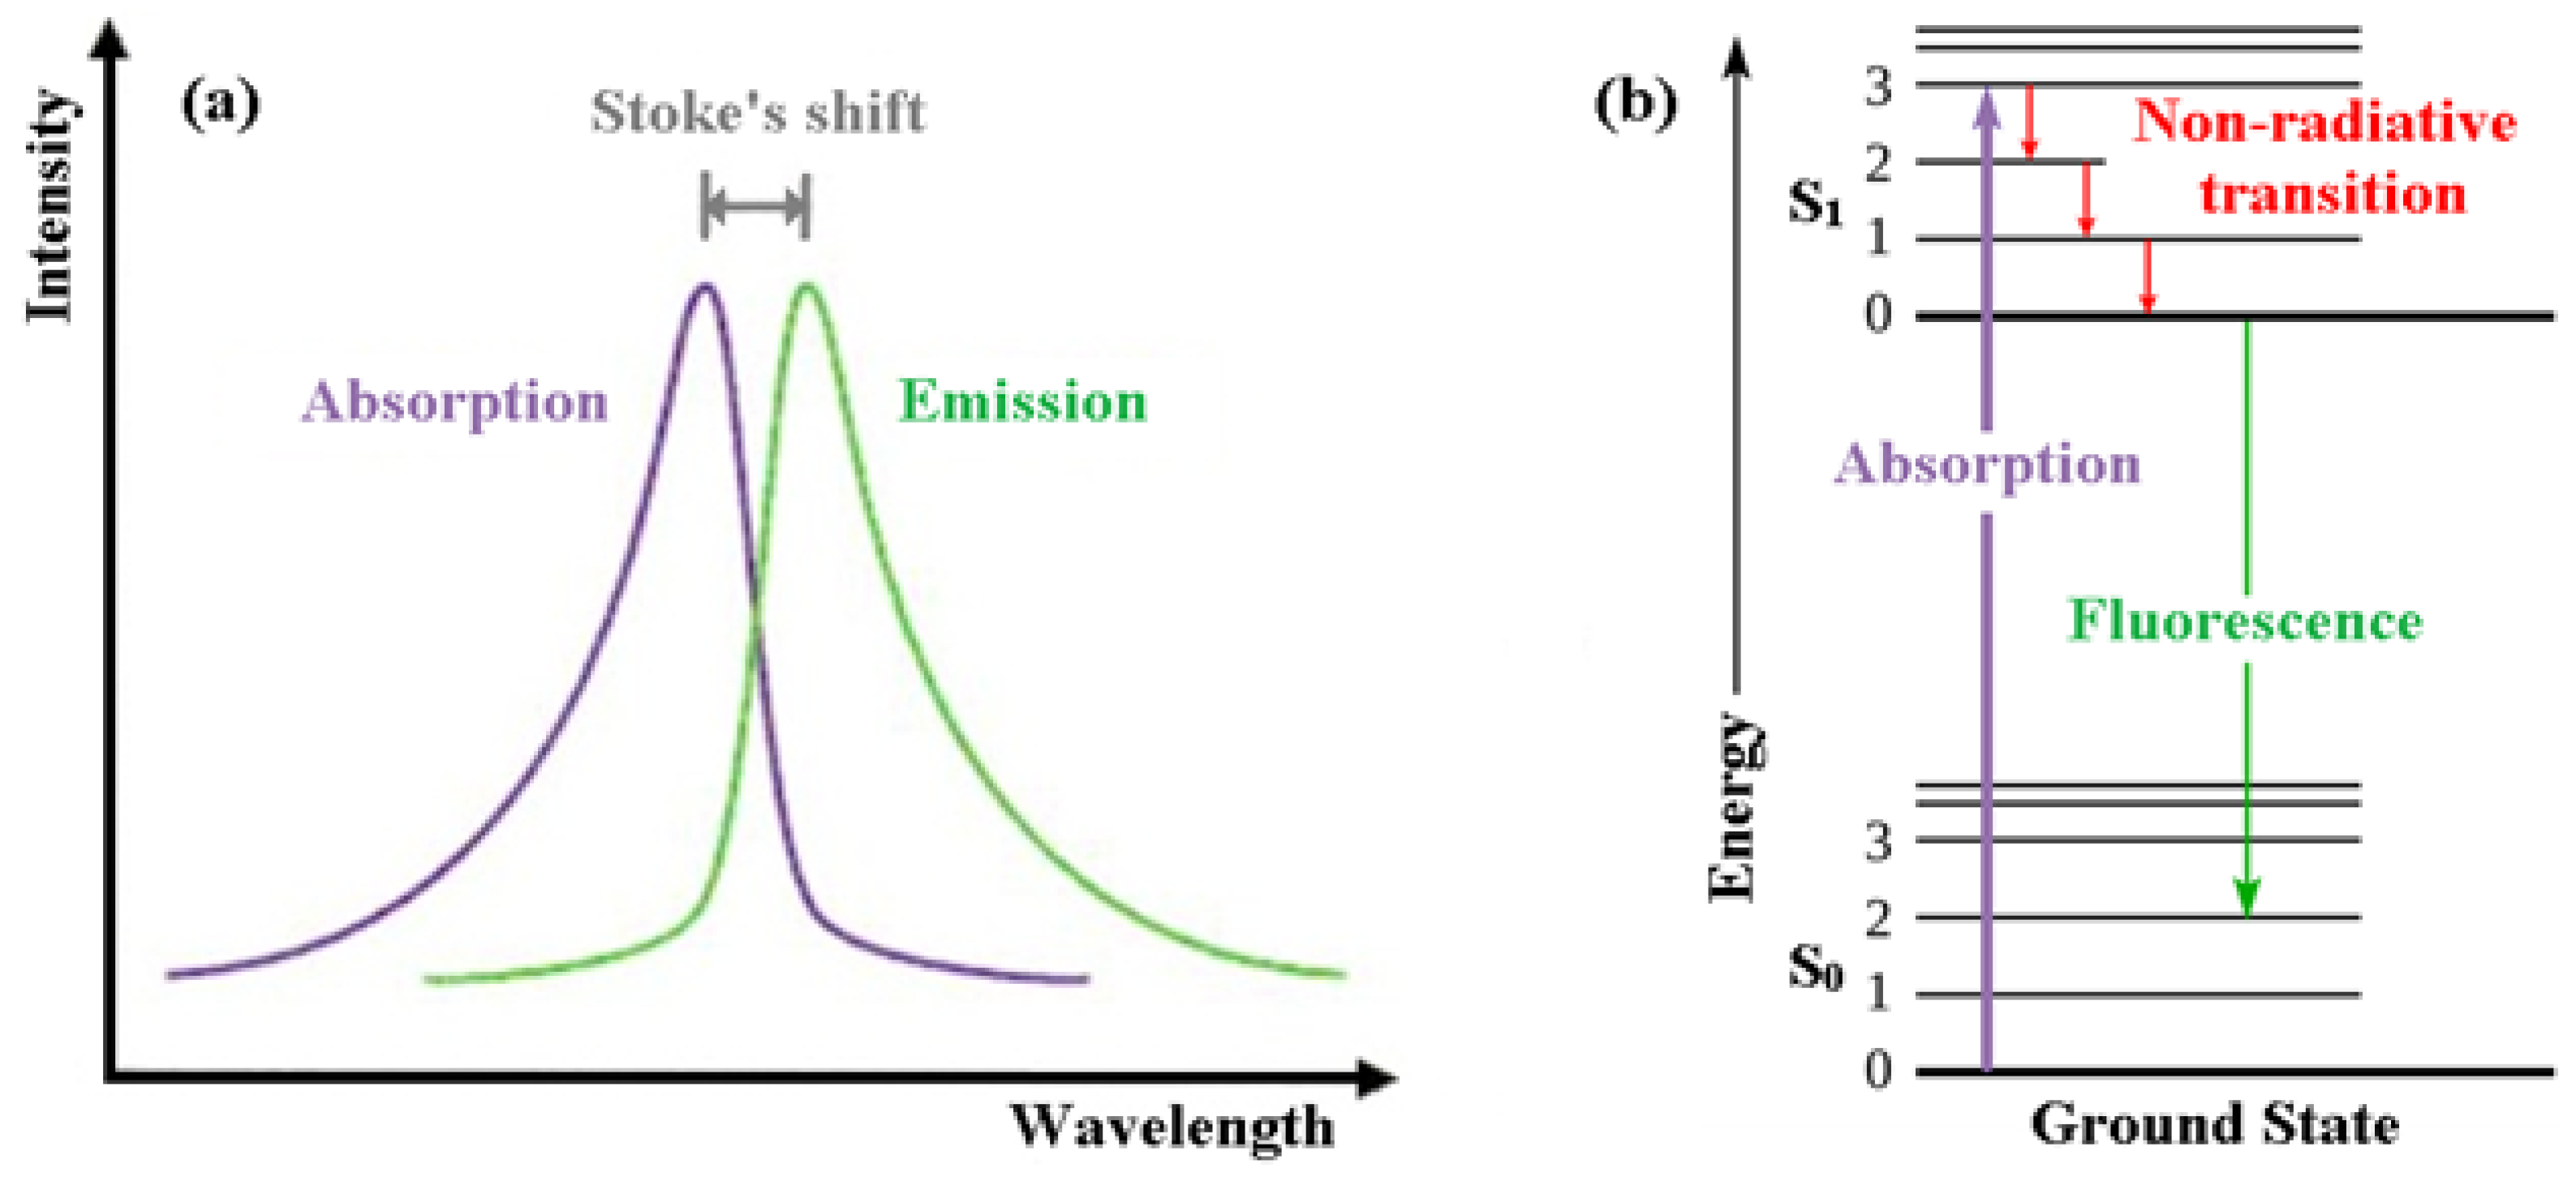
Figure 1. (a) Emission intensity vs. wavelength plot. (b) Jablonski energy diagram for absorption and fluorescence.
The mechanism of fluorescence can be explained with the help of the Jablonski energy diagram (Figure 1b). The upward violet arrow represents the absorption of a photon in the singlet electronic ground state (So), causing a promotion of an electron to the singlet excited electronic state, S1. The downward red arrows denote vibrational relaxation from vibrationally excited states within the S1 manifold. This is a non-radiative relaxation process (i.e., no photon is emitted) in this case because the excitation energy is dispersed as vibrations or heat to the solvent. The downward green arrow denotes the fluorescence process from S1 to S0.
Note that because fluorescence occurs from the lowest vibrational level of the excited-state (S1) to higher vibrational levels of the ground-state (S0), the emission maximum of the fluorescence spectrum is always at lower energy (longer wavelength) than the excitation.
The quantum yield is an important parameter in fluorescence and its sensitivity to environment forms the basis for assays for detecting drug binding to drug targets. The quantum yield is defined as the number of photons emitted per photon absorbed and is in the range of 0 to 1. The quantum yield is determined by the relative rates of non-radiative and radiative processes that deplete the excited state. Radiative and non-radiative rates can be very dependent on environment, such as the binding sites of drug targets, so drug binding can be accompanied by large changes in quantum yield (or equivalently changes in amplitude of the fluorescence spectrum).
Another important fluorescence parameter is called the fluorescence lifetime. The fluorescence lifetime is the average time a molecule spends in the excited state. In contrast to quantum yield, which is related to relative rates of processes, the fluorescence lifetime is defined as the reciprocal of the sum of all the rates of processes depleting the excited state. Typical fluorescence lifetimes are in the range of 1–10 ns.
The finite lifetime of the excited state means that fluorescence can be sensitive to molecular structure and dynamics in the vicinity of the fluorophore. Myriad processes can occur during the excited state including rotation, collisions with other molecules, or a change in structure or conformation and environmental (solvent) relaxation.
Solutions containing the fluorophore are normally studied with a special spectrometer called a fluorometer, usually with a single exciting wavelength and variable detection wavelength (scanned to create a fluorescence spectrum). Because of the sensitivity that the method affords, fluorescent molecule concentrations as low as the nanomolar level can be measured [1]. Fluorescence in several wavelengths can be detected by an array detector, to detect compounds from high performance liquid chromatography (HPLC) flow. Thin layer chromatography (TLC) plates can also be visualized if the compounds or a coloring reagent is fluorescent. For visualizing fluorescence in cells, one uses a fluorescence microscope.
Molecular structure and chemical environment affect whether or not a substance undergoes fluorescence. When fluorescence does occur, molecular structure and local environment determine the color and intensity of emission. Hence, fluorescence can be used to investigate binding affinities, binding mechanisms, properties (i.e., polarity) of the binding site on the protein and binding kinetics. Another example is the effects of solvent on the structure and spectroscopic behavior of a fluorophore. Generally, solvatochromism is observed due to the differential solvation of the ground and excited states of a fluorophore. It was found that the optical spectroscopic measurements of a fluorophore can be influenced by the change in physicochemical properties of the surrounding medium. Solvatochromism is the term used to define this phenomenon and firstly introduced by Hantzschlater. The change in compound absorption/emission spectrum is manifested by one or more alternations in the band position, intensity or shape [2][3][4]. The hypsochromic (blue) shift of the fluorescence band relative to the absorption band is commonly known as negative solvatochromism. While positive solvatochromism is the term given for the bathochromic (red) shift of the fluorescence band [5], in negative solvatochromism, the molecule in its ground state is more stabilized than in the excited state upon increasing solvent polarity. When the excited state is more stabilized than the ground state, it results in a positive solvatochromism [5].
Generally, molecules that fluoresce are conjugated systems. Since most of the tyrosine kinase inhibitors are small aromatic molecules, their extended conjugation and ionizable groups render them good candidates for intrinsically fluorescent anti-cancer drugs.
2. Quinazoline-Based TKI
Quinazoline is one of the most widespread scaffolds among natural and synthetic bioactive compounds. Quinazoline scaffold resembles both the purine nucleus and the pteridine one. As a consequence, some compounds able to inhibit the purinic [6] or the folic acid [7] metabolic pathways have been discovered. Over the past few decades, the therapeutic potential of quinazoline derivatives has been found as different types of anticancer agents such as protein kinase inhibitors, tubulin polymerization inhibitors, protein lysine methyltransferase inhibitors, topoisomerase I inhibitors, PI3K/Akt/mTOR inhibitors, poly(ADP-ribose)polymerase-1 (PARP-1) inhibitors etc. [8]. Quinazoline ring is very commonly found in all types of tyrosine kinase inhibitors (TKIs) [9]. In general, quinazoline derivatives are known to possess a wide range of activities. A specific activity depends on the substituent present at an appropriate position of quinazoline.
For designing TKIs, 4-anilinoquinazolines found to be potent selective inhibitors [10]. The 4-anilinoquinazoline scaffold, i.e., the quinazoline core and N-aryl arm, together, form established ErbB/EGFR (epidermal growth factor receptor) pharmacophore and used in type I (e.g., Gefitinib), type II (e.g., Lapatinib) and covalent inhibitors (e.g., Dacomitinib). This pharmacophore N-aryl arm is oriented deep for binding to the adenosine triphosphate (ATP) nucleotide pocket [11]. The introduction of strong electron-donating or -withdrawing groups to the tail section being projected into the solvent produces donor–acceptor systems that are extremely sensitive to solvent polarity. The first- and second-generation EGFR–TKIs both have aniline-quinazoline structures. However, the second-generation TKIs also have an acrylamide group at 6 position of quinazoline ring, which serves as a chemically reactive electrophile called a Michael acceptor [12] that targets a cysteine nucleophile (Cys-797), resulting in a covalent adduct. Importance of fluorophore arm and pharmacophore arm of the 4-aminoquinazolines is well documented by J. Dhuguru et al. [11].
3. Basic Fluorescence Spectroscopy of TKIs
Solvatochromism is commonly used in many research aspects to characterize the nature of bulk environment [13]. Studying solvent effects on a fluorophore is commonly utilized to estimate the photophysical properties of a fluorophore. Fluorophore interaction with its environment can be triggered through specific interactions between fluorophore and solvent molecules, e.g., H-bond formation and non-specific interactions. Electrostatic interactions, driven by the change in solvent dipole moment, refractive index, relative permittivity (or dielectric constant), polarizability and viscosity, can induce a significant change in fluorophore electronic configuration and spectrum [14].
A number of empirical solvent models have been developed for the solvatochromic analysis of organic molecules. Linear solvation energy relationship (LSER) models have been proven to reliably define the interactions between solute and solvent molecules. Models developed by Bilot–Kawski [15] Lippert-Abboud–Mataga (L–M) [16][17], Bakhshiev [18] and Kawski–Chamma–Viallet [19] are among the most commonly used LSER models for solvatochromism analysis.
A summary of selected spectroscopic properties of TKI’s is collected in Table 1 [20][21][22][23][24][25][26][27][28][29][30][31][32][33][34][35].
Table 1. Spectroscopic properties of selected kinase inhibitors.
| Drug (Intended Target) | Absorbance Max (nm) | Fluorescence Max (nm) |
|---|---|---|
| Sorafenib (Raf kinase) | (DCM/ACN) 1 264 nm | 487 nm [28][29] |
| Gefitinib (EGFR) | n-hexane (332 nm, 344 nm) | 368 nm, RI 7 = 1 [21][22] |
| Gefitinib (EGFR) | Benzene (332 nm, 340 nm) | 446 nm RI = 0.3 [21][22] |
| Gefitinib (EGFR) | n-octanol (334 nm, 344 nm) | 390–450 nm RI = 0.07 [21][22] |
| Gefitinib (EGFR) | Water (330 nm) | Non-fluorescent |
| Gefitinib (EGFR) | HSA (not reported) | 378 nm [21][22] |
| Erlotinib (EGFR) | n-hexane (332 nm, 344 nm) | 372 nm RI = 1 [22][23] |
| Erlotinib (EGFR) | Benzene (336 nm, 346 nm) | 423 nm RI = 0.38 [22][23] |
| Erlotinib (EGFR) | n-octanol (336 nm, 346 nm) | 400–470 nm RI = 0.07 [22][23] |
| Erlotinib (EGFR) | Water (332 nm) | Non-fluorescent [22][23] |
| Erlotinib (EGFR) | HAS 2 (336 nm, 347 nm) | 380–400 nm [22][23] |
| Lapatinib (EGFR, HER2) | THF 3 (380 nm) | 475 nm [24] |
| Lapatinib (EGFR, HER2) | Methanol (367 nm) | Non-fluorescent |
| Lapatinib (EGFR, HER2) | BSA 4 (361 nm) | 423 nm QY 8 = 0.07 [24][25] |
| Lapatinib (EGFR, HER2) | ErBB2 (368 nm) | 445 nm QY = 0.30 [24][25] |
| Lapatinib (EGFR, HER2) | Aggregates (371 nm) | 464 nm QY = 0.04 [24][25] |
| Afatinib | Methanol (246 nm, 340nm) | Not reported [32][33] |
| Imatinib (Abl kinase) | Water (281 nm) | 307nm [26][27] |
| Dacomitinib (mutated EGFR) | DMSO 5 (343 nm) | 500 nm 9 [30][31] |
| Nintedanib | PBS 6/DMSO (390 nm) | 482 nm [34][35] |
| Bosutinib (Abl kinase) | 350 nm | 480 nm [20] |
1 DCM/CAN is dichloromethane/acetontrile; 2 HSA is human serum albumin; 3 THF is tetrahydrofuran; 4 BSA is bovine serum albumin; 5 DMSO is dimethylsulphoxide; 6 PBS is phosphate-buffered saline; 7 RI indicates relative intensity; 8 QY = fluorescence quantum yield; 9 personal communication MD Lutful Kabir, Swinburne University.
The spectroscopy properties depend on the type of drug and also the solvent in which the spectrum is measured. In general, for all of the drugs listed, the absorption transitions all occur in the ultraviolet region of the spectrum. The emission spectra are somewhat more sensitive to drug type and particularly sensitive to environment. Specific examples are illustrated below.
Khattab et al. [36] have carried out a detailed examination of the absorption and fluorescence spectra of AG1478 in twenty-one solvents of different polarity and hydrogen-bonding strength. Solvatochromic analyses using different solvent models was undertaken to investigate the potential of AG1478 as a fluorescent reporter of its own environment. Fluorescence spectral analyses showed that hydrogen bonding from the solvent to AG1478 plays important role in solvatochromism, showing synergistic effect with solvent polarity in stabilizing the excited state. Fluorescence quantum yields were found to be influenced by solvent H-bond donor ability, being higher in aprotic than in protic solvents. Their work underscores the importance of polarity and hydrogen bonding environment on the spectroscopic properties of AG-1478 as well as helps in understanding the interaction of AG-1478 in vitro and in vivo. Moreover, AG-1478 shares the same molecular scaffold with the commercial anti-cancer drugs Erlotinib and Gefitinib [37][38].
Water molecules are frequently found in protein binding sites and can be important determinants for drug–protein intermolecular interactions and stability. Therefore, binding interactions between explicit water molecules and TKI may influence the nature and diversity of drug chemical structures and properties. To better understand the importance of hydration bonding and the specific solvation by water molecules, Khattab et al. [39] used fluorescence spectroscopy in acetonitrile–water solutions. A significant quenching of the AG1478 fluorescence with added water was observed and attributed to the formation of specific complexes between AG1478 and water molecules. Using a combination of computational chemistry with the spectroscopic measurements, the authors identified three potential sites for H-bond formation between AG1478 and water molecules. The computational models predicted that the extent of hydrogen bonding to the drug affected the distribution of twisted and planar drug conformations. A possible but yet to be further proven explanation of the water-induced fluorescence quenching is that the water induces a twisted form of the drug, which is non-fluorescent. The environmental sensitivity of some of these drugs makes them useful reporters when applied to drug–protein complexes. For example, fluorescence when applied to drug–protein complexes can be used (in combination with computational chemistry) to infer drug conformation (from the fluorescence excitation spectrum) and deduce the polarity of the binding site (the fluorescence emission spectrum).
4. Fluorescence Binding Assay
Fluorescence spectroscopy is a sensitive approach for measuring inhibitor binding interactions with proteins, membranes and DNA. A given change in inhibitor fluorescence intensity (or emission color) upon binding affords a convenient method for quantifying inhibitor binding, which can be used to measure the binding constants of a TKI inhibitor bound to a protein, membrane or DNA [1]. The way in which the binding assay can be employed is as follows. First, the fluorescence (spectrum or intensity at fixed emission wavelength) from the free drug in solution is measured. Then, the binding partner is titrated into the solution and the fluorescence is subsequently measured. Because DNA, proteins and lipids do not absorb light at the excitation wavelength typically used to excite inhibitors, only the emissions from the inhibitor (in free and bound states) are being recorded. Provided the inhibitor concentration is kept constant during the titration and the partner molecule concentration is increased, inhibitor binding will be detected by a change in the fluorescence (increase or decrease). A plot of the fluorescence as a function of the concentration of added molecular partner is called a binding curve. The binding curve can then be analyzed by various models to determine equilibrium binding constants. Another approach to binding uses a phenomenon called fluorescence polarization or anisotropy [40][41]. This assay measures the rotational diffusion of a small probe attached or intrinsic to the drug. Binding to the larger protein, slows down the rotational diffusion and causes an increase in the polarization of the emission from the drug. Conversely competition assays with unlabeled drug, cause a decrease in polarization due to release of the fluorescent drug. The latter approach is very amenable to a high throughput screening approach.
References
- Lakowicz, J.R. Principles of Fluorescence Spectroscopy; Springer: New York, NY, USA, 2006; 954p.
- Rye, H.S.; Dabora, J.M.; Quesada, M.A.; Mathies, R.A.; Glazer, A.N. Fluorometric assay using dimeric dyes for double- and single-stranded DNA and RNA with picogram sensitivity. Anal. Biochem. 1993, 208, 144–150.
- Ungnade, H.E. The Effect of Solvents on the Absorption Spectra of Aromatic Compounds. J. Am. Chem. Soc. 1953, 75, 432–434.
- Novaki, L.P.; El Seoud, O.A. Solvatochromism in aqueous micellar solutions: Effects of the molecular structures of solvatochromic probes and cationic surfactants. Phys. Chem. Chem. Phys. 1999, 1, 1957–1964.
- Matsui, M.; Yamamoto, T.; Kakitani, K.; Biradar, S.; Kubota, Y.; Funabiki, K. UV–vis absorption and fluorescence spectra, solvatochromism, and application to pH sensors of novel xanthene dyes having thienyl and thienothienyl rings as auxochrome. Dye. Pigment. 2017, 139, 533–540.
- Reichardt, C. Solvatochromic dyes as solvent polarity indicators. Chem. Rev. 1994, 94, 2319–2358.
- Dempcy, R.O.; Skibo, E.B. Rational Design of Quinazoline-Based Irreversible Inhibitors of Human Erythrocyte Purine Nucleoside Phosphorylase. Biochemistry 1991, 30, 8480–8487.
- Davoll, J.; Johnson, A.M. Quinazoline Analogues of Folic Acid. J. Chem. Soc. 1970, 8, 997–1002.
- Shagufta; Ahmad, I. An insight into the therapeutic potential of quinazoline derivatives as anticancer agents. Medchemcomm 2017, 8, 871–885.
- Shagufta, S.; Ahmad, I. Recent advancements of 4-aminoquinazoline derivatives as kinase inhibitors and their applications in medicinal chemistry. Eur. J. Med. Chem. 2019, 170, 55–72.
- Al-Obeidi, F.A.; Lam, K.S. Development of inhibitors for protein tyrosine kinases. Oncogene 2000, 19, 5690–5701.
- Ismail, R.S.; Ismail, N.S.; Abuserii, S.; Abou El Ella, D.A. Recent advances in 4-aminoquinazoline based scaffold derivatives targeting EGFR kinases as anticancer agents. Futur. J. Pharm. Sci. 2016, 2, 9–19.
- Johansson, M.H. Reversible Michael Additions: Covalent Inhibitors and Prodrugs. Mini-Rev. Med. Chem. 2012, 12, 1330–1344.
- Marini, A.; Muñoz-Losa, A.; Biancardi, A.; Mennucci, B. What is solvatochromism? J. Phys. Chem. B 2010, 17128–17135.
- Bilot, V.L.; Kawski, A. Zur Theorie des Einflusses von Lösungsmitteln auf die Elektronenspektren der Moleküle. Z. Naturforsch. A 1962, 17, 621–627.
- Lippert, E. Habilitationsschrift Zur Erlangung Der Lehrberichtigung (Venia Legendi) Fur Das Fach Physikalische Chemie Ander Techischen-Hochschule-Stuttgart—Spektroskopische Bestimmung Des Dipolmomentes Aromatischer Verbindungen Im Ersten Angeregten Singulettzustand. Z. Fur Elektrochem. 1957, 61, 962–975.
- Mataga, N.; Kaifu, Y.; Koizumi, M. Solvent Effects upon Fluorescence Spectra and the Dipole moments of Excited Molecules. Bull. Chem. Soc. Jpn. 1956, 29, 465–470.
- Bakhshiev, N.G. Universal Intermolecular Interactions and Their Effect on the Position of the Electronic Spectra of Molecules in Two-Component Solutions. VII. Theory (General Case of an Isotropic Solution). Opt. Spectrosc. 1964, 16, 446.
- Kawski, A. On the Estimation of Excited-State Dipole Moments from Solvatochromic Shifts of Absorption and Fluorescence Spectra. Z. Nat. A 2002, 57, 255–262.
- Levinson, N.M.; Boxer, S.G. Structural and spectroscopic analysis of the kinase inhibitor bosutinib and an isomer of bosutinib binding to the Abl tyrosine kinase domain. PLoS ONE 2012, 7, e29828.
- Assessment Report Gefitinib Mylan; EMA/587444/2018; The European Medicines Agency: Amsterdam, The Netherlands, 2018; p. 44.
- Dömötör, O.; Pelivan, K.; Borics, A.; Keppler, B.K.; Kowol, C.R.; Enyedy, É.A. Comparative studies on the human serum albumin binding of the clinically approved EGFR inhibitors gefitinib, erlotinib, afatinib, osimertinib and the investigational inhibitor KP2187. J. Pharm. Biomed. Anal. 2018, 154, 321–331.
- Morales-Vilchis, M.G.; Flores-Sánchez, P.; Escalante, J. Identification, synthesis and structure assignment of two impurities of Erlotinib, a drug used for the treatment of some types of cancer. J. Mex. Chem. Soc. 2019, 63, 43–49.
- Wilson, J.N.; Liu, W.; Brown, A.S.; Landgraf, R. Binding-induced, turn-on fluorescence of the EGFR/ERBB kinase inhibitor, lapatinib. Org. Biomol. Chem. 2015, 13, 5006–5011.
- Fu, R.; Zhang, L. Analysis of Positional Isomers of Lapatinib with Agilent Poroshell 120 PFP Columns, Agilent Technical Note. Available online: https://www.agilent.com/cs/library/applications/5991-4373EN.pdf (accessed on 6 January 2022).
- Patil Smita, J.; Doijad Rajendra, C.; Dhumal Priya, P. Development of UV-spectrophotometric method for the determination of Imatinib Mesylate (ITM) in bulk and formulation. Asian J. Pharm. Clin. Res. 2013, 6, 54–57.
- Zidan, D.W.; Hassan, W.S.; Elmasry, M.S.; Shalaby, A.A. A novel spectrofluorimetric method for determination of imatinib in pure, pharmaceutical preparation, human plasma, and human urine. Luminescence 2018, 33, 232–242.
- Yu, D.; Liang, X. Fragmentation pathways and differentiation of positional isomers of sorafenib and structural analogues by ESI-IT-MSn and ESI-Q-TOF-MS/MS coupled with DFT calculations. J. Mass Spectrom. 2018, 53, 579–589.
- Bondì, M.L.; Scala, A.; Sortino, G.; Amore, E.; Botto, C.; Azzolina, A.; Balasus, D.; Cervello, M.; Mazzaglia, A. Nanoassemblies Based on Supramolecular Complexes of Nonionic Amphiphilic Cyclodextrin and Sorafenib as Effective Weapons to Kill Human HCC Cells. Biomacromolecules 2015, 16, 3784–3791.
- Kabir, M.L.; Backler, F.; Clayton, A.H.A.; Wang, F. Deducing the Conformational Properties of a Tyrosine Kinase Inhibitor in Solution by Optical Spectroscopy and Computational Chemistry. Front. Chem. 2020, 8, 596.
- Fan, Y.F.; Zhang, W.; Zeng, L.; Lei, Z.N.; Cai, C.Y.; Gupta, P.; Yang, D.H.; Cui, Q.; Qin, Z.D.; Chen, Z.S.; et al. Dacomitinib antagonizes multidrug resistance (MDR) in cancer cells by inhibiting the efflux activity of ABCB1 and ABCG2 transporters. Cancer Lett. 2018, 421, 186–198.
- Illendula, S.; Sumanjali, T.; Sandhya, D.; Lavanya, N.; Rao, G.K.; Rao, K.N.V.; Dutt, K.R. Method development and validation of AFATINIB in bulk and pharmaceutical dosage form by UV spectrophotometry. INDO Am. J. Pharm. Sci. 2018, 5, 1169–1173.
- Alanazi, A.M.; Abdelhameed, A.S. A spectroscopic approach to investigate the molecular interactions between the newly approved irreversible ErbB blocker “Afatinib” and bovine serum albumin. PLoS ONE 2016, 11, e0146297.
- Togami, K.; Fukuda, K.; Yamaguchi, K.; Chono, S.; Tada, H. Facile and sensitive HPLC-UV method for determination of nintedanib in rat plasma. Int. J. Pharm. Pharm. Sci. 2018, 10, 133–137.
- Englinger, B.; Kallus, S.; Senkiv, J.; Heilos, D.; Gabler, L.; van Schoonhoven, S.; Terenzi, A.; Moser, P.; Pirker, C.; Timelthaler, G.; et al. Intrinsic fluorescence of the clinically approved multikinase inhibitor nintedanib reveals lysosomal sequestration as resistance mechanism in FGFR-driven lung cancer. J. Exp. Clin. Cancer Res. 2017, 36, 122.
- Khattab, M.; Wang, F.; Clayton, A.H.A. UV-Vis spectroscopy and solvatochromism of the tyrosine kinase inhibitor AG-1478. Spectrochim. Acta-Part A Mol. Biomol. Spectrosc. 2016, 164, 128–132.
- CArteaga, L.; Ramsey, T.T.; Shawver, L.K.; Guyer, C.A. Unliganded epidermal growth factor receptor dimerization induced by direct interaction of quinazolines with the ATP binding site. J. Biol. Chem. 1997, 272, 23247–23254.
- Levitzki, A.; Gazit, A. Tyrosine kinase inhibition: An approach to drug development. Science 1995, 267, 1782–1788.
- Khattab, M.; Wang, F.; Clayton, A.H.A. Micro-solvation of tyrosine-kinase inhibitor AG1478 explored with fluorescence spectroscopy and computational chemistry. RSC Adv. 2017, 7, 31725–31735.
- Jameson, D.M.; Ross, J.A. Fluorescence polarization/anisotropy in diagnostics and imaging. Chem. Rev. 2010, 110, 2685–2708.
- Huang, X.; Aulabaugh, A. Application of Fluorescence Polarization in HTS Assays. In High Throughput Screening; Humana Press: New York, NY, USA, 2016; Volume 1439, pp. 115–130.
More
Information
Subjects:
Oncology
Contributors
MDPI registered users' name will be linked to their SciProfiles pages. To register with us, please refer to https://encyclopedia.pub/register
:
View Times:
1.4K
Revisions:
2 times
(View History)
Update Date:
25 Aug 2022
Table of Contents


Notice
You are not a member of the advisory board for this topic. If you want to update advisory board member profile, please contact office@encyclopedia.pub.
OK
Confirm
Only members of the Encyclopedia advisory board for this topic are allowed to note entries. Would you like to become an advisory board member of the Encyclopedia?
Yes
No
${ textCharacter }/${ maxCharacter }
Submit
Cancel
Back
Comments
${ item }
|
${ item.createdUser.fullName }
${ item.createdAt }
${ item.vote }
${ item.reply }
Delete
${ reply.createdUser.fullName }
${ reply.createdAt }
${ reply.vote }
Delete
There is no reply to this comment~
${ item.replyTextCharacter }/${ item.replyMaxCharacter }
Submit
Cancel
More
No more~
There is no comment~
${ textCharacter }/${ maxCharacter }
Submit
Cancel
${ selectedItem.replyTextCharacter }/${ selectedItem.replyMaxCharacter }
Submit
Cancel
Confirm
Are you sure to Delete?
Yes
No