 +1 credit
| Version | Summary | Created by | Modification | Content Size | Created at | Operation |
|---|---|---|---|---|---|---|
| 1 | ANH Hoang LE | -- | 2801 | 2022-08-20 04:00:35 | | | |
| 2 | Lindsay Dong | -1319 word(s) | 1482 | 2022-08-22 06:18:46 | | | | |
| 3 | Lindsay Dong | Meta information modification | 1482 | 2022-08-23 09:41:45 | | |
Video Upload Options
The online banking is a banking service that allows users to be “at home” and use the service at any time through an internet connection. In online banking services, the restrictions of time and geography have been removed, and customers can access their bank accounts and make transactions at almost anytime and anywhere via computers and an internet gateway.
1. Introduction
There are many studies aimed at determining the factors impacting the intention and decision to choose online banking. However, these studies mainly use the theory of reasoned action (TRA) [9][10], theory of planned behavior (TPB), and technology acceptance model (TAM) [11]. For example, the study of Naruetharadhol et al. [12] developed a model based on TAM to examine the factors affecting the intention to use mobile payments with 688 mobile payment service users in Thailand. Ananda et al. [13] extended TAM to examine the factors influencing the intention to use digital banking with 200 individual customers of seven local banks and two Islamic banks across Oman. Mortimer et al. [14] developed a model based on TAM to empirically examine the motivations affecting the intention to use mobile banking of 348 consumers in Thailand and Australia. These studies have shown the factors affecting the consumer’s acceptance of using banking services. However, according to Venkatesh et al. [15], the studies based on the above theories are not really comprehensive. On the basis of synthesizing the above theories in the most comprehensive way, Venkatesh et al. [16] proposed the Unified Theory of Acceptance and Use of Technology (UTAUT). Due to its high generalizability, UTAUT is used by many researchers to assess the adoption and use of technology [7][8][17][18]. However, UTAUT has still not covered all the factors affecting the adoption and use of technology [15]. Therefore, UTAUT2, as an extension of UTAUT, can assess the factors affecting the adoption and use of online banking services to overcome the limitations of previous studies.
Besides, the previous studies used structural equation modeling (SEM) to estimate the parameters and draw conclusions about the research hypothesis. However, SEM only evaluates the linear relationship between variables in the model but can not evaluate the non-linear relationship. To solve this issue, the artificial neural network model (ANN) can be used to evaluate the non-linear relationship between variables in the model.2. Factors Affecting Customers' Use of Online Banking
The demographic structure of the samples is shown in Table 1.
| Frequency | Percent | Valid Percent | Cumulative Percent | ||
|---|---|---|---|---|---|
| Age | 18–35 | 132 | 29.8 | 29.8 | 29.8 |
| 35–45 | 239 | 54.0 | 54.0 | 83.7 | |
| 45 or more | 72 | 16.3 | 16.3 | 100.0 | |
| Total | 443 | 100.0 | 100.0 | ||
| Gender | Female | 244 | 55.1 | 55.1 | 55.1 |
| Male | 199 | 44.9 | 44.9 | 100.0 | |
| Total | 443 | 100.0 | 100.0 | ||
| Degree | Bachelors | 211 | 47.6 | 47.6 | 47.6 |
| Doctorate | 79 | 17.8 | 17.8 | 65.5 | |
| Masters | 153 | 34.5 | 34.5 | 100.0 | |
| Total | 443 | 100.0 | 100.0 | ||
Table 2 shows the results of the reliability analysis of the scales corresponding to 8 factors in the model: effort expectancy, performance expectancy, brand image, perceived risk, cost value, social influence, behavioral intention to use online banking services, and decision to choose to use online banking services.
| Factors | Items | Scale Mean if Item Deleted | Scale Variance if Item Deleted | Corrected Item-Total Correlation | Cronbach’s Alpha if Item Deleted | Cronbach’s Alpha |
|---|---|---|---|---|---|---|
| Effort Expectancy | DSD1 | 10.13 | 3.396 | 0.601 | 0.751 | 0.797 |
| DSD2 | 10.05 | 3.192 | 0.606 | 0.747 | ||
| DSD3 | 10.07 | 3.280 | 0.571 | 0.764 | ||
| DSD4 | 10.10 | 2.990 | 0.658 | 0.720 | ||
| Performance Expectancy | HI1 | 9.49 | 3.065 | 0.637 | 0.790 | 0.827 |
| HI2 | 9.35 | 2.964 | 0.649 | 0.784 | ||
| HI3 | 8.86 | 2.798 | 0.707 | 0.756 | ||
| HI4 | 8.76 | 2.865 | 0.623 | 0.797 | ||
| Perceived Risk | RR1 | 8.33 | 3.037 | 0.637 | 0.812 | 0.838 |
| RR2 | 7.85 | 3.221 | 0.651 | 0.803 | ||
| RR3 | 8.28 | 3.088 | 0.710 | 0.777 | ||
| RR4 | 8.42 | 3.153 | 0.686 | 0.788 | ||
| Brand Image | HA1 | 10.19 | 3.351 | 0.638 | 0.801 | 0.833 |
| HA2 | 10.21 | 3.484 | 0.660 | 0.790 | ||
| HA3 | 10.23 | 3.397 | 0.669 | 0.786 | ||
| HA4 | 10.25 | 3.554 | 0.687 | 0.779 | ||
| Cost Value | CP1 | 10.15 | 4.320 | 0.631 | 0.872 | 0.885 |
| CP2 | 10.16 | 4.218 | 0.710 | 0.867 | ||
| CP3 | 10.14 | 3.988 | 0.805 | 0.830 | ||
| CP4 | 10.16 | 3.830 | 0.860 | 0.808 | ||
| Social Influence | XH1 | 10.02 | 3.323 | 0.641 | 0.760 | 0.812 |
| XH2 | 9.96 | 3.324 | 0.620 | 0.769 | ||
| XH3 | 9.98 | 3.327 | 0.600 | 0.779 | ||
| XH4 | 10.13 | 3.098 | 0.662 | 0.749 | ||
| Behavioral Intention | YD1 | 10.22 | 4.171 | 0.739 | 0.798 | 0.855 |
| YD2 | 10.17 | 4.429 | 0.664 | 0.829 | ||
| YD3 | 10.24 | 4.264 | 0.751 | 0.794 | ||
| YD4 | 10.16 | 4.385 | 0.640 | 0.840 | ||
| Decision to choose | LC1 | 6.81 | 2.184 | 0.687 | 0.813 | 0.847 |
| LC2 | 6.74 | 1.887 | 0.770 | 0.732 | ||
| LC3 | 6.79 | 2.086 | 0.691 | 0.810 |
The result of the estimations of SEM is presented in Figure 1.
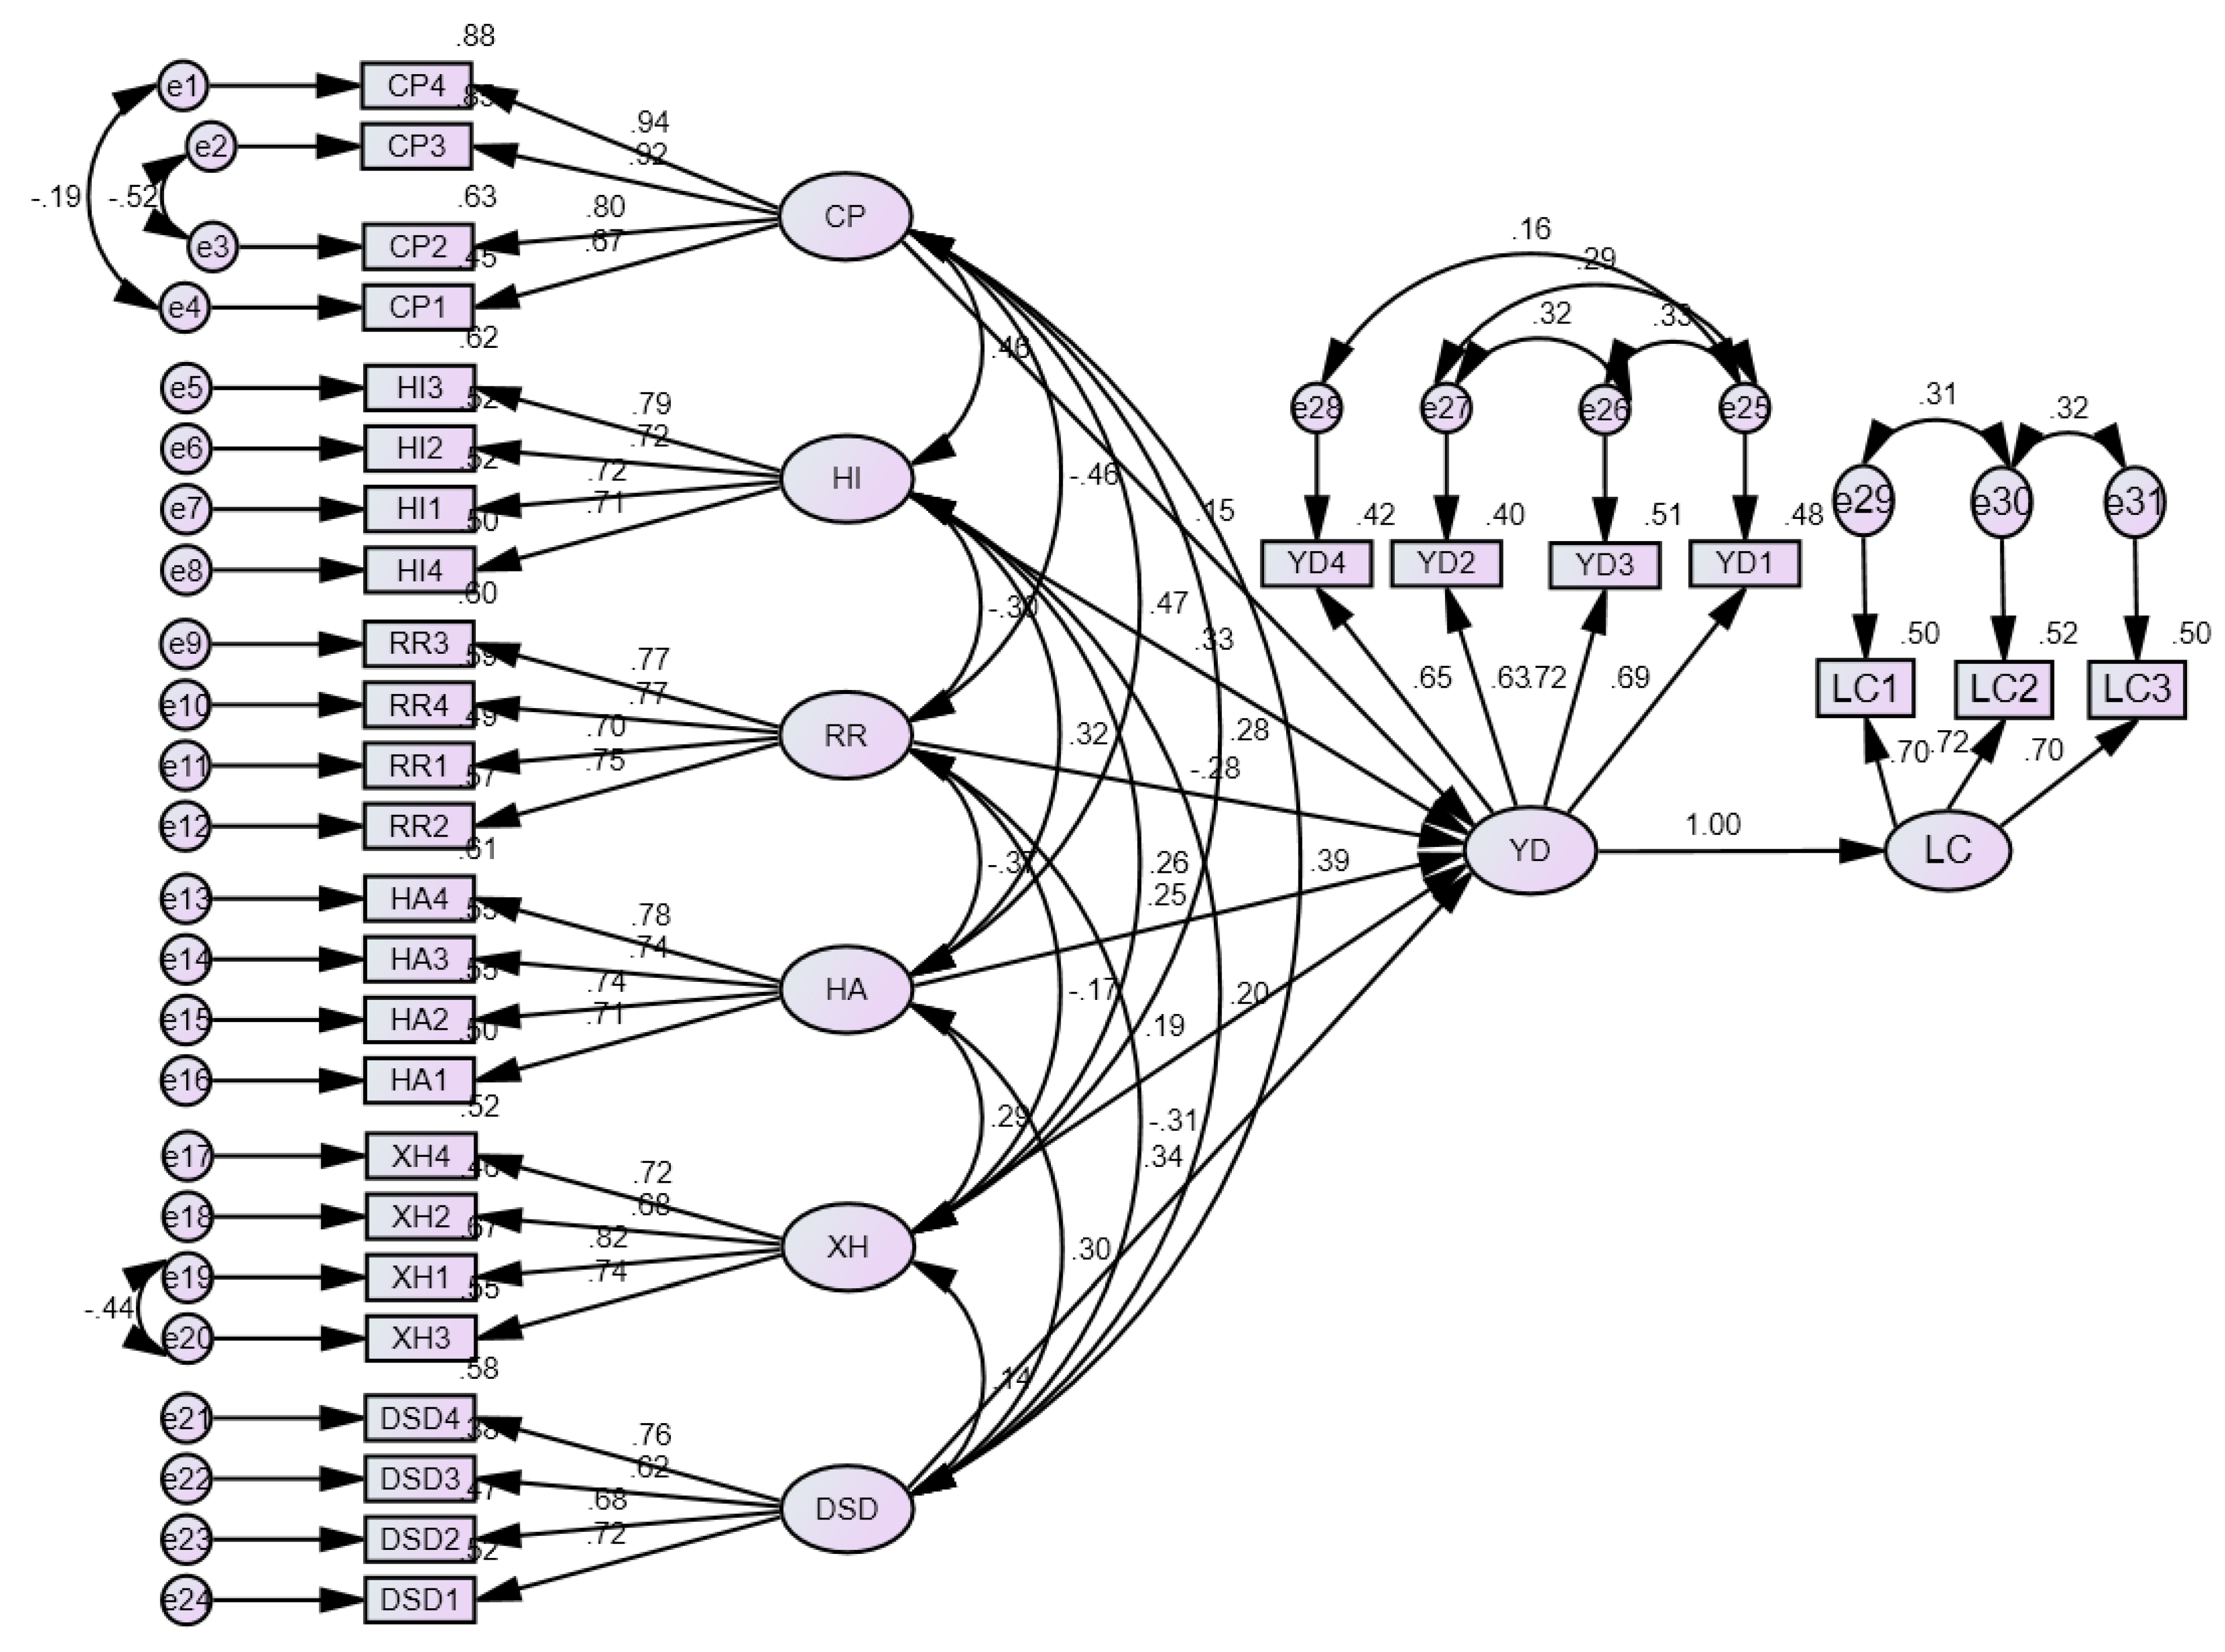
Figure 1. The Structural Equation Model. Effort expectancy (DSD), performance expectancy (HI), perceived risk (RR), brand image (HA), cost value (CP), social influence (XH), behavioral intention (YD), decision to choose (LC).
Table 3 presents the result of the intercorrelation matrix, the values of average variance extracted (AVE), and the composite reliability (CR) of each scale corresponding to each factor in the model. The result shows that AVEs are all greater than 0.5. Therefore, all of the factors in the model converge [19].
| CR | AVE | Effort Expectancy | Cost Value | Performance Expectancy | Perceived Risk | Brand Image | Social Influence | Behavioral Intention | |
|---|---|---|---|---|---|---|---|---|---|
| Effort Expectancy | 0.798 | 0.598 | 0.706 | ||||||
| Cost Value | 0.892 | 0.678 | 0.372 | 0.824 | |||||
| Performance Expectancy | 0.829 | 0.549 | 0.209 | 0.458 | 0.741 | ||||
| Perceived Risk | 0.840 | 0.568 | −0.314 | −0.447 | −0.301 | 0.754 | |||
| Brand Image | 0.835 | 0.558 | 0.303 | 0.457 | 0.322 | −0.370 | 0.747 | ||
| Social Influence | 0.813 | 0.521 | 0.153 | 0.262 | 0.256 | −0.168 | 0.294 | 0.722 | |
| Behavioral Intention | 0.858 | 0.603 | 0.495 | 0.636 | 0.575 | −0.537 | 0.564 | 0.417 | 0.777 |
Table 4 shows that the Chi-square/df value of 2.124 is lower than the threshold of 3, recommended by Carmines and McIver [20]. The values of RFI, AGFI, GFI, and NFI are 0.870, 0.865, 0.890, and 0.887, respectively. For the CFI, TLI, and IFI, the obtained values are all greater than 0.90. The RMSEA is also in the desired range between 0.05 and 0.08 [21]. Thus, the SEM is consistent with the data.
| Criteria | Value | Criteria | Value |
|---|---|---|---|
| Chi-square | 860.212 | NFI | 0.887 |
| p-value | 0.000 | CFI | 0.936 |
| Chi-square/df | 2.124 | TLI | 0.927 |
| RFI | 0.870 | IFI | 0.937 |
| AGFI | 0.865 | RMSEA | 0.057 |
| GFI | 0.890 |
The estimation result of SEM shows that the factors affecting the behavioral intention to use online banking services are cost value, performance expectancy, perceived risk, brand image, social influence, effort expectancy. Therefore, these six factors will be brought to the input layer of the MLP model. The output layer is the behavioral intention to use online banking services factor. To the hidden layer, in the case of six input factors, the number of neurons in the hidden layer is log2(6)=2.58. Thus, the number of neurons in the hidden layer is 3. The Sigmoid function is used as the activation function of the neurons in the hidden and the output layers. It uses 90% of the sample data to train the model, and the remaining 10% is used to test the accuracy of the model. An MLP model is shown in Figure 2.
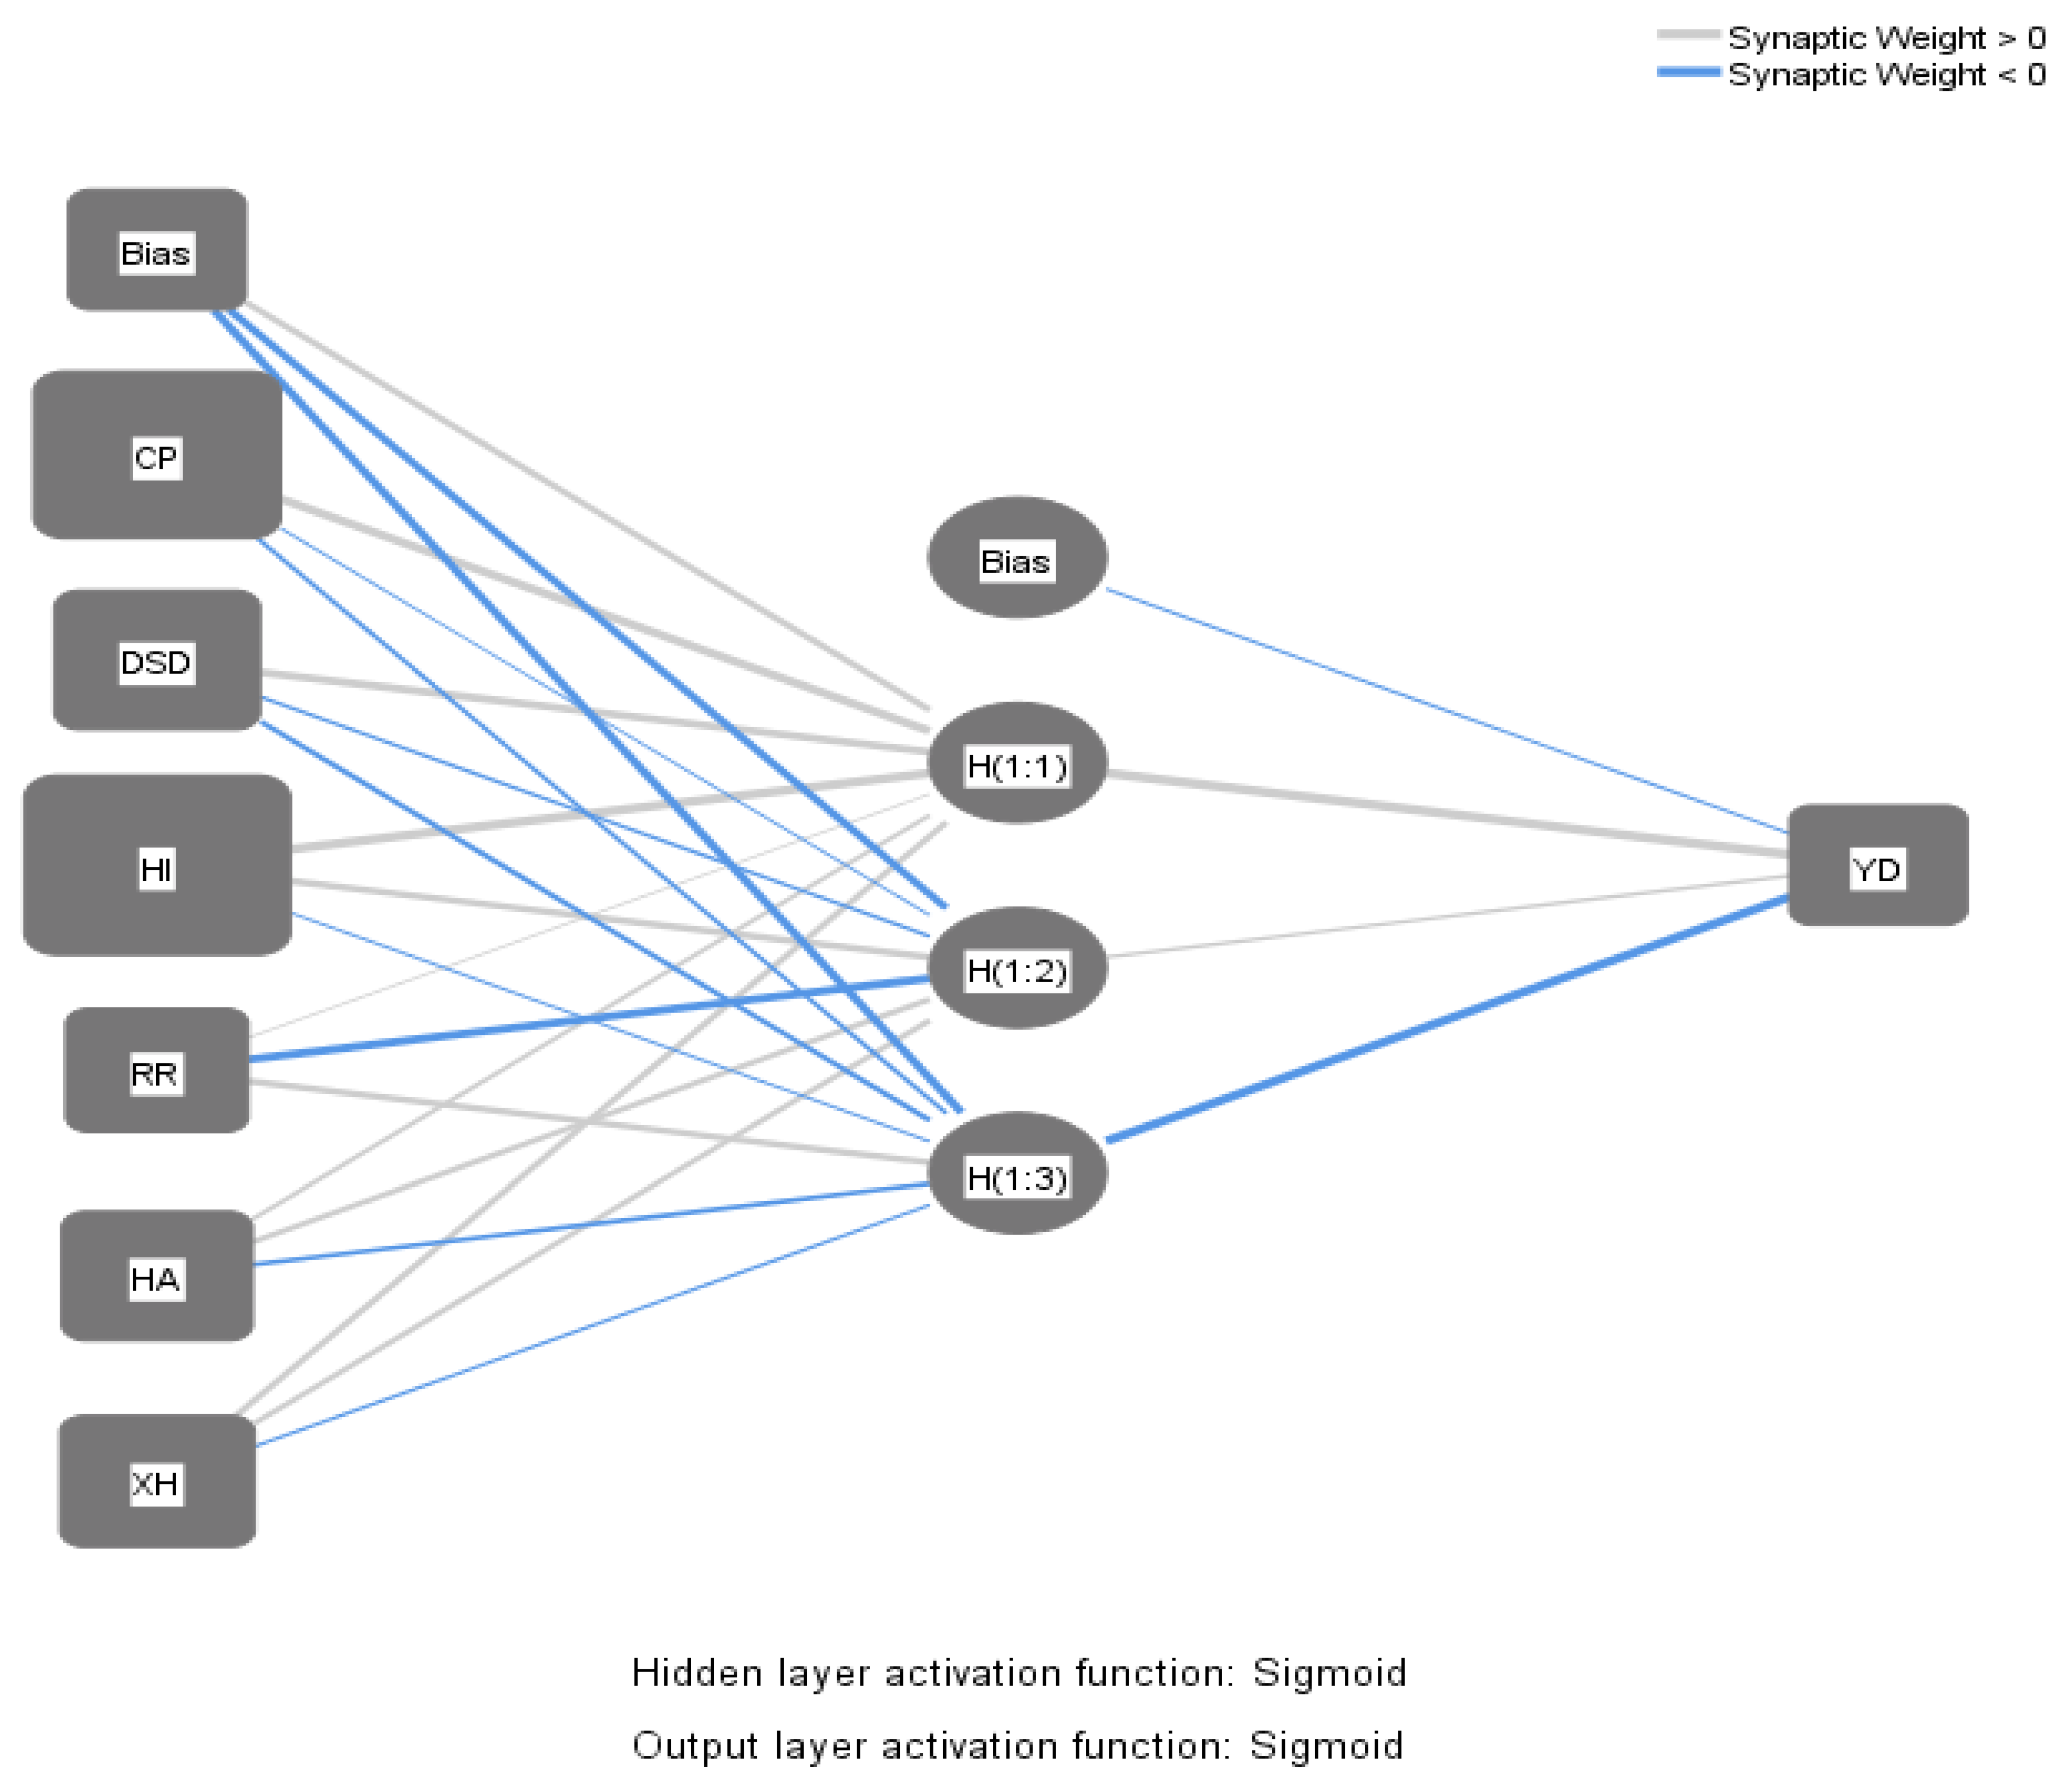
Figure 2. MLP model. Effort expectancy (DSD), performance expectancy (HI), perceived risk (RR), brand image (HA), cost value (CP), social influence (XH), behavioral intention (YD).
Image, and social influence all positively impact the intention to use online banking services. Thus, increasing the factors of performance expectancy, cost value, effort expectancy, brand image, and social influence can increase the customer’s intention to use online banking services. While the perceived risk has a negative impact on the intention to use online banking services. That means when customers feel that online banking services are risky, their intention to use online banking services will decrease
At the same time, the intention to use online banking services also has a positive impact on the decision to choose to use online banking services. This result indicates that when customers form an intention to use, they will quickly make a decision to choose online banking services. Thees findings are supported by Venkatesh et al. [15], Polatoglu and Ekin [22], Suganthi [23], Hernandez and Mazzon [24], Poon [25]; Fishbein and Ajzen [10], Taylor and Tood [26], Davis [11], Taylor and Todd [26], Kijsanayotin et al. [27], Tarhini et al. [17], Gupta and Arora [28], Alalwan et al. [29], Yaseen and Qirem [30], Rambocas et al. [31], Linh et al. [32]. Moreover, these results also shed light on the validity of the UTAUT2 model when conducting research on the adoption and use of technology in the Vietnamese market.
There are different impact levels of factors on intention to use online banking services between the MLP and SEM models. Specifically, the SEM model shows that the order of factors affecting the intention to use online banking services from strong to weak is effort expectancy, performance expectancy, perceived risk, brand image, social influence, and cost value, respectively. Meanwhile, the MLP model shows that the order of factors affecting the intention to use online banking services from strong to weak is performance expectancy, cost value, effort expectancy, brand image, perceived risk, and social influence, respectively. From the economic perspective, the results obtained from the MLP model show a better fit than the SEM model.References
- Jayawardhena, C.; Foley, P. Changes in the Banking Sector—The Case of Internet Banking Inthe UK. Internet Res. 2000, 10, 19–31.
- Prendergast, G.P.; Marr, N.E. The Future of Self-Service Technologies in Retail Banking. Serv. Ind. J. 1994, 14, 94–114.
- Mols, N.P. The Internet and Services Marketing—The Case of Danishretail Banking. Internet Res. 2000, 10, 7–18.
- Tan, M.; Teo, T.S.H. Factors Influencing the Adoption of Internet Banking. J. Assoc. Inf. Syst. 2000, 1.
- Daniel, E. Provision of Electronic Banking in the UK and the Republic of Ireland. Int. J. Bank Mark. 1999, 17, 72–83.
- Al-Qeisi, K.; Dennis, C.; Alamanos, E.; Jayawardhena, C. Website Design Quality and Usage Behavior: Unified Theory of Acceptance and Use of Technology. J. Bus. Res. 2014, 67, 2282–2290.
- AbuShanab, E.; Pearson, J.M. Internet Banking in Jordan: The Unified Theory of Acceptance and Use of Technology (UTAUT) Perspective. J. Syst. Inf. Technol. 2007, 9, 78–97.
- Dajani, D.; Yaseen, S.G. The Applicability of Technology Acceptance Models in the Arab Business Setting. J. Bus. Retail. Manag. Res. 2016, 10. Available online: https://jbrmr.com/cdn/article_file/i-24_c-228.pdf (accessed on 21 March 2022).
- Ajzen, I. The Theory of Planned Behavior. Organ. Behav. Hum. Decis. Processes 1991, 50, 179–211.
- Fishbein, M.; Ajzen, I. Belief, Attitude, Intention and Behaviour: An Introduction to Theory and Research; Elsevier Science Publishing Co., Inc.: New York, NY, USA, 1975; Volume 27.
- Davis, F.D. Perceived Usefulness, Perceived Ease of Use, and User Acceptance of Information Technology. MIS Q. 1989, 13, 319–340.
- Naruetharadhol, P.; Ketkaew, C.; Hongkanchanapong, N.; Thaniswannasri, P.; Uengkusolmongkol, T.; Prasomthong, S.; Gebsombut, N. Factors Affecting Sustainable Intention to Use Mobile Banking Services. SAGE Open 2021, 11, 21582440211029924.
- Ananda, S.; Devesh, S.; Al Lawati, A.M. What Factors Drive the Adoption of Digital Banking? An Empirical Study from the Perspective of Omani Retail Banking. J. Financ. Serv. Mark. 2020, 25, 14–24.
- Mortimer, G.; Neale, L.; Hasan, S.F.E.; Dunphy, B. Investigating the Factors Influencing the Adoption of M-Banking: A Cross Cultural Study. Int. J. Bank Mark. 2015, 33, 545–570.
- Venkatesh, V.; Thong, J.Y.L.; Xu, X. Consumer Acceptance and Use of Information Technology: Extending the Unified Theory of Acceptance and Use of Technology. MIS Q. 2012, 36, 157–178.
- Venkatesh, V.; Morris, M.G.; Davis, G.B.; Davis, F.D. User Acceptance of Information Technology: Toward a Unified View. MIS Q. 2003, 27, 425–478.
- Yaseen, S.G.; El Qirem, I.A. Intention to Use E-Banking Services in the Jordanian Commercial Banks. Int. J. Bank Mark. 2018, 36, 557–571.
- Compeau, D.R.; Higgins, C.A. Computer Self-Efficacy: Development of a Measure and Initial Test. MIS Q. 1995, 19, 189–211.
- Fornell, C.; Larcker, D.F. Evaluating Structural Equation Models with Unobservable Variables and Measurement Error. J. Mark. Res. 1981, 18, 39–50.
- Carmines, E.; McIver, J. An Introduction to the Analysis of Models with Unobserved Variables. Political Methodol. 1983, 9, 51–102.
- Hair, J.F.J.; Black, W.; Babin, B.; Anderson, R.; Tatham, R.L. Mutivariate Data Analysis; Pearson Prentice Hall: Upper Saddle River, NJ, USA, 2006; Volume 31.
- Seth, N.; Deshmukh, S.G.; Vrat, P. Service Quality Models: A Review. Int. J. Qual. Reliab. Manag. 2005, 22, 913–949.
- Laukkanen, T.; Sinkkonen, S.; Laukkanen, P. Communication Strategies to Overcome Functional and Psychological Resistance to Internet Banking. Int. J. Inf. Manag. 2009, 29, 111–118.
- Kijsanayotin, B.; Pannarunothai, S.; Speedie, S.M. Factors Influencing Health Information Technology Adoption in Thailand’s Community Health Centers: Applying the UTAUT Model. Int. J. Med. Inform. 2009, 78, 404–416.
- Kerem, K. Adoption of Electronic Banking: Underlying Consumer Behaviour and Critical Success Factors. Available online: https://www.semanticscholar.org/paper/Adoption-of-electronic-banking-%3A-underlying-and-Kerem/419a9497919289acea27baeb0c9e9909b340f278 (accessed on 21 March 2022).
- Pikkarainen, T.; Pikkarainen, K.; Karjaluoto, H.; Pahnila, S. Consumer Acceptance of Online Banking: An Extension of the Technology Acceptance Model. Internet Res. 2004, 14, 224–235.
- Chan, S.; Lu, M. Understanding Internet Banking Adoption and Use Behavior: A Hong Kong Perspective. J. Glob. Inf. Manag. (JGIM) 2004, 12, 21–43.
- Farzin, M.; Sadeghi, M.; Yahyayi Kharkeshi, F.; Ruholahpur, H.; Fattahi, M. Extending UTAUT2 in M-Banking Adoption and Actual Use Behavior: Does WOM Communication Matter? Asian J. Econ. Bank. 2021, 5, 136–157.
- Davis, F.D. User Acceptance of Information Technology: System Characteristics, User Perceptions and Behavioral Impacts. Int. J. Man-Mach. Stud. 1993, 38, 475–487.
- Wallin Andreassen, T.; Lindestad, B. Customer Loyalty and Complex Services: The Impact of Corporate Image on Quality, Customer Satisfaction and Loyalty for Customers with Varying Degrees of Service Expertise. Int. J. Serv. Ind. Manag. 1998, 9, 7–23.
- Thompson, C.J.; Locander, W.B.; Pollio, H.R. Putting Consumer Experience Back into Consumer Research: The Philosophy and Method of Existential-Phenomenology. J. Consum. Res. 1989, 16, 133–146.
- Moore, G.C.; Benbasat, I. Development of an Instrument to Measure the Perceptions of Adopting an Information Technology Innovation. Inf. Syst. Res. 1991, 2, 192–222.


