Your browser does not fully support modern features. Please upgrade for a smoother experience.
Submitted Successfully!
 +1 credit
Thank you for your contribution! You can also upload a video entry or images related to this topic.
For video creation, please contact our Academic Video Service.
| Version | Summary | Created by | Modification | Content Size | Created at | Operation |
|---|---|---|---|---|---|---|
| 1 | Marek Tulej | -- | 4514 | 2022-08-19 10:24:13 | | | |
| 2 | Catherine Yang | -9 word(s) | 4505 | 2022-08-19 11:14:16 | | |
Video Upload Options
We provide professional Academic Video Service to translate complex research into visually appealing presentations. Would you like to try it?
Cite
If you have any further questions, please contact Encyclopedia Editorial Office.
Tulej, M. Geochemical Analysis with Laser Mass Spectrometer. Encyclopedia. Available online: https://encyclopedia.pub/entry/26314 (accessed on 24 June 2026).
Tulej M. Geochemical Analysis with Laser Mass Spectrometer. Encyclopedia. Available at: https://encyclopedia.pub/entry/26314. Accessed June 24, 2026.
Tulej, Marek. "Geochemical Analysis with Laser Mass Spectrometer" Encyclopedia, https://encyclopedia.pub/entry/26314 (accessed June 24, 2026).
Tulej, M. (2022, August 19). Geochemical Analysis with Laser Mass Spectrometer. In Encyclopedia. https://encyclopedia.pub/entry/26314
Tulej, Marek. "Geochemical Analysis with Laser Mass Spectrometer." Encyclopedia. Web. 19 August, 2022.
Copy Citation
Laser ablation/ionisation mass spectrometer (named LMS) demonstrated its high performance for the chemical analysis of micrometre-sized objects, such as mineralogical grains, layers, biologically relevant films and microscopic fossils.
planetary exploration
in situ chemical analysis
chemical mapping
1. Laser Mass Spectrometer (LMS)
A miniature laser ablation/ionisation time-of-flight mass analyser (named LMS) system has been the subject of development in the laboratory over the last two decades [1]. After several improvements and upgrades of the ion optical system, detection and acquisition systems, and improvements of the measurement protocols, the current instrument can be applied to a sensitive analysis of soils and rocks [2][3][4][5]. The surface chemical imaging and 3D chemical analysis by adding depth profiling measurements can be conducted routinely with sensitivity down to a few parts per thousand (per mil) levels, a few micrometre lateral and sub-micrometre vertical resolution [6][7][8][9][10][11]. LMS demonstrated its high performance for the chemical analysis of micrometre-sized objects, such as mineralogical grains, layers, biologically relevant films and microscopic fossils [12][13][14][15]. The measurement protocols allowed more accurate measurements of the isotope abundance and the improvements of overall chemical composition quantification [16][17][18][19][20].
Figure 1a shows schematic diagram illustrating the principle of operation of the LMS instrument. A focused laser radiation is used to remove a thin layer of material from the surface. The laser ion source parameters (e.g., pulse energy, radiation wavelength) are tuned in such a way that atomisation and ionisation of the sample material is close to atomic stoichiometric ratios as they are present in the material and the atomic concentrations reflect the element concentrations of the removed surface layer. To improve the quantitative performance of the measurement, one can conduct, in parallel, a measurement on standard research material (SRM) to obtain relative sensitivity coefficients (RSCs) and correct for the different ionisation yields of elements at the applied laser ablation ion source conditions [21]. The atomic ions formed in the ablation process are temporally and spatially separated, according to their mass to charge ratio by a time-of-flight (TOF) mass analyser and recorded by the ion detector (multichannel plate, MCP) as a function of time of arrival into the detector. This is arranged by an ion optical system, which confines, focusses and transmits the ions from the ablation spot through the field-free region, reflectron and field-free region again to an MCP ion detector. The photograph of the mass analyser is shown in Figure 1b, also indicating the typical dimensions of the mass analyser without the laser optical system. Figure 1c shows a possible schematic of the laser mass spectrometer for space application (see also [22]). The dimension of a compact instrument, combining mass analyser, laser optical system with a microchip laser, including instrument compartment, are about 400 mm × 200 mm, an instrument weight of about 13 kg, with an average power consumption of about 45 W (all electronics included). These parameters can be further optimised to meet the technical requirements on a rover or a lander platform. Currently, miniature pulsed laser systems are available commercially. Nevertheless, these systems are typically ns- or sub-ns lasers. Miniature fs-laser systems are not available until now but with progress in fibre technology miniaturization of these systems is also expected in near future.
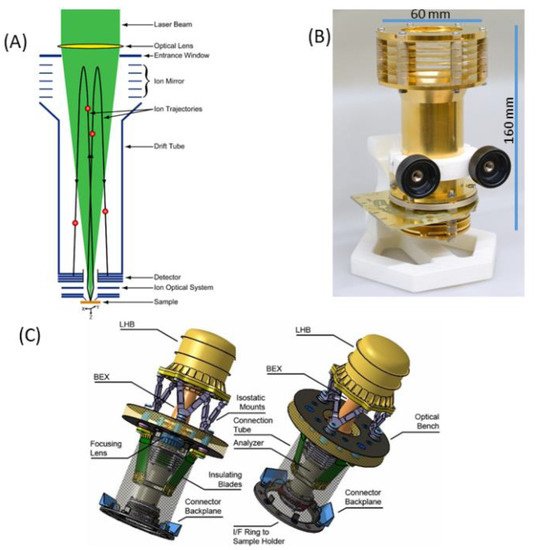
Figure 1. Schematic diagram of a miniature LMS with key parts labelled (A), an image of the mass analyser with its dimensions (B) and a possible design of a space instrument with an optical part (optical system with a microchip laser) attached to an optical bench (interface), introducing a focused laser radiation from the reflectron site (C).
The mass analyser delivers multi-elemental composition information of the ablated surface layer and interrogated surface area/volume for each applied laser pulse. The mass spectrometric analysis involves transformation from the time scale to the mass scale to assign measured mass ion peaks to the corresponding elements (isotopes). The mass peak integration in the time spectrum yields the number of measured ions, and the measurement of all atomic ions provides the means to derive the atomic and isotope concentrations, respectively. The detailed procedure used for the analysis of the mass spectra can be found in the previous publication together with the evaluation of the accuracies of the applied methods [16]. Although the instrument is capable of measuring almost all elements with the exception of rare gas elements, its sensitivity can vary depending on the laser ablation ion source parameters, including laser pulse duration, radiation wavelength, pulse energy, laser irradiance and fluence, and physical and chemical material properties [19]. These so-called measurement fractionation effects can be generally minimised by selecting a short laser pulse duration (preferably femtosecond laser pulses) and a short laser radiation wavelength (preferably in the UV or VUV spectral range) at sufficiently high laser pulse energy and irradiance [21]. The LMS instrument has an optimised ion transmission close to 100%, thus the fractionation effects due to the mass analyser are considered to be negligible [1]. The current LMS system allows sensitive studies on geological samples and quantitative or semiquantitative chemical composition analysis, depending on if in parallel relevant standard materials are used or not [20][21]. Owing to the typically observed dynamic range of about 105, detection limits of ten (or better) ppm (parts per million) in atomic fractions can be achieved depending on the efficiency of the atomic ionisation [5][20][21][23]. The quantitative element analysis can be delivered down to ppm levels [20][24]. Improved detection capabilities can be further achieved with a multi-anode detector system and by applying a high voltage pulser to hinder atomic ions with the highest concentrations from reaching the detector [3][25][26]. The measurement of isotope concentrations is a unique capability of the LMS instrument. The accuracy and precision of the isotope abundance determination depends on the isotope concentration (atomic fractions) and can be at per mil level if the isotope concentrations are larger than 10–50 ppm [27][28]. Further improvements to the accuracy and precision of the isotope ratio determination was achieved by applying the isotope intensity correlation method and spectra filtering [17][18]. Sufficiently high accuracy and precision in the determination of the Pb, S and Ni isotope ratios so that isotope fractionation effects can examined for Pb-Pb dating (both accuracy and precision at a few per mill level) [28], biologically relevant fractionation of the S isotopes (both accuracy and precision at per mill level) [29], or both bio-relevant or geological fractionation of the Ni isotopes (both accuracy and precision at per mill level) [18].
Sub-micrometre vertical and micrometre lateral spatial resolution can be maintained with the control of laser ion source parameters (flexible focussing optics, laser pulse energy tuning) [30][31][32]. The measurements can be performed on raw samples and do not require the application of advanced surface preparation methods. Very recent reviews describe the current progress in development of various LIMS systems, also providing details of the design and operation, as well as reviewing numerous LIMS studies on geological, meteoritic and biological samples along with applications to material science conducted by groups developing LIMS systems [19][33].
Through chemical surface mapping, one can analyse many locations experimentally, which provides a large number of mass spectra frequently exceeding the 10 000′s. The identification of compounds in the measured spectra involves statistical analysis. Several earlier studies applied supervised machine learning principles for the rapid identification of microorganisms [34] or tumour [35] from mass spectrometric data collected in the chemical imaging of the sample surface. Recently, the researchers have introduced unsupervised data reduction methods capable of recovering groups of spectra that share a significant level of similarity [36]. The mass spectra encode the necessary information about microscopic structures, minerals, chemical compounds and other heterogeneities within the surface, but due to the high dimensionality of the analysis problem, with each additional mass adding one dimension, the direct mass spectrometric analysis is laborious. Applying dimensionality reduction (PCA, SVD) and manifold learning techniques (e.g., UMAP, t-SNE), one can capture essential data patterns based on their spectral similarities. This analysis method is based on the principle that spectra recorded from the same chemical compound are similar, whereas spectra recorded from different chemical compounds, for example two different minerals, will share only little to no similarity. The data can, therefore, be grouped into clusters of spectra with a similar chemical fingerprint. One can visualise these relationships by embedding the dataset into a low dimensional space, e.g., 2D or 3D, and representing each spectrum with a node. Similar spectra will be embedded close to each other; hence, for each chemical compound present in the dataset a cluster will be formed. Using clustering algorithms (e.g., DBSCAN, HDBSCAN) the different clusters can be retrieved from the embedding, and labels can be assigned to the spectra, according to which cluster they belong to. Instead of analysing the dataset as a whole and trying to identify different compounds, one can now simply analyse the data from each cluster individually through basic spectrum analysis, which allows us to identify the corresponding compounds and, therefore, determine the composition of the investigated sample. This method is a great tool for geological samples to identify different mineral phases but can in principle be applied to any data obtained from different compounds, as long as the spectra contain more or less pure contributions from only one of the present compounds (no mixtures).
The method was successfully applied to the Gunflint chert, a 1.88 Ga quartz sample hosting remnants of Precambrian microbes in the form of microfossils [37][38]. Three distinct clusters were retrieved, which were later identified as the quartz cluster, the microfossils cluster and a third cluster containing spectra from inclusions with higher metallicity. LMS is capable of recording the chemical signatures of microfossils in geological samples, and by applying spectral similarity clustering the interesting spectra can be quickly identified even in large datasets.
While comparing with the other space and space prototype instrumentation designed for elemental analysis, LMS offers several advantages and improvements. Like LIBS and COSMORBITRAP instruments, LMS can be used for a rapid remote analysis without sample preparation. The current LMS instrument offers increasingly higher sensitivity and element detection limits down to ppm or better and can be used to measure the accurate isotope concentrations of several elements. Contrary to LIBS, LMS requires a dedicated vacuum system for the mass analyser operation and ion detector system when the investigations would be conducted on Mars. With a time-of-flight mass analyser, all atomic ions can be measured for each applied laser pulse allowing for robust multielement measurement capabilities. In the present applications, the fast data acquisition cycle allows measurement of 1000 spectra per second. However, owing to the limited mass resolution (m/∆m = 500), the isobaric interferences, due to the presence of the isotope of other elements or molecular clusters, cannot be resolved directly contrary to the COSMORBITRAP instrument. However, the contribution due to other atomic isotopes can be derived by considering the natural isotope composition, and the possible influence due to isobaric clusters can be inferred from the overall cluster appearance in the mass spectrum. To reduce these latter contaminations, a double pulse laser ablation/ionisation ion source was introduced, where after the first laser pulse used for the sample ablation, a second pulse is applied to heat up the generated plasma plume and reduce post ablation plasma chemistry and cluster production [2].
High spatial resolution chemical imaging and depth profiling analysis down to micrometre level is routinely demonstrated by LMS and can, in principle, also be achieved with other instruments. By employing a microscope camera system in parallel to the LMS measurements, context surface imaging of the areas around the investigated spots can be recorded, helping with the interpretation of the mass spectrometric results and allowing for an improved analysis of physical and chemical properties of the surface [39].
2. Geochemical Analysis with LMS
A short summary of the mass spectrometric studies of a few geological materials listed here serves as examples of possible investigations, which could be carried out on planetary surfaces with the current space-borne mass spectrometric instruments, including the laser mass spectrometer LMS. Several geochemical analyses conducted with LMS demonstrate the capabilities of the instrument to investigate element heterogeneities and contribute to the normative mineralogy of meteoritic samples, trace element analysis in apatite crystal and zircon grains, and contribute to the identification of element zoning and magma cooling mechanisms and the determination of the crystallisation temperatures and dating. Finally, the instrument is also capable of measuring micrometre-sized inclusions, putative microscopic fossils and stromatolite films in the sedimentary rocks and contribute to the characterisation of the ancient environments, characterisation of biosignature and the effects of weathering and mineral transformation (calcite carbonate, aragonite and silica chert).
2.1. Meteoritic Samples
2.1.1. Allende
The Allende meteorite is composed of carbonaceous chondrite material irregularly shaped white calcium aluminium inclusions (CAI) and rounded chondrules in a dark matrix. The CAI are composed of minerals, which are believed to have condensed at high temperatures. The mass spectrometric studies were conducted initially at 138 locations on the Allende sample surface. The concentrations of numerous elements, including C, Mg, Al, Si, S, Ca, Sc, Ti, V, Cr, Mn, Fe, Co and Ni, were determined in these studies. The concentrations of the mineral forming elements Mg, Si, Fe, Ca and Al were observed to vary within 10 % between different locations, and variations of elements Ti, V, Ni and Sc were significantly larger. The latter are refractory elements preferentially contained in refractory chondrules. Furthermore, an enrichment in the lithophile elements Ca, Al and Ti, compared to the siderophile elements Co and Ni and compared to CI chondrites could be observed [6]. The matrix material was observed to be depleted in volatile elements. In follow up studies on the Allende matrix composition, the concentration of C, O, S, Na, K, Li, Mn, P, Cr, Si, Fe, Mg, Ni, Co, V, Ca, Ti, Al and Sc elements were measured together with their spatial variability on different scales from 50 μm to 0.5 mm [40]. With the results obtained from the measurements at 1651 locations, the presence of an olivine-rich composition for the matrix was determined by analysing the n(Si)/(n(Mg) + n(Fe)) dependence, where n(X) denotes the concentration of element X. In addition, the components of Mg-Fe-rich minerals could be identified and the analysis around the chondrules location indicated the presence of grain-sized minerals with higher n(Si)/(n(Mg) + n(Fe)) ratios than measured for the matrix material, and some individual Al-rich analyses. The olivine in the Allende matrix was found to have nearly equal amounts of forsterite and fayalite, with only a small shift towards Fe-rich olivine [40].
2.3. Apatite Crystal in Igneous Rocks
Apatite is ubiquitous albeit a frequently low abundance mineral in most igneous rocks. Its common presence is accounted for by low solubility in naturally occurring melts and aqueous solutions and the limited ability of common rock-forming minerals to accommodate of phosphorus into their structure. As an accessory mineral in igneous and other rocks, it commonly contains a range of elements that do not fit well into the major rock forming minerals, such as rare earth element (REE), and become a suitable target for investigating physical and chemical conditions in igneous rocks and the volatile evolution of magmas, hence, igneous petrogenetic processes and their modelling [41][42][43][44][45].
Apatite is a calcium phosphate mineral expressed by the chemical stoichiometric formula [Ca10(PO4)6(X)2]. The halogen site, X, is occupied by F−, Cl−, and OH− corresponding to an isomorphous series with fluor-, chlor- and hydroxyl-apatite end members, respectively. The apatite investigated with LMS is a fluorapatite mineral isolated from an ultramafic phoscorite rock from the Phalaborwa Complex (Limpopo Province, South Africa) formed 2.06 Ga ago (in Paleoproterozoic) [46]. Several previous studies have revealed the element partitioning and magmatic sourcing and hypothesised on the magmatic and post-magmatic mineral evolution in this region [46][47][48][49][50][51].
The chemical composition of the apatite sample was measured with high spatial resolution (10 μm spot size, sub-micrometre depth resolution) on 900 locations covering a sample are of 0.9 × 0.9 mm2 (Figure 2). The photomicrograph shows the investigated area in more detail. Location 1 marks a mineralogical phase that is in contact with the apatite crystal via a rim (location 2). Location 3 is tentatively assigned to the crystal core. Furthermore, at locations 4, 5 and 6, coloured reflections can be noticed at the micrometre size dimensions. The image also indicates the presence of several apatite crystal sheets. In the mass spectra obtained for the apatite crystal, the (O, F, Ca, P and Cl) elements are observed as major elements as expected for fluorapatite. A number of trace elements, including C, Na, Mg, Si, S, Cl, K, Mn, Fe, Sr, Ba and LREE (La, Ce, Pr, Sm), were measured at abundances levels down to part per million (atomic fractions). An anomalous increase in the element concentrations was observed at locations 4 and 5 for Sr and B and at location 6 for Th and U.
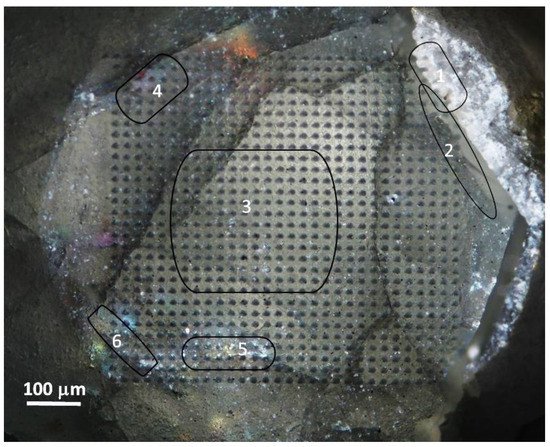
Figure 2. A microscope image of the apatite crystal surface along the z-axis with several crystalline sheets. On the left side the crystal is in contact with carbonatite rock (location 1) through a rim (location 2). The crystal core area (location 3) is surrounded by regions with enhanced abundances of (Th, U) at location 4, and Ba at locations 5 and 6.
440 mass spectra were recorded at a single location and yield chemical information about an ablated layer. By plotting the element intensities, one obtains intensity of the elements along the crater depth. Figure 3a shows the results of depth profiling analysis prepared for the major elements: O, Ca, P, Cl, and F. The element intensities are observed to decrease monotonically in a characteristic fashion observed typically in laser ablation studies by applying Gaussian laser beam profile. The intensity correlation curves of Ca, F, P with O prepared on the depth profiling data indicate negligible depth heterogeneities (Figure 3b) [32]. The intensities are linearly correlated with a Pearson coefficient larger than 0.98 and with the slope coefficients close to stoichiometric values expected for the apatite mineral. Figure 3c displays the measured intensity correlation between (Cl, H) and F. Whereas the Cl intensity correlates well with the F intensity, the correlation between the H and F intensities is weak with a Pearson coefficient of R2 = 0.50. The depth profiling analysis of H indicates that the H concentration is much larger at the surface and decreases with a much higher rate of depth than other elements. This observation indicates that the measured H concentration is rather a contamination due to the atmospheric water adsorbed at the uppermost apatite surface layers than OH in the apatite crystal.
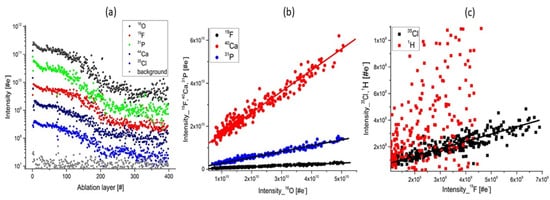
Figure 3. The depth profiling analysis prepared on a single ablation spot; (a) Variation of the mass peak intensities on several major elements related to apatite composition; (b) The plots of the intensity of the mass peak of Ca, P, F as function of the O intensity. The linear relationship indicates that these elements have their origin in apatite; (c) The intensity of Cl, H as function of F intensity. The linear correlation of Cl and F is observed. H and F are observed to be less correlated and the plot shows a wide distribution of data points. This is accounting for the presence of water adsorbed on the topmost sample surface.
To derive the hydrogen abundance in apatite, the (F, Cl) volatile halogen element abundances were obtained using the element intensity correlation analysis for the data set at each studied location and applying the correction coefficient for each element. The respective calibration coefficients were obtained from measurements of the geological standard (SRM 610). This method yields improved accuracy comparing with the integration method on the composed mass spectrum from one location [18]. With the (F, Cl) abundance values, the procedure used in the geological practise for determination of the OH abundance is applied. Taking XF (XF = CF/3.767, where CF is the concentration of F in apatite (wt.%) and XCl (XCl = CCl/6.809, where CCl is the concentration of Cl in apatite (wt.%) as the mole fraction of fluorapatite and chlorapatite, respectively, one can derive XH as the mole fraction of hydroxyapatite as follows: XH =1− XF − XCl. Inherent in these calculations is the assumption that the halogen site is filled with Cl, F and OH, only, and that the major constituents in apatite do not vary appreciably from calcium and phosphorus. The calculation may not be appropriate where considerable substitution of the Ca ion by other cations in apatite occurs. The analysis yields values for F, Cl and OH 3.39, 0.04 and 0.09 wt.%, respectively. These results agree with former studies where the fluorine content was observed to vary between 2.02 and 3.41 wt.% with a theoretical maximum value of 3.73 wt.% for apatite from carbonatite, phoscorite and pyroxenite rocks. The reported content of Cl was typically lower than 0.09 wt.% [47][50], in agreement with the results. Considering the ratio derived in the intensity correlation of Cl and F and calibration coefficient for Cl, again an uncertainty of about 20% is expected resulting from the uncertainty of the determination of the calibration coefficients. Furthermore, the measured H concentrations, when determined from the intensity correlation method, are about five times too large. The high values from the correlation method are accounted for by contaminations of the apatite sample surface through atmospheric water. Similar investigations can be conducted on the lunar surface. Several recent studies on lunar materials emphasize the importance of halogen components in understanding magmatic processes on the Moon. Apatite is thought to represent a record localising degassing during the final stages of the lunar magma ocean or later melt crystallisation [51], e.g., the analysis of the distribution of F, Cl, OH, including the isotope composition of Cl, can be an indicator of physical or chemical processes, such as degassing, while plasma cools down [52][53][54][55][56][57][58][59][60]. The volatile budget of lunar magmatic rocks can be derived this way [61]. The first apatites found in lunar samples were in the form of inclusions within minerals (pyroxferroite, fayalite, silica, ilmenite) [62][63][64][65]. Apatite also has the ability to incorporate other elements and molecular ions efficiently by substitution or adsorption onto its crystallite surface [66]. Halogens in the apatite crystal structure are used to determine the initial F and Cl concentrations of magmas and fugacity ratios [67]. In most magmatic rocks, the fluoroapatite component dominates over chlorine and hydroxylapatites [68]. Halogen abundances are important for understanding the fluid–rock interaction [69][70][71] and the formation of perchlorite in volcanic fumaroles [72][73][74].
Figure 4 displays element concentration maps for the investigated sample surface. The spatial heterogeneities of the element concentrations are readily observed both in the apatite crystal locations and outside the apatite area for several elements. Although the apatite crystal can be generally considered as highly pure, the systematic element concentration change at the trace element concentration levels can be observed and be an indicator of the environmental influence on the crystal growth (via element zoning). Microscopic intrusions are otherwise identified by the measurements of distinctly different chemical composition. Monovalent Na+, many divalent cations (Sr2+, Pb2+, Ba2+, Mn2+, etc.), trivalent (REE3+) and tetravalent cations (Th4+, U4+) are known to substitute for Ca in the apatite-group leading to a Ca deficiency in the apatite crystal. The phosphate ion (PO4)3− is commonly replaced by a variety of tetrahedral anion groups [(MnO4)3−, (SO4)3−, (SiO4)3−, and (CO3)3−]. The uptake of REEs in natural apatite is highest in the range of Nd-Gd. An increase in SiO2 content in the melt is expected to promote the coupled substitution: (REE)3+ + (SiO4)4− = Ca2+ + (PO4)3−, known as the britholite substitution reaction [47]. Figure 3 displays the Ca, P, O and F concentration distributions and the concentrations of main elements referenced to the oxygen concentration. There are no significant differences in concentration across the analysed surface upper right and lower left corners. At the upper right corner of the investigated area (see Figure 2), a change in chemical composition from the apatite mineral to another mineralogical phase via a rim transition is observed, whereas in the bottom left corner the presence of an inclusion of distinctly different composition is noted. Further, the Na, Mg and Si element concentrations are observed to decrease from the right to left side of the sample area, indicating the differences in the substitution rate of these elements as the crystal grew. At the rim the abundance of O decreases but no significant increase in the other elements can be seen. In some of the locations, the Sr concentrations are observed to undergo an oscillatory-like fashion and the concentrations of the elements Ce and La are observed to decrease in the direction from the crystal core to the rim. Behind the rim the intensities of La, Ba and Mg increase significantly. Similar correlations are observed in a few locations in the bottom left corner. The presence of a mineral other than apatite or the possible increase in element exchange within the apatite structure by substitution at Ca and P sites with F, Si, Sr, Mn, La, Ce can be determined from the element abundance ratios or distinct element concentration decrease [75][76][77][78][79]. The chemical maps data indicate that the heterogeneities occur rather systematically than randomly.
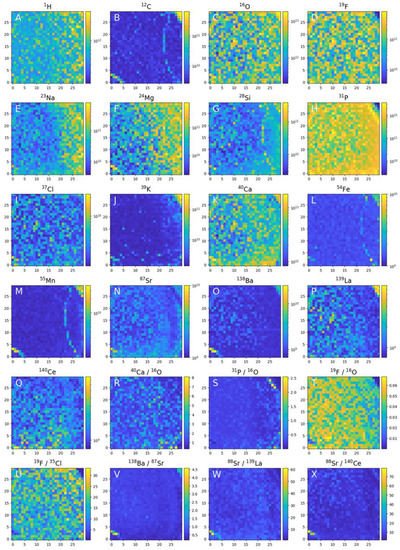
Figure 4. Chemical mapping of the 0.9 × 0.9 mm2 of the apatite crystal surface embedded in phoscorite rock. Element heterogeneities measured in 900 locations can be used to investigate element analysis, analysis of the neighbouring mineral phases and identification of grain size inclusion of distinct chemical composition with assessing their mineralogical content.
Variation of the trace elements, e.g., Na, Mg, Cl in the melt or fluid usually affects the uptake of REEs by apatite because they participate directly in coupled substitutions for the incorporation of REEs [80]. The observation of systematic variations in the F, Cl, H relative concentration ratios in apatite typically reflects the change of chemical equilibrium with temperature. Their analysis is helpful in understanding magmatic differentiation [67][81], as well as hydrothermal differentiation and can be used to determine volatile fractions at the planet formation phase [82][83][84]. The Sr, REE, Ba ions, measured in apatite crystal can be taken from the surrounding environment and fluids if present [75][76][77]. This capability allows us to analyse primary geological processes and a wide range of material transformations, including relevant timescales and rates. REE-rich mineral crystallisation influences REE content of residual magma and, together with the content of Sr in apatite, can yield the clue to crystallisation phases [78]. Observations of chemically zoned apatite via Cl, O, Sr and REE have been reported in several studies using SIMS, LA-ICPMS and optical analytical techniques [47][50][85][86]. This study is the first to report such measurements by laser ablation/ionisation mass spectrometry.
The researchers also observe an enhancement in abundances of several other elements (including Fe, Na, K, Ca, Mn and Si) in various locations. Calcite phase was identified behind the rim (see also right side, upper corner in Figure 2). Moreover, calcite intrusions are consistent with the presence of magnetite (Fe2+Fe3+2O4), olivine (MSiO4, where M = Ca, Fe, Mn, Ni, Mg), and are associated with carbonatites, e.g., dolomite CaMg(CO3)2, calcite CaCO3, gregoryite (Na,K)2CaCO3, ankerite, Ca(Fe2+,Mg)(CO3)2, nyerereite Na2Ca(CO3)2, or siderite FeCO3. This observation is consistent with the results of other analyses of Phalaborwa rocks [87][88]. The ternary elemental correlation, combined with other techniques, such as Raman and IR spectroscopic analysis, would give more detailed mineralogical classification when applied in in-situ investigations [12]. The current performance of the miniature LIMS instrument to study in-situ the chemical composition of apatite is sufficiently high to measure volatiles and nearly all relevant (F, P, Cl, Ca, Sr) trace elements, including REE, which allows for a systematic quantitative analysis of their distribution. The analysis of volatiles and elemental zoning in-situ will be important to investigate magmatic planetary transformations.
References
- Rohner, U.; Whitby, J.A.; Wurz, P. A miniature laser ablation time-of-flight mass spectrometer for in situ planetary exploration. Meas. Sci. Technol. 2003, 14, 2159–2164.
- Tulej, M.; Wiesendanger, R.; Riedo, A.; Knopp, G.; Wurz, P. Mass spectrometric analysis of the Mg plasma produced by double-pulse femtosecond laser irradiation. J. Anal. Atom. Spectrom. 2018, 33, 1292–1303.
- Wiesendanger, R.; Tulej, M.; Riedo, A.; Frey, S.; Shea, H.; Wurz, P. Improved detection sensitivity for heavy trace elements using a miniature laser ablation ionisation mass spectrometer. J. Anal. Atom. Spectrom. 2017, 32, 2182–2188.
- Riedo, A.; Grimaudo, V.; Lopez, A.C.; Tulej, M.; Wurz, P.; Broekmann, P. Novel 2D binning approach for advanced LIMS depth profiling analysis. J. Anal. Atom. Spectrom. 2019, 34, 1564–1570.
- Riedo, A.; Lukmanov, R.; Grimaudo, V.; Koning, C.; Ligterink, N.F.W.; Tulej, M.; Wurz, P. Improved plasma stoichiometry recorded by laser ablation ionization mass spectrometry using a double-pulse femtosecond laser ablation ion source. Rapid Commun. Mass Spectrom. 2021, 35, e9094.
- Neuland, M.B.; Meyer, S.; Mezger, K.; Riedo, A.; Tulej, M.; Wurz, P. Probing the Allende meteorite with a miniature laser-ablation mass analyser for space application. Planet Space Sci. 2014, 101, 196–209.
- Frey, S.; Wiesendanger, R.; Tulej, M.; Neuland, M.; Riedo, A.; Grimaudo, V.; Moreno-Garcia, P.; Lopez, A.C.; Mohos, M.; Hofmann, B.; et al. Chemical analysis of a lunar meteorite by laser ablation mass spectrometry. Planet Space Sci. 2020, 182, 104816.
- Grimaudo, V.; Moreno-Garcia, P.; Lopez, A.C.; Riedo, A.; Wiesendanger, R.; Tulej, M.; Gruber, C.; Lortscher, E.; Wurz, P.; Broekmann, P. Depth Profiling and Cross-Sectional Laser Ablation Ionization Mass Spectrometry Studies of Through-Silicon-Vias. Anal. Chem. 2018, 90, 5179–5186.
- Grimaudo, V.; Moreno-Garcia, P.; Riedo, A.; Meyer, S.; Tulej, M.; Neuland, M.B.; Mohos, M.; Gutz, C.; Waldvogek, S.R.; Wurz, P.; et al. Toward Three-Dimensional Chemical Imaging of Ternary Cu-Sn-Pb Alloys Using Femtosecond Laser Ablation/Ionization Mass Spectrometry. Anal. Chem. 2017, 89, 1632–1641.
- Grimaudo, V.; Moreno-Garcia, P.; Riedo, A.; Neuland, M.B.; Tulej, M.; Broekmann, P.; Wurz, P. High-Resolution Chemical Depth Profiling of Solid Material Using a Miniature Laser Ablation/Ionization Mass Spectrometer. Anal. Chem. 2015, 87, 2037–2041.
- Grimaudo, V.; Tulej, M.; Riedo, A.; Lukmanov, R.; Ligterink, N.F.W.; de Koning, C.; Wurz, P. UV post-ionization laser ablation ionization mass spectrometry for improved nm-depth profiling resolution on Cr/Ni reference standard. Rapid Commun. Mass Spectrom. 2020, 34, e8803.
- Neubeck, A.; Tulej, M.; Ivarsson, M.; Broman, C.; Riedo, A.; McMahon, S.; Wurz, P.; Bengtson, S. Mineralogical determination in situ of a highly heterogeneous material using a miniaturized laser ablation mass spectrometer with high spatial resolution. Int. J. Astrobiol. 2016, 15, 133–146.
- Tulej, M.; Lukmanov, R.; Grimaudo, V.; Riedo, A.; de Koning, C.; Ligterink, N.; Neubeck, A.; Ivarsson, M.; McMahon, S.; Wurz, P. Determination of microscopic mineralogy of inclusion in an amygdaloidal pillow basalt by fs-LIMS. J. Anal. At. Spectrom. 2021, 36, 80–91.
- Riedo, A.; de Koning, C.; Stevens, A.H.; Cockell, C.S.; McDonald, A.; Lopez, A.C.; Grimaudo, V.; Tulej, M.; Wurz, P.; Ehrenfreund, P. The Detection of Elemental Signatures of Microbes in Martian Mudstone Analogs Using High Spatial Resolution Laser Ablation Ionization Mass Spectrometry. Astrobiology 2020, 20, 1224–1235.
- Wiesendanger, R.; Wacey, D.; Tulej, M.; Neubeck, A.; Ivarsson, M.; Grimaudo, V.; Moreno-Garcia, P.; Cedeno-Lopez, A.; Riedo, A.; Wurz, P. Chemical and optical identification of micrometer-sized 1.9 billion-year-old fossils by combining a miniature laser ablation ionization mass spectrometry system with an optical microscope. Astrobiology 2018, 18, 1071–1080.
- Meyer, S.; Riedo, A.; Neuland, M.B.; Tulej, M.; Wurz, P. Fully automatic and precise data analysis developed for time-of-flight mass spectrometry. J. Mass Spectrom. 2017, 52, 580–590.
- Wiesendanger, R.A.; Tulej, M.; Grimaudo, V.; Cedeno-Lopez, A.C.; Lukmanov, R.; Riedo, A.; Wurz, P. A method for improvement of mass resolution and isotope accuracy for laser ablation time-of-flight mass spectrometers. J. Chemometr. 2019, 33, e3081.
- Tulej, M.; Neubeck, A.; Riedo, A.; Lukmanov, R.; Grimaudo, V.; Ligterink, N.F.W.; Ivarsson, M.; Bach, W.; de Koning, C.; Wurz, P. Isotope abundance ratio measurements using femtosecond laser ablation ionization mass spectrometry. J. Mass Spectrom. 2020, 55, e4660.
- Tulej, M.; Ligterink, N.F.W.; de Koning, C.; Grimaudo, V.; Lukmanov, R.; Keresztes Schmidt, P.; Riedo, A.; Wurz, P. Current Progress in Femtosecond Laser Ablation/Ionisation Time-of-Flight Mass Spectrometry. Appl. Sci. 2021, 11, 2562.
- Riedo, A.; Neuland, M.; Meyer, S.; Tulej, M.; Wurz, P. Coupling of LMS with a fs-laser ablation ion source: Elemental and isotope composition measurements. J. Anal. Atom. Spectrom. 2013, 28, 1256–1269.
- Neuland, M.B.; Grimaudo, V.; Mezger, K.; Moreno-Garcia, P.; Riedo, A.; Tulej, M.; Wurz, P. Quantitative measurement of the chemical composition of geological standards with a miniature laser ablation/ionization mass spectrometer designed for in situ application in space research. Meas. Sci. Technol. 2016, 27, 035904.
- Tulej, M.; Riedo, A.; Neuland, M.B.; Meyer, S.; Wurz, P.; Thomas, N.; Grimaudo, V.; Moreno-Garcia, P.; Broekmann, P.; Neubeck, A.; et al. CAMAM: A Miniature Laser Ablation Ionisation Mass Spectrometer and Microscope-Camera System for In Situ Investigation of the Composition and Morphology of Extraterrestrial Materials. Geostand. Geoanal. Res. 2014, 38, 441–466.
- Riedo, A.; Bieler, A.; Neuland, M.; Tulej, M.; Wurz, P. Performance evaluation of a miniature laser ablation time-of-flight mass spectrometer designed for in situ investigations in planetary space research. J. Mass Spectrom. 2013, 48, 1–15.
- Maurice, S.; Wiens, R.C.; Saccoccio, M.; Barraclough, B.; Gasnault, O.; Forni, O.; Mangold, N.; Baratoux, D.; Bender, S.; Berger, G.; et al. The ChemCam Instrument Suite on the Mars Science Laboratory (MSL) Rover: Science Objectives and Mast Unit Description. Space Sci. Rev. 2012, 170, 95–166.
- Tulej, M.; Iakovleva, M.; Leya, I.; Wurz, P. A miniature mass analyser for in-situ elemental analysis of planetary material-performance studies. Anal. Bioanal. Chem. 2011, 399, 2185–2200.
- Riedo, A.; Tulej, M.; Rohner, U.; Wurz, P. High-speed microstrip multi-anode multichannel plate detector system. Rev. Sci. Instrum. 2017, 88, 045114.
- Sinha, M.P.; Wadsworth, M. Miniature focal plane mass spectrometer with 1000-pixel modified-CCD detector array for direct ion measurement. Rev. Sci. Instrum. 2005, 76, 025103.
- Riedo, A.; Meyer, S.; Heredia, B.; Neuland, M.B.; Bieler, A.; Tulej, M.; Leya, I.; Iakovleva, M.; Mezger, K.; Wurz, P. Highly accurate isotope composition measurements by a miniature laser ablation mass spectrometer designed for in situ investigations on planetary surfaces. Planet Space Sci. 2013, 87, 1–13.
- Riedo, A.; Grimaudo, V.; Aerts, J.W.; Lukmanov, R.; Tulej, M.; Broekmann, P.; Lindner, R.; Wurz, P.; Ehrenfreund, P. Laser Ablation Ionization Mass Spectrometry: A Space Prototype System for In Situ Sulphur Isotope Fractionation Analysis on Planetary Surfaces. Front. Astron. Space 2021, 8, 726373.
- Lopez, D.M.; Grimaudo, V.; Prone, G.; Flisch, A.; Riedo, A.; Zboray, R.; Luthi, T.; Mayor, M.; Fussenegger, M.; Broekmann, P.; et al. Automated, 3-D and Sub-Micron Accurate Ablation-Volume Determination by Inverse Molding and X-Ray Computed Tomography. Adv. Sci. 2022, 9, 2200136.
- Lopez, A.C.; Grimaudo, V.; Riedo, A.; Tulej, M.; Wiesendanger, R.; Lukmanov, R.; Moreno-Garcia, P.; Lortscher, E.; Wurz, P.; Broekmann, P. Three-Dimensional Composition Analysis of SnAg Solder Bumps Using Ultraviolet Femtosecond Laser Ablation Ionization Mass Spectrometry. Anal. Chem. 2020, 92, 1355–1362.
- Grimaudo, V.; Moreno-Garcia, P.; Riedo, A.; Lopez, A.C.; Tulej, M.; Wiesendanger, R.; Wurz, P.; Broekmann, P. Review-Laser Ablation Ionization Mass Spectrometry (LIMS) for Analysis of Electrodeposited Cu Interconnects. J. Electrochem. Soc. 2018, 166, D3190–D3199.
- Azov, V.A.; Mueller, L.; Makarov, A.A. Laser ionization mass spectrometry at 55: Quo Vadis? Mass Spectrom. Rev. 2020, 21669, 1–52.
- Sauer, S.; Freiwald, A.; Maier, T.; Kube, M.; Reinhardt, R.; Kostrzewa, M.; Geider, K. Classification and Identification of Bacteria by Mass Spectrometry and Computational Analysis. PLoS ONE 2008, 3, e2843.
- Behrmann, J.; Etmann, C.; Boskamp, T.; Casadonte, R.; Kriegsmann, J.; Maass, P. Deep learning for tumor classification in imaging mass spectrometry. Bioinformatics 2018, 34, 1215–1223.
- Lukmanov, R. Characterization of Bio-Organic and Inorganic Chemistries Using Laser-Based Mass Spectrometry. Ph. D. Thesis, University Bern, Bern, Switzerland, 2021.
- Lukmanov, R.A.; Tulej, M.; Ligterink, N.F.W.; De Koning, C.; Riedo, A.; Grimaudo, V.; Neubeck, A.; Wacey, D.; Wurz, P. Chemical identification of microfossils from the 1.88-Ga Gunflint chert: Towards empirical biosignatures using laser ablation ionization mass spectrometer. J. Chemometr. 2021, 35, e3370.
- Lukmanov, R.A.; Riedo, A.; Wacey, D.; Ligterink, N.F.W.; Grimaudo, V.; Tulej, M.; de Koning, C.; Neubeck, A.; Wurz, P. On Topological Analysis of fs-LIMS Data. Implications for in Situ Planetary Mass Spectrometry. Front. Artif. Intell. 2021, 4, 668163.
- Cohen, B.A.; Miller, J.S.; Li, Z.H.; Swindle, T.D.; French, R.A. The Potassium-Argon Laser Experiment (KArLE): In Situ Geochronology for Planetary Robotic Missions. Geostand. Geoanal. Res. 2014, 38, 421–439.
- Neuland, M.B.; Mezger, K.; Riedo, A.; Tulej, M.; Wurz, P. The chemical composition and homogeneity of the Allende matrix. Planet Space Sci. 2021, 204, 105251.
- Allen, C.C.; Westall, F.; Schelble, R.T. Importance of a Martian Hematite Site for Astrobiology. Astrobiology 2001, 1, 111–123.
- Belousova, E.A.; Griffin, W.L.; O’Reilly, S.Y.; Fisher, N.I. Apatite as an indicator mineral for mineral exploration: Trace-element compositions and their relationship to host rock type. J. Geochem. Explor. 2002, 76, 45–69.
- Bergman, S.C.; Ritter, C.J.; Zamierowski, E.E.; Cothern, C.R. Use of Zonal Centrifugation in Delineating Trace-Element Distributions in Sewage Sludges from the Dayton, Ohio, Area. J. Environ. Qual. 1979, 8, 416–422.
- Boudreau, A.E.; Mathez, E.A.; Mccallum, I.S. Halogen Geochemistry of the Stillwater and Bushveld Complexes—Evidence for Transport of the Platinum-Group Elements by Cl-Rich Fluids. J. Petrol. 1986, 27, 967–986.
- Sha, L.K.; Chappell, B.W. Apatite chemical composition, determined by electron microprobe and laser-ablation inductively coupled plasma mass spectrometry, as a probe into granite petrogenesis. Geochim. Cosmochim. Acta 1999, 63, 3861–3881.
- Wu, F.Y.; Yang, Y.H.; Li, Q.L.; Mitchell, R.H.; Dawson, J.B.; Brandl, G.; Yuhara, M. In situ determination of U-Pb ages and Sr-Nd-Hf isotopic constraints on the petrogenesis of the Phalaborwa carbonatite Complex, South Africa. Lithos 2011, 127, 309–322.
- Milani, L.; Bolhar, R.; Frei, D.; Harlov, D.E.; Samuel, V.O. Light rare earth element systematics as a tool for investigating the petrogenesis of phoscorite-carbonatite associations, as exemplified by the Phalaborwa Complex, South Africa. Miner. Depos. 2017, 52, 1105–1125.
- Dawson, J.B.; Hinton, R.W. Trace-element content and partitioning in calcite, dolomite and apatite in carbonatite, Phalaborwa, South Africa. Mineral. Mag. 2003, 67, 921–930.
- Giebel, R.J.; Gauert, C.D.K.; Marks, M.A.W.; Costin, G.; Markl, G. Multi-stage formation of REE minerals in the Palabora Carbonatite Complex, South Africa. Am. Mineral. 2017, 102, 1218–1233.
- Decree, S.; Cawthorn, G.; Deloule, E.; Mercadier, J.; Frimmel, H.; Baele, J.M. Unravelling the processes controlling apatite formation in the Phalaborwa Complex (South Africa) based on combined cathodoluminescence, LA-ICPMS and in-situ O and Sr isotope analyses. Contrib. Mineral. Petrol. 2020, 175, 34.
- Gargano, A.; Sharp, Z.; Shearer, C.; Simon, J.I.; Halliday, A.; Buckley, W. The Cl isotope composition and halogen contents of Apollo-return samples. Proc. Natl. Acad. Sci. USA 2020, 117, 23418–23425.
- Liu, X.; Wei, H.Z.; Li, Y.C.; Williams-Jones, A.E.; Lu, J.J.; Jiang, S.Y.; Dong, G.; Ma, J.; Eastoe, C.J. Chlorine isotope mantle heterogeneity: Constraints from theoretical first-principles calculations. Chem. Geol. 2021, 572, 120193.
- Barnes, J.D.; Sharp, Z.D. Chlorine Isotope Geochemistry. Non-Tradit. Stable Isot. 2017, 82, 345–377.
- Tartese, R.; Anand, M.; Joy, K.H.; Franchi, I.A. H and Cl isotope systematics of apatite in brecciated lunar meteorites Northwest Africa 4472, Northwest Africa 773, Sayh al Uhaymir 169, and Kalahari 009. Meteorit. Planet. Sci. 2014, 49, 2266–2289.
- Sharp, Z.D.; Shearer, C.K.; McKeegan, K.D.; Barnes, J.D.; Wang, Y.Q. The Chlorine Isotope Composition of the Moon and Implications for an Anhydrous Mantle. Science 2010, 329, 1050–1053.
- Boyce, J.W.; Treiman, A.H.; Guan, Y.B.; Ma, C.; Eiler, J.M.; Gross, J.; Greenwood, J.P.; Stolper, E.M. The chlorine isotope fingerprint of the lunar magma ocean. Sci. Adv. 2015, 1, e1500380.
- Treiman, A.H.; Boyce, J.W.; Gross, J.; Guan, Y.B.; Eiler, J.M.; Stolper, E.M. Phosphate-halogen metasomatism of lunar granulite 79215: Impact-induced fractionation of volatiles and incompatible elements. Am. Mineral. 2014, 99, 1860–1870.
- Potts, N.J.; Barnes, J.J.; Tartese, R.; Franchi, I.A.; Anand, M. Chlorine isotopic compositions of apatite in Apollo 14 rocks: Evidence for widespread vapor-phase metasomatism on the lunar nearside similar to 4 billion years ago. Geochim. Cosmochim. Acta 2018, 230, 46–59.
- Wang, Y.; Hsu, W.B.; Guan, Y.B. An extremely heavy chlorine reservoir in the Moon: Insights from the apatite in lunar meteorites. Sci. Rep. 2019, 9, 5727.
- Sharp, Z.; Williams, J.; Shearer, C.; Agee, C.; McKeegan, K. The chlorine isotope composition of Martian meteorites 2. Implications for the early solar system and the formation of Mars. Meteorit. Planet. Sci. 2016, 51, 2111–2126.
- Boyce, J.W.; Liu, Y.; Rossman, G.R.; Guan, Y.B.; Eiler, J.M.; Stolper, E.M.; Taylor, L.A. Lunar apatite with terrestrial volatile abundances. Nature 2010, 466, 466–469.
- Fuchs, L.H.; Olsen, E. Composition of Metal in Type Iii Carbonaceous Chondrites and Its Relevance to Source-Assignment of Lunar Metal. Earth Planet Sci. Lett. 1973, 18, 379–384.
- Reed, G.W.; Jovanovi, S.; Fuchs, L.H. Fluorine and Other Trace Elements in Lunar Plagioclase Concentrates. Earth Planet Sci. Lett. 1971, 11, 354–358.
- Reed, G.W.; Jovanovi, S.; Fuchs, L.H. Trace Elements and Accessory Minerals in Lunar Samples. Science 1970, 167, 501–503.
- Fuchs, L.H. Orthopyroxene-Plagioclase Fragments in Lunar Soil from Apollo-12. Science 1970, 169, 866–868.
- Sommerauer, J.; Katzlehnert, K. Trapped Phosphate Melt Inclusions in Silicate-Carbonate-Hydroxyapatite from Comb-Layer Alvikites from the Kaiserstuhl Carbonatite Complex (Sw-Germany). Contrib. Mineral. Petrol. 1985, 91, 354–359.
- Piccoli, P.; Candela, P. Apatite in Felsic Rocks—A Model for the Estimation of Initial Halogen Concentrations in the Bishop Tuff (Long Valley) and Tuolumne Intrusive Suite (Sierra-Nevada Batholith) Magmas. Am. J. Sci. 1994, 294, 92–135.
- Piccoli, P.M.; Candela, P.A. Apatite in igneous systems. Rev. Mineral. Geochem. 2002, 48, 255–292.
- John, T.; Layne, G.D.; Haase, K.M.; Barnes, J.D. Chlorine isotope evidence for crustal recycling into the Earth’s mantle. Earth Planet Sci. Lett. 2010, 298, 175–182.
- Kusebauch, C.; John, T.; Barnes, J.D.; Klugel, A.; Austrheim, H.O. Halogen Element and Stable Chlorine Isotope Fractionation Caused by Fluid-Rock Interaction (Bamble Sector, SE Norway). J. Petrol. 2015, 56, 299–324.
- Kusebauch, C.; John, T.; Whitehouse, M.J.; Klemme, S.; Putnis, A. Distribution of halogens between fluid and apatite during fluid-mediated replacement processes. Geochim. Cosmochim. Acta 2015, 170, 225–246.
- Bellucci, J.J.; Whitehouse, M.J.; John, T.; Nemchin, A.A.; Snape, J.F.; Bland, P.A.; Benedix, G.K. Halogen and Cl isotopic systematics in Martian phosphates: Implications for the Cl cycle and surface halogen reservoirs on Mars. Earth Planet Sci. Lett. 2017, 458, 192–202.
- Sch’auble, E.A.; Rossman, G.R.; Taylor, H.P. Theoretical estimates of equilibrium chlorine-isotope fractionations. Geochim. Cosmochim. Acta 2003, 67, 3267–3281.
- Sharp, Z.D.; Barnes, J.D.; Fischer, T.P.; Halick, M. An experimental determination of chlorine isotope fractionation in acid systems and applications to volcanic fumaroles. Geochim. Cosmochim. Acta 2010, 74, 264–273.
- Pan, Y.M.; Fleet, M.E. Compositions of the apatite-group minerals: Substitution mechanisms and controlling factors. Rev. Mineral. Geochem. 2002, 48, 13–49.
- Penel, G.; Leroy, G.; Rey, C.; Bres, E. MicroRaman spectral study of the PO4 and CO3 vibrational modes in synthetic and biological apatites. Calcif. Tissue Int. 1998, 63, 475–481.
- Antonakos, A.; Liarokapis, E.; Leventouri, T. Micro-Raman and FTIR studies of synthetic and natural apatites. Biomaterials 2007, 28, 3043–3054.
- Pan, L.C.; Hu, R.Z.; Wang, X.S.; Bi, X.W.; Zhu, J.J.; Li, C.S. Apatite trace element and halogen compositions as petrogenetic-metallogenic indicators: Examples from four granite plutons in the Sanjiang region, SW China. Lithos 2016, 254, 118–130.
- Groves, D.I.; Vielreicher, N.M. The Phalabowra (Palabora) carbonatite-hosted magnetite-copper sulfide deposit, South Africa: An end member of the iron-oxide copper-gold-rare earth element deposit group? Min. Depos. 2001, 36, 189–194.
- Pan, Y.; Fleet, M.E. Composition of the apatite-group minerals: Substitution mechanism and controlling factors. In Phosphates: Geochemical, Geobiological and Material Importance; Kohn, M.J., Rakovan, J., Hughes, J.M., Eds.; Mineralogical Society of America: Washington, DC, USA; Volume 48.
- Rasmussen, K.L.; Mortensen, J.K. Magmatic petrogenesis and the evolution of (F:Cl:OH) fluid composition in barren and tungsten skarn-associated plutons using apatite and biotite compositions: Case studies from the northern Canadian Cordillera. Ore Geol. Rev. 2013, 50, 118–142.
- Tartese, R.; Anand, M.; Barnes, J.J.; Starkey, N.A.; Franchi, I.A.; Sano, Y. The abundance, distribution, and isotopic composition of Hydrogen in the Moon as revealed by basaltic lunar samples: Implications for the volatile inventory of the Moon. Geochim. Cosmochim. Acta 2013, 122, 58–74.
- Barnes, J.J.; Franchi, I.A.; Anand, M.; Tartese, R.; Starkey, N.A.; Koike, M.; Sano, Y.; Russell, S.S. Accurate and precise measurements of the D/H ratio and hydroxyl content in lunar apatites using NanoSIMS. Chem. Geol. 2013, 337, 48–55.
- Candela, P.A. Toward a Thermodynamic Model for the Halogens in Magmatic Systems—An Application to Melt Vapor Apatite Equilibria. Chem. Geol. 1986, 57, 289–301.
- Jolliff, B.L.; Papike, J.J.; Shearer, C.K. Inter-Crystal and Intra-Crystal Ree Variations in Apatite from the Ingersoll, Bob Pegmatite, Black Hills, South-Dakota. Geochim. Cosmochim. Acta 1989, 53, 429–441.
- Coulson, I.M.; Chambers, A.D. Patterns of zonation in rare-earth-bearing minerals in nepheline syenites of the north Qoroq Center, South Greenland. Can. Mineral. 1996, 34, 1163–1178.
- Eriksson, K.A. Sedimentation Patterns in the Barberton Mountain Land, South-Africa, and the Pilbara Block, Australia—Evidence for Archean Rifted Continental Margins. Tectonophysics 1982, 81, 179–193.
- Giebel, R.J.; Marks, M.A.W.; Gauert, C.D.K.; Marid, G. A model for the formation of carbonatite-phoscorite assemblages based on the compositional variations of mica and apatite from the Palabora Carbonatite Complex, South Africa. Lithos 2019, 324, 89–104.
More
Information
Subjects:
Geochemistry & Geophysics
Contributor
MDPI registered users' name will be linked to their SciProfiles pages. To register with us, please refer to https://encyclopedia.pub/register
:
View Times:
958
Revisions:
2 times
(View History)
Update Date:
23 Aug 2022
Table of Contents


Notice
You are not a member of the advisory board for this topic. If you want to update advisory board member profile, please contact office@encyclopedia.pub.
OK
Confirm
Only members of the Encyclopedia advisory board for this topic are allowed to note entries. Would you like to become an advisory board member of the Encyclopedia?
Yes
No
${ textCharacter }/${ maxCharacter }
Submit
Cancel
Back
Comments
${ item }
|
${ item.createdUser.fullName }
${ item.createdAt }
${ item.vote }
${ item.reply }
Delete
${ reply.createdUser.fullName }
${ reply.createdAt }
${ reply.vote }
Delete
There is no reply to this comment~
${ item.replyTextCharacter }/${ item.replyMaxCharacter }
Submit
Cancel
More
No more~
There is no comment~
${ textCharacter }/${ maxCharacter }
Submit
Cancel
${ selectedItem.replyTextCharacter }/${ selectedItem.replyMaxCharacter }
Submit
Cancel
Confirm
Are you sure to Delete?
Yes
No