Your browser does not fully support modern features. Please upgrade for a smoother experience.
Please note this is a comparison between Version 1 by Marek Tulej and Version 2 by Catherine Yang.
Laser ablation/ionisation mass spectrometer (named LMS) demonstrated its high performance for the chemical analysis of micrometre-sized objects, such as mineralogical grains, layers, biologically relevant films and microscopic fossils.
- planetary exploration
- in situ chemical analysis
- chemical mapping
1. Laser Mass Spectrometer (LMS)
A miniature laser ablation/ionisation time-of-flight mass analyser (named LMS) system has been the subject of development in theour laboratory over the last two decades [1][56]. After several improvements and upgrades of the ion optical system, detection and acquisition systems, and improvements of the measurement protocols, the current instrument can be applied to a sensitive analysis of soils and rocks [2][3][4][5][70,71,72,73]. The surface chemical imaging and 3D chemical analysis by adding depth profiling measurements can be conducted routinely with sensitivity down to a few parts per thousand (per mil) levels, a few micrometre lateral and sub-micrometre vertical resolution [6][7][8][9][10][11][74,75,76,77,78,79]. LMS demonstrated its high performance for the chemical analysis of micrometre-sized objects, such as mineralogical grains, layers, biologically relevant films and microscopic fossils [12][13][14][15][80,81,82,83]. The measurement protocols allowed more accurate measurements of the isotope abundance and the improvements of overall chemical composition quantification [16][17][18][19][20][84,85,86,87,88].
Figure 1a shows schematic diagram illustrating the principle of operation of the LMS instrument. A focused laser radiation is used to remove a thin layer of material from the surface. The laser ion source parameters (e.g., pulse energy, radiation wavelength) are tuned in such a way that atomisation and ionisation of the sample material is close to atomic stoichiometric ratios as they are present in the material and the atomic concentrations reflect the element concentrations of the removed surface layer. To improve the quantitative performance of the measurement, one can conduct, in parallel, a measurement on standard research material (SRM) to obtain relative sensitivity coefficients (RSCs) and correct for the different ionisation yields of elements at the applied laser ablation ion source conditions [21][89]. The atomic ions formed in the ablation process are temporally and spatially separated, according to their mass to charge ratio by a time-of-flight (TOF) mass analyser and recorded by the ion detector (multichannel plate, MCP) as a function of time of arrival into the detector. This is arranged by an ion optical system, which confines, focusses and transmits the ions from the ablation spot through the field-free region, reflectron and field-free region again to an MCP ion detector. The photograph of the mass analyser is shown in Figure 1b, also indicating the typical dimensions of the mass analyser without the laser optical system. Figure 1c shows a possible schematic of the laser mass spectrometer for space application (see also [22][58]). The dimension of a compact instrument, combining mass analyser, laser optical system with a microchip laser, including instrument compartment, are about 400 mm × 200 mm, an instrument weight of about 13 kg, with an average power consumption of about 45 W (all electronics included). These parameters can be further optimised to meet the technical requirements on a rover or a lander platform. Currently, miniature pulsed laser systems are available commercially. Nevertheless, these systems are typically ns- or sub-ns lasers. Miniature fs-laser systems are not available until now but with progress in fibre technology miniaturization of these systems is also expected in near future.
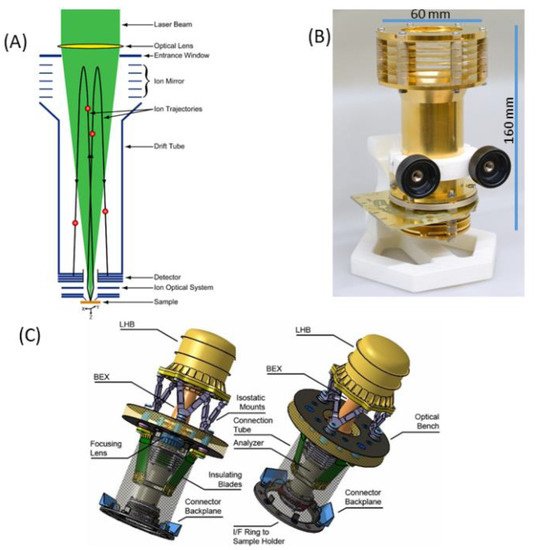
Figure 1. Schematic diagram of a miniature LMS with key parts labelled (A), an image of the mass analyser with its dimensions (B) and a possible design of a space instrument with an optical part (optical system with a microchip laser) attached to an optical bench (interface), introducing a focused laser radiation from the reflectron site (C).
The mass analyser delivers multi-elemental composition information of the ablated surface layer and interrogated surface area/volume for each applied laser pulse. The mass spectrometric analysis involves transformation from the time scale to the mass scale to assign measured mass ion peaks to the corresponding elements (isotopes). The mass peak integration in the time spectrum yields the number of measured ions, and the measurement of all atomic ions provides the means to derive the atomic and isotope concentrations, respectively. The detailed procedure used for the analysis of the mass spectra can be found in theour previous publication together with the evaluation of the accuracies of the applied methods [16][84]. Although the instrument is capable of measuring almost all elements with the exception of rare gas elements, its sensitivity can vary depending on the laser ablation ion source parameters, including laser pulse duration, radiation wavelength, pulse energy, laser irradiance and fluence, and physical and chemical material properties [19][87]. These so-called measurement fractionation effects can be generally minimised by selecting a short laser pulse duration (preferably femtosecond laser pulses) and a short laser radiation wavelength (preferably in the UV or VUV spectral range) at sufficiently high laser pulse energy and irradiance [21][89]. The LMS instrument has an optimised ion transmission close to 100%, thus the fractionation effects due to the mass analyser are considered to be negligible [1][56]. The current LMS system allows sensitive studies on geological samples and quantitative or semiquantitative chemical composition analysis, depending on if in parallel relevant standard materials are used or not [20][21][88,89]. Owing to the typically observed dynamic range of about 105, detection limits of ten (or better) ppm (parts per million) in atomic fractions can be achieved depending on the efficiency of the atomic ionisation [5][20][21][23][57,73,88,89]. The quantitative element analysis can be delivered down to ppm levels [20][24][29,88]. Improved detection capabilities can be further achieved with a multi-anode detector system and by applying a high voltage pulser to hinder atomic ions with the highest concentrations from reaching the detector [3][25][26][71,90,91]. The measurement of isotope concentrations is a unique capability of the LMS instrument. TOur studies show that the accuracy and precision of the isotope abundance determination depends on the isotope concentration (atomic fractions) and can be at per mil level if the isotope concentrations are larger than 10–50 ppm [27][28][59,92]. Further improvements to the accuracy and precision of the isotope ratio determination was achieved by applying the isotope intensity correlation method and spectra filtering [17][18][85,86]. SOur studies have demonstrated sufficiently high accuracy and precision in the determination of the Pb, S and Ni isotope ratios so that isotope fractionation effects can examined for Pb-Pb dating (both accuracy and precision at a few per mill level) [28][92], biologically relevant fractionation of the S isotopes (both accuracy and precision at per mill level) [29][93], or both bio-relevant or geological fractionation of the Ni isotopes (both accuracy and precision at per mill level) [18][86].
Sub-micrometre vertical and micrometre lateral spatial resolution can be maintained with the control of laser ion source parameters (flexible focussing optics, laser pulse energy tuning) [30][31][32][94,95,96]. The measurements can be performed on raw samples and do not require the application of advanced surface preparation methods. Very recent reviews describe the current progress in development of various LIMS systems, also providing details of the design and operation, as well as reviewing numerous LIMS studies on geological, meteoritic and biological samples along with applications to material science conducted by groups developing LIMS systems [19][33][87,97].
Through chemical surface mapping, one can analyse many locations experimentally, which provides a large number of mass spectra frequently exceeding the 10 000′s. The identification of compounds in the measured spectra involves statistical analysis. Several earlier studies applied supervised machine learning principles for the rapid identification of microorganisms [34][98] or tumour [35][99] from mass spectrometric data collected in the chemical imaging of the sample surface. Recently, thwe researchers hhave introduced unsupervised data reduction methods capable of recovering groups of spectra that share a significant level of similarity [36][100]. The mass spectra encode the necessary information about microscopic structures, minerals, chemical compounds and other heterogeneities within the surface, but due to the high dimensionality of the analysis problem, with each additional mass adding one dimension, the direct mass spectrometric analysis is laborious. Applying dimensionality reduction (PCA, SVD) and manifold learning techniques (e.g., UMAP, t-SNE), one can capture essential data patterns based on their spectral similarities. This analysis method is based on the principle that spectra recorded from the same chemical compound are similar, whereas spectra recorded from different chemical compounds, for example two different minerals, will share only little to no similarity. The data can, therefore, be grouped into clusters of spectra with a similar chemical fingerprint. One can visualise these relationships by embedding the dataset into a low dimensional space, e.g., 2D or 3D, and representing each spectrum with a node. Similar spectra will be embedded close to each other; hence, for each chemical compound present in the dataset a cluster will be formed. Using clustering algorithms (e.g., DBSCAN, HDBSCAN) the different clusters can be retrieved from the embedding, and labels can be assigned to the spectra, according to which cluster they belong to. Instead of analysing the dataset as a whole and trying to identify different compounds, one can now simply analyse the data from each cluster individually through basic spectrum analysis, which allows us to identify the corresponding compounds and, therefore, determine the composition of the investigated sample. This method is a great tool for geological samples to identify different mineral phases but can in principle be applied to any data obtained from different compounds, as long as the spectra contain more or less pure contributions from only one of the present compounds (no mixtures).
The method was successfully applied to the Gunflint chert, a 1.88 Ga quartz sample hosting remnants of Precambrian microbes in the form of microfossils [37][38][101,102]. Three distinct clusters were retrieved, which were later identified as the quartz cluster, the microfossils cluster and a third cluster containing spectra from inclusions with higher metallicity. LMS is capable of recording the chemical signatures of microfossils in geological samples, and by applying spectral similarity clustering the interesting spectra can be quickly identified even in large datasets.
While comparing with the other space and space prototype instrumentation designed for elemental analysis, LMS offers several advantages and improvements. Like LIBS and COSMORBITRAP instruments, LMS can be used for a rapid remote analysis without sample preparation. The current LMS instrument offers increasingly higher sensitivity and element detection limits down to ppm or better and can be used to measure the accurate isotope concentrations of several elements. Contrary to LIBS, LMS requires a dedicated vacuum system for the mass analyser operation and ion detector system when the investigations would be conducted on Mars. With a time-of-flight mass analyser, all atomic ions can be measured for each applied laser pulse allowing for robust multielement measurement capabilities. In the present applications, the fast data acquisition cycle allows measurement of 1000 spectra per second. However, owing to the limited mass resolution (m/∆m = 500), the isobaric interferences, due to the presence of the isotope of other elements or molecular clusters, cannot be resolved directly contrary to the COSMORBITRAP instrument. However, the contribution due to other atomic isotopes can be derived by considering the natural isotope composition, and the possible influence due to isobaric clusters can be inferred from the overall cluster appearance in the mass spectrum. To reduce these latter contaminations, a double pulse laser ablation/ionisation ion source was introduced, where after the first laser pulse used for the sample ablation, a second pulse is applied to heat up the generated plasma plume and reduce post ablation plasma chemistry and cluster production [2][70].
High spatial resolution chemical imaging and depth profiling analysis down to micrometre level is routinely demonstrated by LMS and can, in principle, also be achieved with other instruments. By employing a microscope camera system in parallel to the LMS measurements, context surface imaging of the areas around the investigated spots can be recorded, helping with the interpretation of the mass spectrometric results and allowing for an improved analysis of physical and chemical properties of the surface [39][60].
2. Geochemical Analysis with LMS
A short summary of the mass spectrometric studies of a few geological materials listed here serves as examples of possible investigations, which could be carried out on planetary surfaces with the current space-borne mass spectrometric instruments, including theour laser mass spectrometer LMS. Several geochemical analyses conducted with LMS demonstrate the capabilities of the instrument to investigate element heterogeneities and contribute to the normative mineralogy of meteoritic samples, trace element analysis in apatite crystal and zircon grains, and contribute to the identification of element zoning and magma cooling mechanisms and the determination of the crystallisation temperatures and dating. Finally, the instrument is also capable of measuring micrometre-sized inclusions, putative microscopic fossils and stromatolite films in the sedimentary rocks and contribute to the characterisation of the ancient environments, characterisation of biosignature and the effects of weathering and mineral transformation (calcite carbonate, aragonite and silica chert).
2.1. Meteoritic Samples
2.1.1. Allende
The Allende meteorite is composed of carbonaceous chondrite material irregularly shaped white calcium aluminium inclusions (CAI) and rounded chondrules in a dark matrix. The CAI are composed of minerals, which are believed to have condensed at high temperatures. The mass spectrometric studies were conducted initially at 138 locations on the Allende sample surface. The concentrations of numerous elements, including C, Mg, Al, Si, S, Ca, Sc, Ti, V, Cr, Mn, Fe, Co and Ni, were determined in these studies. The concentrations of the mineral forming elements Mg, Si, Fe, Ca and Al were observed to vary within 10 % between different locations, and variations of elements Ti, V, Ni and Sc were significantly larger. The latter are refractory elements preferentially contained in refractory chondrules. Furthermore, an enrichment in the lithophile elements Ca, Al and Ti, compared to the siderophile elements Co and Ni and compared to CI chondrites could be observed [6][74]. The matrix material was observed to be depleted in volatile elements. In follow up studies on the Allende matrix composition, the concentration of C, O, S, Na, K, Li, Mn, P, Cr, Si, Fe, Mg, Ni, Co, V, Ca, Ti, Al and Sc elements were measured together with their spatial variability on different scales from 50 μm to 0.5 mm [40][103]. With the results obtained from the measurements at 1651 locations, the presence of an olivine-rich composition for the matrix was determined by analysing the n(Si)/(n(Mg) + n(Fe)) dependence, where n(X) denotes the concentration of element X. In addition, the components of Mg-Fe-rich minerals could be identified and the analysis around the chondrules location indicated the presence of grain-sized minerals with higher n(Si)/(n(Mg) + n(Fe)) ratios than measured for the matrix material, and some individual Al-rich analyses. The olivine in the Allende matrix was found to have nearly equal amounts of forsterite and fayalite, with only a small shift towards Fe-rich olivine [40][103].
2.3. Apatite Crystal in Igneous Rocks
Apatite is ubiquitous albeit a frequently low abundance mineral in most igneous rocks. Its common presence is accounted for by low solubility in naturally occurring melts and aqueous solutions and the limited ability of common rock-forming minerals to accommodate of phosphorus into their structure. As an accessory mineral in igneous and other rocks, it commonly contains a range of elements that do not fit well into the major rock forming minerals, such as rare earth element (REE), and become a suitable target for investigating physical and chemical conditions in igneous rocks and the volatile evolution of magmas, hence, igneous petrogenetic processes and their modelling [41][42][43][44][45][109,110,111,112,113]. Apatite is a calcium phosphate mineral expressed by the chemical stoichiometric formula [Ca10(PO4)6(X)2]. The halogen site, X, is occupied by F−, Cl−, and OH− corresponding to an isomorphous series with fluor-, chlor- and hydroxyl-apatite end members, respectively. The apatite investigated with LMS is a fluorapatite mineral isolated from an ultramafic phoscorite rock from the Phalaborwa Complex (Limpopo Province, South Africa) formed 2.06 Ga ago (in Paleoproterozoic) [46][114]. Several previous studies have revealed the element partitioning and magmatic sourcing and hypothesised on the magmatic and post-magmatic mineral evolution in this region [46][47][48][49][50][51][46,114,115,116,117,118]. The chemical composition of the apatite sample was measured with high spatial resolution (10 μm spot size, sub-micrometre depth resolution) on 900 locations covering a sample are of 0.9 × 0.9 mm2 (Figure 27). The photomicrograph shows the investigated area in more detail. Location 1 marks a mineralogical phase that is in contact with the apatite crystal via a rim (location 2). Location 3 is tentatively assigned to the crystal core. Furthermore, at locations 4, 5 and 6, coloured reflections can be noticed at the micrometre size dimensions. The image also indicates the presence of several apatite crystal sheets. In the mass spectra obtained for the apatite crystal, the (O, F, Ca, P and Cl) elements are observed as major elements as expected for fluorapatite. A number of trace elements, including C, Na, Mg, Si, S, Cl, K, Mn, Fe, Sr, Ba and LREE (La, Ce, Pr, Sm), were measured at abundances levels down to part per million (atomic fractions). An anomalous increase in the element concentrations was observed at locations 4 and 5 for Sr and B and at location 6 for Th and U.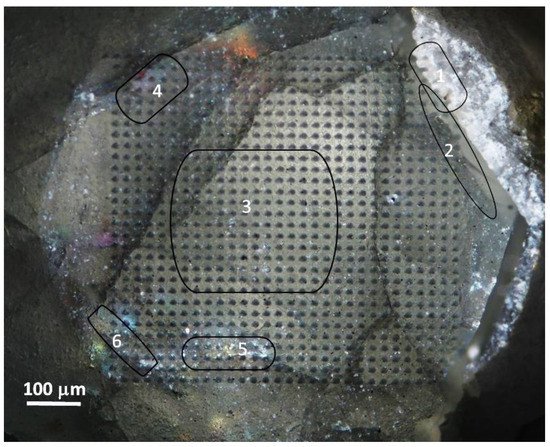
Figure 27. A microscope image of the apatite crystal surface along the z-axis with several crystalline sheets. On the left side the crystal is in contact with carbonatite rock (location 1) through a rim (location 2). The crystal core area (location 3) is surrounded by regions with enhanced abundances of (Th, U) at location 4, and Ba at locations 5 and 6.
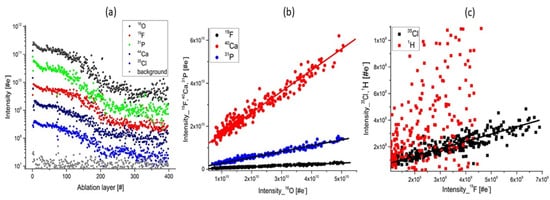
Figure 38. The depth profiling analysis prepared on a single ablation spot; (a) Variation of the mass peak intensities on several major elements related to apatite composition; (b) The plots of the intensity of the mass peak of Ca, P, F as function of the O intensity. The linear relationship indicates that these elements have their origin in apatite; (c) The intensity of Cl, H as function of F intensity. The linear correlation of Cl and F is observed. H and F are observed to be less correlated and the plot shows a wide distribution of data points. This is accounting for the presence of water adsorbed on the topmost sample surface.
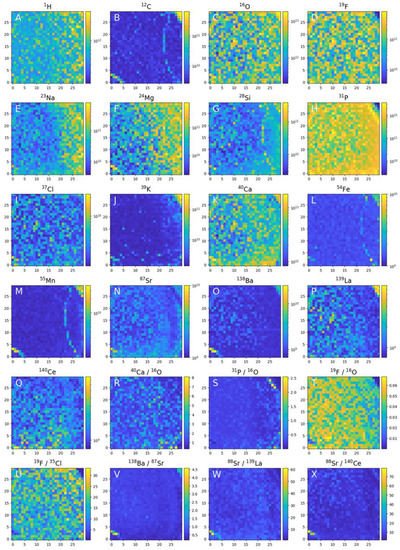
Figure 49. Chemical mapping of the 0.9 × 0.9 mm2 of the apatite crystal surface embedded in phoscorite rock. Element heterogeneities measured in 900 locations can be used to investigate element analysis, analysis of the neighbouring mineral phases and identification of grain size inclusion of distinct chemical composition with assessing their mineralogical content.