Your browser does not fully support modern features. Please upgrade for a smoother experience.
Submitted Successfully!
 +1 credit
Thank you for your contribution! You can also upload a video entry or images related to this topic.
For video creation, please contact our Academic Video Service.
| Version | Summary | Created by | Modification | Content Size | Created at | Operation |
|---|---|---|---|---|---|---|
| 1 | Tushar Garg | -- | 3440 | 2022-08-02 15:30:28 | | | |
| 2 | Conner Chen | -6 word(s) | 3434 | 2022-08-03 06:01:06 | | |
Video Upload Options
We provide professional Academic Video Service to translate complex research into visually appealing presentations. Would you like to try it?
Cite
If you have any further questions, please contact Encyclopedia Editorial Office.
Garg, T.; Weiss, C.R.; Sheth, R.A. Tissue Section-Based Immune Profiling. Encyclopedia. Available online: https://encyclopedia.pub/entry/25777 (accessed on 25 June 2026).
Garg T, Weiss CR, Sheth RA. Tissue Section-Based Immune Profiling. Encyclopedia. Available at: https://encyclopedia.pub/entry/25777. Accessed June 25, 2026.
Garg, Tushar, Clifford R. Weiss, Rahul A. Sheth. "Tissue Section-Based Immune Profiling" Encyclopedia, https://encyclopedia.pub/entry/25777 (accessed June 25, 2026).
Garg, T., Weiss, C.R., & Sheth, R.A. (2022, August 02). Tissue Section-Based Immune Profiling. In Encyclopedia. https://encyclopedia.pub/entry/25777
Garg, Tushar, et al. "Tissue Section-Based Immune Profiling." Encyclopedia. Web. 02 August, 2022.
Copy Citation
Technologies based on tissue sections are amongst the most common tools used for both morphologic and molecular characterization of cancers. These tools provide several unique advantages, most notably the preservation of spatial information. Furthermore, many of these assays can be performed on archival tissue, allowing for the post hoc analysis of preserved paraffin embedded samples in tissue banks.
immune profiling
tumor microenvironment
tissue section
single-cell characterization
1. Introduction
The patient prognosis in various types of cancers has traditionally been predicted with the use of the TNM staging guidelines provided by the American Joint Committee on Cancer and Union for International Cancer Control [1]. However, in recent years there has been increasing interest in using the immune contexture of the primary tumors to predict the patient’s prognosis by looking at the disease-free survival (DFS) and overall survival (OS). Tumor infiltrating lymphocytes (TILs), macrophages, dendritic cells (DC), mast cells, and cells comprise the tumor immune microenvironment. The TILs consist of T lymphocytes (TCRαβ+ T cells, CD8+ TCRαβ T cells, CD4+ TCRαβ+ T cells, TCRγδ+ T cells), B lymphocytes (antigen-presenting B cells, antibody-producing B cells, regulatory B cells) and innate lymphoid cells (natural killer cells and helper-like innate lymphoid cells). A tumor’s immune profile is characterized by analyzing at various parameters such as the density, composition, location, and functional state of TILs [2][3][4][5]. TILs play an important and diverse role in the tumorigenesis of cancers. The different subsets of TILs suppress or support the growth of tumor or metastasis through direct interactions and production of soluble factors such as growth factors, cytokines, and chemokines [6]. It has been shown that high lymphocytic infiltration such as CD3+ T cells, CD8+ cytotoxic T cells, and CD45RO+ memory T cells is associated with increased DFS and OS in patients with colorectal carcinoma, melanoma, ovarian cancer, head and neck cancer, bladder carcinoma, breast cancer, liver cancer, prostate cancer, and lung cancer [2][3][7][8][9][10][11][12][13].
One example of how data collected from immune contexture has been used to derive a simple, yet powerful classification system is called the ‘Immunoscore’. The Immunoscore is calculated after the assessment of CD3+ lymphocytes and cytotoxic CD8+ cells is performed using the Immunoscore assay in the tumor center (CT) and tumor margins (IM). The Immunoscore is calculated by looking at the number of cells in CT and TM, and based on this, the patients are divided into five groups from 0 to 4. Immunoscore has been validated internationally by the Society of Immunotherapy for Cancer, which created a consortium to globally evaluate the prognostic value of the Immunoscore in patients with stage I-III colon cancer [14]. In their study, 3539 samples were processed from 2681 patients with colon cancer [15]. The Immunoscore was found to be independently associated with time to recurrence and the rate of recurrence at 5 years was found to be significantly lower in patients with a high Immunoscore on cox multivariable analysis [15]. Immunoscore helps to capture a number of different complex mechanisms that affect the tumor progression such as presence of tumor immunogenicity (dependent on microsatellite instability, mismatch repair defect), activation of oncogenic signaling (WNT/β-catenin pathway), and differences in gut microbiota [16][17][18]. As a result of capturing these different mechanisms in one score, Immunoscore was found to be a better predictor for DFS, disease-specific survival and OS when compared to the TNM staging system, and grade of differentiation [15]. In another study conducted by Wirta et al., high Immunoscore was found to predict good 5-year survival in both microsatellite-stable and microsatellite-instable colon cancer [19]. As a result of these studies, the Immunoscore was approved for clinical, diagnostic use in patients with colorectal cancer [8][20][21]. A recent review looked at all the literature regarding the use of Immunoscore in patients with different cancers (colorectal cancer, gastric cancer, non-small cell lung cancer, pancreatic cancer, bladder cancer, head and neck squamous cell cancer, liver cancer, and ovarian cancer) [22]. All patients from these studies were pooled and the OS and DFS in patients with lower Immunoscore was found to be significantly lower when compared to those with higher score [22]. Further information about the predictive capabilities of the tumor immune microenvironment and the Immunoscore are discussed in a recent excellent review [23]. Incorporation of the Immunoscore in the traditionally used classification can lead to significantly improve prognostic and predictive tool development [14][24].
Interventional radiologists (IRs) play an important role in the biomarker-based evaluation of patients on systemically administered immunotherapies. Image-guided tissue sampling is a cornerstone in the diagnosis, stratification, and longitudinal evaluation of therapeutic efficacy for cancer patients receiving immunotherapies. Furthermore, locoregional interventions performed by IRs inarguably have a profound influence on the local tumor immune microenvironment, and strategies to manipulate local tumor immunity towards an immunostimulatory state through such locoregional interventions has the potential to overcome barriers to systemically administered immunotherapies [25][26][27][28][29]. A rigorous pursuit along these avenues of research is predicated upon the thorough characterization of the immune microenvironment after locoregional therapies.
2. Tissue Section-Based Immune Profiling
Technologies based on tissue sections are amongst the most common tools used for both morphologic and molecular characterization of cancers. These tools provide several unique advantages, most notably the preservation of spatial information. Furthermore, many of these assays can be performed on archival tissue, allowing for the post hoc analysis of preserved paraffin embedded samples in tissue banks. The archetype assay for tissue section-based analysis is hematoxylin and eosin (HE) staining. This stain can be used to evaluate the TILs in sections of the malignant tissue. The use of HE staining is relatively easy in the clinical practice due to its convenience and low cost. The evaluation of HE-sections is done according to the International Immuno-Oncology Biomarkers Working Group recommendations [30]. A standard slide of 4–5 µm of formalin-fixed and paraffin-embedded (FFPE) tissue is used for TIL evaluation. When evaluating the slides, it can be observed the IM and CT of the tumor under low magnification and semi-quantitatively evaluate the percent of tumor stroma and tumor cell compartment area that is occupied by mononuclear cells (at intervals of 10%) at high magnification (×200–400) [30][31][32][33]. TILs are reported as the mononuclear immune cells in the tumor stroma and tumor cell compartment separately, and they are evaluated by taking an average of the density of TILs in five different fields [33]. Specific guidelines for evaluation of TILs in different cancer types is beyond the scope [30][33][34].
Immunohistochemistry (IHC) (Figure 1) uses monoclonal or polyclonal antibodies to identify specific antigens in the tissue sections [35]. A standard 4–5 µm of FFPE tissue is used for IHC evaluation [33]. In evaluation of the immune microenvironment using standard IHC, the number of CD3+, CD4+, CD8+, CD45+ cells or cancer specific antigen expressing cells are counted manually or by using a detection system in the tumor stroma, cancer cell nests and the whole microscopic field at the IM of the tumor at the magnification of ×400 [33].
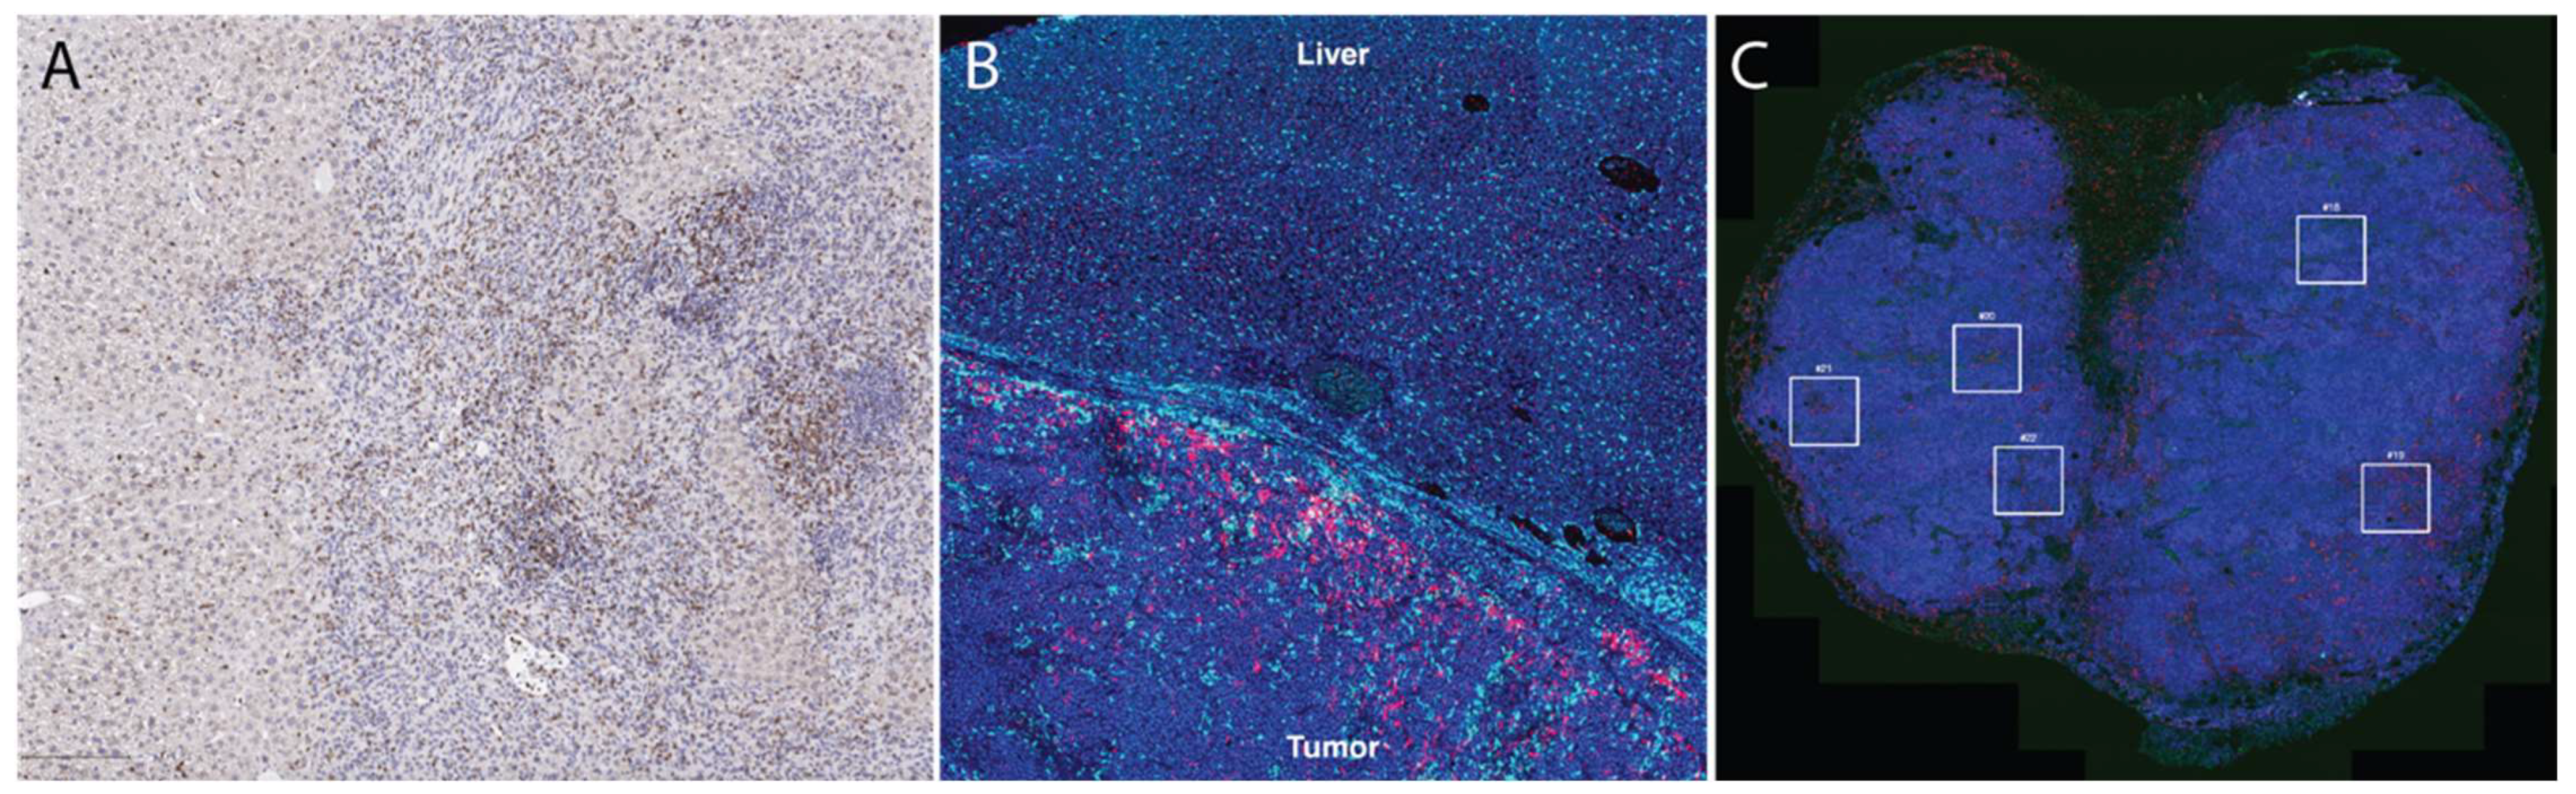
Figure 1. Tissue section-based immune profiling tools. (A), conventional immunohistochemistry of an orthotopic mouse liver tumor demonstrates infiltration of CD8+ cells (DAB, brown color stain) into the tumor. (B), immunofluorescence of CD68+ (light blue) and CD8+ (magenta) illustrates accumulation of macrophages and T cells at the liver-tumor border in a rat model of liver cancer. (C), Multi-color immunofluorescence (pan-cytokeratin = magenta, blue = DAPI, red = CD3, green = CD8) is helpful to characterize accumulation of multiple cell types; in this case, these images were used to draw regions of interest (boxes) within which high-dimensional RNA sequencing was performed using the Nanostring GeoMX platform [26].
2.1. Nanostring nCounter
Nanostring nCounter is a technology that allows direct quantification of the RNA present in the sample without the need for more complicated traditional microarray techniques such as quantitative PCR (qPCR) and RNA-seq. The sensitivity of RNA levels detected with the help of Nanostring nCounter has been found to be similar to that of traditional techniques without the need for amplification or separate enzymatic processing [36][37][38]. Additionally, when the tissue sections are fixed and embedded in paraffin, the RNA present on the tissue sections usually undergoes modification and degradation which makes the gene expression studies such as qPCR and RNA-seq challenging in these samples [39]. These techniques have demonstrated significantly worse quality of results when the input material is FFPE samples [40]. The Nanostring nCounter can be used to accurately measure the RNA expression from FFPE samples. It has been used to quantify the gene signatures from multiple tissue types [36][41][42][43]. It has been shown that the freshly prepared RNA and RNA extracted from matched FFPE samples have high correlation (r = 0.9) of transcript levels without the need for RNA purification [44]. The Nanostring nCounter works by providing a unique code to each gene being assayed. It provides multiplexed measurement of gene expression which a large number of mRNA transcripts studied simultaneously. RNA can be extracted from the FFPE slides using the QIAGEN® RNeasy® FFPE Kit. Nanostring nCounter kits designed to work with low quality FFPE samples with as little as 1 ng RNA can allow for analysis of a large number of gene transcripts from severely degraded samples. In total, 100 nanograms of RNA from the sample is hybridized to a custom human gene CodeSet and then processed on the nCounter platform after immobilization with Capture probe. Once the hybridization of the CodeSet with the mRNA has been completed, the next step is transferring the sample to the nCounter Prep Station. At the nCounter Prep Station, the target probes are first aligned and then immobilized in the nCounter Cartridge along with reduction in the excess probes that are inadvertently transferred to the station. The data collection then takes placed in the nCounter Digital Analyzer once the cartridge is placed in it. The target molecule of interest is identified by looking for the reporter probe which has six ordered fluorescent probes. This technology has various disadvantages such as the presence of only 800-predetermined genes which are mainly identified based on publication needs, and it does not provide any spatial information about the expression of genes.
2.2. Multiplex Immunofluorescence
Multiplex IHC/immunofluorescence (IF) allows for visualization of multiple markers when evaluating a tissue section, whereas conventional IHC typically only evaluates one to two markers per tissue section. In multiplex IHC/IF, the target proteins are labeled using fluorochromes and then visualized using fluorescence microscopy tools to look at the distribution of these target proteins in a single tissue section (Figure 1). This further allows for evaluation of the relative spatial distribution of, for example, various immune cell types within a tumor. Other clinical applications of multiplex immunofluorescence include understanding transduction signaling pathway activity (pAKT, mTOR, MAPK, EFGR), cell cycle characterization, inflammation, understanding autoimmune disease and neurodegenerative diseases, and identifying lymph node metastasis. Two commercial technologies currently available to perform such analysis are Vectra and CODEX. Vectra is a multispectral immunofluorescence (IF) platform that allows detection of multiple proteins within the cells along with examination of the spatial arrangement of the cell phenotypes. The Vectra platform can be used to simultaneously detect up to nine different of proteins of interest on a single FFPE tissue slide with the help of Opal chemistry and spectral un-mixing. This technology provides information about biomarker expression levels; additionally, it also increases the biomarkers that can visualized at the same time. Vectra platform can automatically load and scan up to 200 slides. After the slides are loaded, they are first pre-scanned at ×4–1 × 10 magnification which is followed by high-power-field (HPF, ×20–×40) imaging of regions of interest in the multispectral mode. The use of multiplex IF images allows comprehensive understanding of complex cellular interactions that are not possible with the use of other methods [45].
Likewise, CO-Detection by inDEXing (CODEX) is a high-parameter multiplex tissue imaging platform that allows analysis of up to 60 markers in single cells on FFPE tissue sections [46][47][48]. It uses oligonucleotide-conjugated antibodies and sequential fluorescent reports for this task. CODEX helps in the generation of detailed information about the distribution of different cellular phenotypes (‘cellular neighborhoods’) in a healthy or diseased tissue while maintaining their morphological structures [46]. It provides critical biological and clinical insight about cell–cell contacts, environmental context, and tissue structure [47]. One of the most important parts of the CODEX methodology relies on the well-designed and validated antibody panel [49][50][51]. CODEX can be used to study disease and identify biomarkers that will be useful in clinical trials to understand the cell interaction on a histological level and predict clinical outcome. Both Vectra and CODEX are Clinical Laboratory Improvement Amendments (CLIA)-certified technologies; however, the results of these technologies are required to be validated in a CLIA-certified laboratory against a gold standard (such as standard IHC), which can be a significant hurdle in the use of these technologies.
2.3. Spatial Transcriptomics
Over the past several years, new technologies have become available that marry the high-dimensional capabilities of bulk tissue genomic sequencing tools with the preserved spatial information of tissue section-based tools. These spatial transcriptomic tools are capable of providing unprecedented detail regarding cellular RNA and protein expression without sacrificing information from where the cells are located.
2.3.1. Nanostring (GeoMX)
The GeoMX Digital Spatial Profiler (DSP) is a platform that has been developed to use the barcoding technology of nCounter in order to both spatially resolve and digitally quantify the protein and mRNA expression. GeoMX DSP can be used to analyze any sample type such as core needle biopsy, FFPE tissue block, tissue microarray, slide mounted tissue, and fresh frozen tissue based on the availability of sample. This technology uses antibodies for protein detection and RNA probes for mRNA detection. These antibodies and RNA probes are linked to oligonucleotide tags [52]. The DSP allows selection of a region of interest, which is then exposed to UV light to cause delinking of the oligonucleotide tags. Selection of the region of interest is a critical step and can be facilitated with guidance from expert pathologists [53]. These oligonucleotide tags can then be quantified using a standard nCounter assay to assess the amount of protein or mRNA present in different morphological structures. As such, the GeoMX DSP provides a spatially resolved digital profile of the analyzed tissue. The GeoMX DSP uses five different profiling modalities to define the region of interest which include contour, gridded, geometric, rare cell, and segment profiling. GeoMX DSP allows for understanding the spatial distribution of proteins and RNA which can help is discovering biomarkers to predict the patient response to therapy [26][54][55][56]. Using GeoMX DSP, it is not possible to profile every cell in a tissue slice due to its limited resolution, whereas imaging-based methods can be used to obtain multiplexed information about every cell in a tissue section [57]. Additionally, previous knowledge about the genes present is required, and only a small number of mRNAs can be investigated at once [58], though this limitation is rapidly being lifted with new integrated workflows that allow analysis of the complete transcriptome within regions of interest.
2.3.2. Visium (10× Genomics)
The Visium Spatial Gene Expression platform helps with gene expression profiling at a high-resolution level [59][60]. Visium allows for spatially profiling of more than 18,000 genes by assessing their RNA expression in FFPE samples with a high resolution across the entire section of the tissue. The process begins with placing the FFPE tissue section on to the Visium gene expression slide which is stained using routine stains and images for histological purposes. The Visium slide with the stained, fixed, and imaged tissue is then loaded into the slide cassette. The RNA on the capture area (6.5 × 6.5 mm) in the FFPE slide is then bound to a capture probe. Extension of probe pairs is performed to include complements of the spatial barcodes and the sequencing library is prepared. The libraries are then sequenced, and the data is visualized to see which genes are expressed in what quantity and at which location. Comparison between NanoString GeoMX DSP and 10x Genomics Visium is shown in Table 1.
Table 1. Comparison between commonly used commercially available spatial transcriptional profiling platforms (Adapted from Bassiouni et al. [60]).
| Comparison Parameters | 10× Genomics Visium | NanoString Ge-oMX DSP |
|---|---|---|
| Tissue compatibility | Compatible with fresh frozen tissue | Compatible with fresh frozen tissue and FFPE |
| RNA quality | Needs RNA integrity number >7 | No requirements for RNA quality |
| Tissue preparation | Tissue is mounted on a specialized gene expression slide | Tissue is mounted on a standard microscope slide |
| Tissue size | 6.5 × 6.5 mm per capture area | 14.6 × 36.2 mm |
| Detection area | Within the full capture area | Within user-defined regions of interest |
| Cellular resolution | ~10 cells/feature | ~20–200 cells/region of interest |
| Direct RNA detection | Absent | Present |
| Concurrent protein detection | Present | Present |
2.3.3. Vizgen Merscope
Multiplexed Error-Robust Fluorescence In Situ Hybridization (MERFISH) is a microscopy-based method that allows the study of hundreds to a few thousands of genes in addition to providing single-molecular analysis capability [61]. The results of MERFISH provide subcellular spatial resolutions that are fine than sequencing-based spatial approaches. Due to the ability to study a number of target genes of interest with spatial context, MERFISH can be used along with traditional single-cell analysis.
MERFISH uses single-molecular fluorescence in situ hybridization (smFISH) in combination with labeling of RNA transcriptions using optical barcoding. MERFISH helps to assess the transcriptional activity in fixed samples by providing a highly multiplexed, single-molecule readout [61]. Targeted labeling of RNA transcripts in MERFISH is performed using a preselected gene panel in which each transcript is assigned a unique barcode [62]. After the sample is hybridized with encoding probes, the barcode is then detected by multiple rounds of multichannel imaging using different subsets of readout probes which hybridize with the barcode region of the encoding probes. The fluorescent spots are then decoded into binary barcoded (1, 0). The position of these barcodes and their positions along with the staining and segmentation of the cell nucleus and boundary allow for measurement of gene expression in a single cell. This technology can be applied to study the response of the tumor to various therapies and evaluate patient prognosis [63]. MERFISH has been used to create a spatially resolved cell atlas of mouse primary cortex, to assess the cell niche architecture of fetal liver hematopoietic stem cells, and understand cell cycle dependent gene expression [64][65][66]. He et al. demonstrated the use of MERFISH technology to perform single-cell transcriptomic imaging in FFPE tissue sections from more than 10 tissue types from mouse and human donors including breast cancer, colon cancer, melanoma, lung cancer, liver cancer, ovarian cancer, prostate cancer, and uterine cancer. They were able to map all major cell types in each tumor including the subtype of immune cells and characterize their gene expression profile at single-cell resolution [67].
2.4. Imaging Mass Spectrometry
Imaging mass spectrometry (IMS) uses a matrix-assisted laser desorption ionization (MALDI) for molecular study of complex biological samples such as tissue sections [68]. It allows for assessment of molecular arrangements with the need for target-specific reagents and therefore, can be useful in the discovery of various known or unknown diagnostic and prognostic markers of different cancer types and help determine appropriate therapy [69][70][71]. MALDI MIS can be used for analysis of small and large molecular mass biologicals. For analysis with MALDI, the sample is first mixed or coated with an energy absorbing matrix and then it is irradiated with the help of a laser beam. Based on the ionization mode, singly protonated molecular ions (positive ionization mode) and deprotonated ions (negative ionization mode) are generated. These ions are then detected with the help of a mass analyzer. To measure the ionized analytes in MALDI, time-of-flight (TOF) analyzers are used. The ions are accelerated at fixed potentials and the ions are then separated and recorded based on their molecular mass to charge ratio [72].
Studies using MALDI IMS have been used in the past to find molecular signatures from different tumors of different types and grades of disease. It can also be used to find spatial distribution of a wide variety of biomarkers that have been shown to play an important role in cancers, including peptides, glycans, lipids, and metabolites [73][74][75][76]. This technology allows for unbiased analysis of samples and provides multiplexed spatially resolved molecular information in addition to studying the different molecular expression in anatomically normal and pathological structures [77][78][79][80][81][82][83][84][85]. MALDI-MSI based proteomic studies have also shown to be useful in prognostic evaluation and correlating the patient response to a therapeutic regimen [80][86]. For example, Kriegsmann et al. used MALDI-IMS to classify patients with non-small cell lung cancers into squamous cell carcinoma and adenocarcinoma. A model was created using 339 different molecular signals, which was able to classify patients with 100% diagnostic accuracy. Additionally, four molecular signals (one for adenocarcinoma and three for squamous cell carcinoma) were also identified that were strongly expressed in these tissues [87]. Paulla et al. used MALDI-IMS to profile prostate cancer and benign tissues. They found a biliverdin reductase B, a biomarker which was overexpressed in the cancerous tissue [88].
Even though MALDI has been used to investigate multiple disease states, full integration of this technology into cancer research is currently not possible as proteins which are not abundantly present in the sample cannot be detected preferentially due to the lack of techniques to amplify protein signal [89].
References
- Burke, H.B. Outcome Prediction and the Future of the TNM Staging System. J. Natl. Cancer Inst. 2004, 96, 1408–1409.
- Fridman, W.H.; Pagès, F.; Sautès-Fridman, C.; Galon, J. The Immune Contexture in Human Tumours: Impact on Clinical Outcome. Nat. Rev. Cancer 2012, 12, 298–306.
- Galon, J.; Costes, A.; Sanchez-Cabo, F.; Kirilovsky, A.; Mlecnik, B.; Lagorce-Pagès, C.; Tosolini, M.; Camus, M.; Berger, A.; Wind, P.; et al. Type, Density, and Location of Immune Cells within Human Colorectal Tumors Predict Clinical Outcome. Science 2006, 313, 1960–1964.
- Galon, J.; Fridman, W.-H.; Pagès, F. The Adaptive Immunologic Microenvironment in Colorectal Cancer: A Novel Perspective: Figure 1. Cancer Res. 2007, 67, 1883–1886.
- Mlecnik, B.; Tosolini, M.; Charoentong, P.; Kirilovsky, A.; Bindea, G.; Berger, A.; Camus, M.; Gillard, M.; Bruneval, P.; Fridman, W.; et al. Biomolecular Network Reconstruction Identifies T-Cell Homing Factors Associated with Survival in Colorectal Cancer. Gastroenterology 2010, 138, 1429–1440.
- Grivennikov, S.I.; Greten, F.R.; Karin, M. Immunity, Inflammation, and Cancer. Cell 2010, 140, 883–899.
- Pagès, F.; Berger, A.; Camus, M.; Sanchez-Cabo, F.; Costes, A.; Molidor, R.; Mlecnik, B.; Kirilovsky, A.; Nilsson, M.; Damotte, D.; et al. Effector Memory T Cells, Early Metastasis, and Survival in Colorectal Cancer. N. Engl. J. Med. 2005, 353, 2654–2666.
- Angell, H.; Galon, J. From the Immune Contexture to the Immunoscore: The Role of Prognostic and Predictive Immune Markers in Cancer. Curr. Opin. Immunol. 2013, 25, 261–267.
- Tefany, F.J.; Barnetson, R.S.; Halliday, G.M.; McCarthy, S.W.; McCarthy, W.H. Immunocytochemical Analysis of the Cellular Infiltrate in Primary Regressing and Non-Regressing Malignant Melanoma. J. Investig. Dermatol. 1991, 97, 197–202.
- Sinicrope, F.A.; Rego, R.L.; Ansell, S.M.; Knutson, K.L.; Foster, N.R.; Sargent, D.J. Intraepithelial Effector (CD3+)/Regulatory (FoxP3+) T-Cell Ratio Predicts a Clinical Outcome of Human Colon Carcinoma. Gastroenterology 2009, 137, 1270–1279.
- Kawai, O.; Ishii, G.; Kubota, K.; Murata, Y.; Naito, Y.; Mizuno, T.; Aokage, K.; Saijo, N.; Nishiwaki, Y.; Gemma, A.; et al. Predominant Infiltration of Macrophages and CD8 + T Cells in Cancer Nests Is a Significant Predictor of Survival in Stage IV Nonsmall Cell Lung Cancer. Cancer 2008, 113, 1387–1395.
- Hamanishi, J.; Mandai, M.; Iwasaki, M.; Okazaki, T.; Tanaka, Y.; Yamaguchi, K.; Higuchi, T.; Yagi, H.; Takakura, K.; Minato, N.; et al. Programmed Cell Death 1 Ligand 1 and Tumor-Infiltrating CD8 + T Lymphocytes Are Prognostic Factors of Human Ovarian Cancer. Proc. Natl. Acad. Sci. USA 2007, 104, 3360–3365.
- Richardsen, E.; Uglehus, R.D.; Due, J.; Busch, C.; Busund, L.-T.R. The Prognostic Impact of M-CSF, CSF-1 Receptor, CD68 and CD3 in Prostatic Carcinoma. Histopathology 2008, 53, 30–38.
- Galon, J.; Pagès, F.; Marincola, F.M.; Angell, H.K.; Thurin, M.; Lugli, A.; Zlobec, I.; Berger, A.; Bifulco, C.; Botti, G.; et al. Cancer Classification Using the Immunoscore: A Worldwide Task Force. J. Transl. Med. 2012, 10, 205.
- Pagès, F.; Mlecnik, B.; Marliot, F.; Bindea, G.; Ou, F.-S.; Bifulco, C.; Lugli, A.; Zlobec, I.; Rau, T.T.; Berger, M.D.; et al. International Validation of the Consensus Immunoscore for the Classification of Colon Cancer: A Prognostic and Accuracy Study. Lancet 2018, 391, 2128–2139.
- Walkowska, J.; Kallemose, T.; Jönsson, G.; Jönsson, M.; Andersen, O.; Andersen, M.H.; Svane, I.M.; Langkilde, A.; Nilbert, M.; Therkildsen, C. Immunoprofiles of Colorectal Cancer from Lynch Syndrome. OncoImmunology 2019, 8, e1515612.
- Spranger, S.; Bao, R.; Gajewski, T.F. Melanoma-Intrinsic β-Catenin Signalling Prevents Anti-Tumour Immunity. Nature 2015, 523, 231–235.
- Cremonesi, E.; Governa, V.; Garzon, J.F.G.; Mele, V.; Amicarella, F.; Muraro, M.G.; Trella, E.; Galati-Fournier, V.; Oertli, D.; Däster, S.R.; et al. Gut Microbiota Modulate T Cell Trafficking into Human Colorectal Cancer. Gut 2018, 67, 1984–1994.
- Wirta, E.-V.; Seppälä, T.; Friman, M.; Väyrynen, J.; Ahtiainen, M.; Kautiainen, H.; Kuopio, T.; Kellokumpu, I.; Mecklin, J.-P.; Böhm, J. Immunoscore in Mismatch Repair-Proficient and -Deficient Colon Cancer: Immunoscore in Colon Cancer. J. Path Clin. Res. 2017, 3, 203–213.
- Galon, J.; Lanzi, A. Immunoscore and Its Introduction in Clinical Practice. Q. J. Nucl. Med. Mol. Imaging 2020, 64, 152–161.
- Angell, H.K.; Bruni, D.; Barrett, J.C.; Herbst, R.; Galon, J. The Immunoscore: Colon Cancer and Beyond. Clin. Cancer Res. 2020, 26, 332–339.
- Zhang, X.; Yang, J.; Du, L.; Zhou, Y.; Li, K. The Prognostic Value of Immunoscore in Patients with Cancer: A Pooled Analysis of 10,328 Patients. Int. J. Biol. Markers 2020, 35, 3–13.
- Bruni, D.; Angell, H.K.; Galon, J. The Immune Contexture and Immunoscore in Cancer Prognosis and Therapeutic Efficacy. Nat. Rev. Cancer 2020, 20, 662–680.
- Galon, J.; Pagès, F.; Marincola, F.M.; Thurin, M.; Trinchieri, G.; Fox, B.A.; Gajewski, T.F.; Ascierto, P.A. The Immune Score as a New Possible Approach for the Classification of Cancer. J. Transl. Med. 2012, 10, 1.
- Tselikas, L.; Champiat, S.; Sheth, R.A.; Yevich, S.; Ammari, S.; Deschamps, F.; Farhane, S.; Roux, C.; Susini, S.; Mouraud, S.; et al. Interventional Radiology for Local Immunotherapy in Oncology. Clin. Cancer Res. 2021, 27, 2698–2705.
- Muñoz, N.M.; Dupuis, C.; Williams, M.; Dixon, K.; McWatters, A.; Avritscher, R.; Bouchard, R.; Kaseb, A.; Schachtschneider, K.M.; Rao, A.; et al. Molecularly Targeted Photothermal Ablation Improves Tumor Specificity and Immune Modulation in a Rat Model of Hepatocellular Carcinoma. Commun. Biol. 2020, 3, 783.
- Adnan, A.; Muñoz, N.M.; Prakash, P.; Habibollahi, P.; Cressman, E.N.K.; Sheth, R.A. Hyperthermia and Tumor Immunity. Cancers 2021, 13, 2507.
- Mehta, A.; Oklu, R.; Sheth, R.A. Thermal Ablative Therapies and Immune Checkpoint Modulation: Can Locoregional Approaches Effect a Systemic Response? Gastroenterol. Res. Pract. 2016, 2016, 9251375.
- Qiao, Y.; Sheth, R.A.; Tam, A. Image-Guided Intratumoral Delivery of Immunotherapeutics in Gastrointestinal Malignancies. Dig. Dis. Interv. 2021, 5, 22–31.
- Salgado, R.; Denkert, C.; Demaria, S.; Sirtaine, N.; Klauschen, F.; Pruneri, G.; Wienert, S.; Van den Eynden, G.; Baehner, F.L.; Penault-Llorca, F.; et al. The Evaluation of Tumor-Infiltrating Lymphocytes (TILs) in Breast Cancer: Recommendations by an International TILs Working Group 2014. Ann. Oncol. 2015, 26, 259–271.
- Matsutani, S.; Shibutani, M.; Maeda, K.; Nagahara, H.; Fukuoka, T.; Iseki, Y.; Kashiwagi, S.; Tanaka, H.; Hirakawa, K.; Ohira, M. Tumor-Infiltrating Immune Cells in H&E-Stained Sections of Colorectal Cancer Tissue as a Reasonable Immunological Biomarker. Anticancer Res. 2018, 38, 6721–6727.
- Iseki, Y.; Shibutani, M.; Maeda, K.; Nagahara, H.; Fukuoka, T.; Matsutani, S.; Kashiwagi, S.; Tanaka, H.; Hirakawa, K.; Ohira, M. A New Method for Evaluating Tumor-Infiltrating Lymphocytes (TILs) in Colorectal Cancer Using Hematoxylin and Eosin (H-E)-Stained Tumor Sections. PLoS ONE 2018, 13, e0192744.
- Hendry, S.; Salgado, R.; Gevaert, T.; Russell, P.A.; John, T.; Thapa, B.; Christie, M.; van de Vijver, K.; Estrada, M.V.; Gonzalez-Ericsson, P.I.; et al. Assessing Tumor-Infiltrating Lymphocytes in Solid Tumors: A Practical Review for Pathologists and Proposal for a Standardized Method From the International Immunooncology Biomarkers Working Group: Part 1: Assessing the Host Immune Response, TILs in Invasive Breast Carcinoma and Ductal Carcinoma In Situ, Metastatic Tumor Deposits and Areas for Further Research. Adv. Anat. Pathol. 2017, 24, 235–251.
- Pruneri, G.; Lazzeroni, M.; Bagnardi, V.; Tiburzio, G.B.; Rotmensz, N.; DeCensi, A.; Guerrieri-Gonzaga, A.; Vingiani, A.; Curigliano, G.; Zurrida, S.; et al. The Prevalence and Clinical Relevance of Tumor-Infiltrating Lymphocytes (TILs) in Ductal Carcinoma in Situ of the Breast. Ann. Oncol. 2017, 28, 321–328.
- Kaliyappan, K.; Palanisamy, M.; Duraiyan, J.; Govindarajan, R. Applications of Immunohistochemistry. J. Pharm. Bioall. Sci. 2012, 4, 307–309.
- Geiss, G.K.; Bumgarner, R.E.; Birditt, B.; Dahl, T.; Dowidar, N.; Dunaway, D.L.; Fell, H.P.; Ferree, S.; George, R.D.; Grogan, T.; et al. Direct Multiplexed Measurement of Gene Expression with Color-Coded Probe Pairs. Nat. Biotechnol. 2008, 26, 317–325.
- Prokopec, S.D.; Watson, J.D.; Waggott, D.M.; Smith, A.B.; Wu, A.H.; Okey, A.B.; Pohjanvirta, R.; Boutros, P.C. Systematic Evaluation of Medium-Throughput MRNA Abundance Platforms. RNA 2013, 19, 51–62.
- Malkov, V.A.; Serikawa, K.A.; Balantac, N.; Watters, J.; Geiss, G.; Mashadi-Hossein, A.; Fare, T. Multiplexed Measurements of Gene Signatures in Different Analytes Using the Nanostring NCounter Assay System. BMC Res. Notes 2009, 2, 80.
- Ibusuki, M.; Fu, P.; Yamamoto, S.; Fujiwara, S.; Yamamoto, Y.; Honda, Y.; Iyama, K.; Iwase, H. Establishment of a Standardized Gene-Expression Analysis System Using Formalin-Fixed, Paraffin-Embedded, Breast Cancer Specimens. Breast Cancer 2013, 20, 159–166.
- Wimmer, I.; Tröscher, A.R.; Brunner, F.; Rubino, S.J.; Bien, C.G.; Weiner, H.L.; Lassmann, H.; Bauer, J. Systematic Evaluation of RNA Quality, Microarray Data Reliability and Pathway Analysis in Fresh, Fresh Frozen and Formalin-Fixed Paraffin-Embedded Tissue Samples. Sci. Rep. 2018, 8, 6351.
- Fortina, P.; Surrey, S. Digital mRNA Profiling. Nat. Biotechnol. 2008, 26, 293–294.
- Kojima, K.; April, C.; Canasto-Chibuque, C.; Chen, X.; Deshmukh, M.; Venkatesh, A.; Tan, P.S.; Kobayashi, M.; Kumada, H.; Fan, J.-B.; et al. Transcriptome Profiling of Archived Sectioned Formalin-Fixed Paraffin-Embedded (AS-FFPE) Tissue for Disease Classification. PLoS ONE 2014, 9, e86961.
- Payton, J.E.; Grieselhuber, N.R.; Chang, L.-W.; Murakami, M.; Geiss, G.K.; Link, D.C.; Nagarajan, R.; Watson, M.A.; Ley, T.J. High Throughput Digital Quantification of MRNA Abundance in Primary Human Acute Myeloid Leukemia Samples. J. Clin. Invest. 2009, 119, 1714–1726.
- Reis, P.P.; Waldron, L.; Goswami, R.S.; Xu, W.; Xuan, Y.; Perez-Ordonez, B.; Gullane, P.; Irish, J.; Jurisica, I.; Kamel-Reid, S. MRNA Transcript Quantification in Archival Samples Using Multiplexed, Color-Coded Probes. BMC Biotechnol. 2011, 11, 46.
- Tan, W.C.C.; Nerurkar, S.N.; Cai, H.Y.; Ng, H.H.M.; Wu, D.; Wee, Y.T.F.; Lim, J.C.T.; Yeong, J.; Lim, T.K.H. Overview of Multiplex Immunohistochemistry/Immunofluorescence Techniques in the Era of Cancer Immunotherapy. Cancer Commun. 2020, 40, 135–153.
- Schürch, C.M.; Bhate, S.S.; Barlow, G.L.; Phillips, D.J.; Noti, L.; Zlobec, I.; Chu, P.; Black, S.; Demeter, J.; McIlwain, D.R.; et al. Coordinated Cellular Neighborhoods Orchestrate Antitumoral Immunity at the Colorectal Cancer Invasive Front. Cell 2020, 182, 1341–1359.
- Goltsev, Y.; Samusik, N.; Kennedy-Darling, J.; Bhate, S.; Hale, M.; Vazquez, G.; Black, S.; Nolan, G.P. Deep Profiling of Mouse Splenic Architecture with CODEX Multiplexed Imaging. Cell 2018, 174, 968–981.e15.
- Phillips, D.; Matusiak, M.; Gutierrez, B.R.; Bhate, S.S.; Barlow, G.L.; Jiang, S.; Demeter, J.; Smythe, K.S.; Pierce, R.H.; Fling, S.P.; et al. Immune Cell Topography Predicts Response to PD-1 Blockade in Cutaneous T Cell Lymphoma. Nat. Commun. 2021, 12, 6726.
- Giesen, C.; Wang, H.A.O.; Schapiro, D.; Zivanovic, N.; Jacobs, A.; Hattendorf, B.; Schüffler, P.J.; Grolimund, D.; Buhmann, J.M.; Brandt, S.; et al. Highly Multiplexed Imaging of Tumor Tissues with Subcellular Resolution by Mass Cytometry. Nat. Methods 2014, 11, 417–422.
- Jackson, H.W.; Fischer, J.R.; Zanotelli, V.R.T.; Ali, H.R.; Mechera, R.; Soysal, S.D.; Moch, H.; Muenst, S.; Varga, Z.; Weber, W.P.; et al. The Single-Cell Pathology Landscape of Breast Cancer. Nature 2020, 578, 615–620.
- Ijsselsteijn, M.E.; van der Breggen, R.; Farina Sarasqueta, A.; Koning, F.; de Miranda, N.F.C.C. A 40-Marker Panel for High Dimensional Characterization of Cancer Immune Microenvironments by Imaging Mass Cytometry. Front. Immunol. 2019, 10, 2534.
- Pelka, K.; Hofree, M.; Chen, J.H.; Sarkizova, S.; Pirl, J.D.; Jorgji, V.; Bejnood, A.; Dionne, D.; Ge, W.H.; Xu, K.H.; et al. Spatially Organized Multicellular Immune Hubs in Human Colorectal Cancer. Cell 2021, 184, 4734–4752.e20.
- Van, T.M.; Blank, C.U. A User’s Perspective on GeoMxTM Digital Spatial Profiling. Immuno-Oncol. Technol. 2019, 1, 11–18.
- Garon, E.B.; Rizvi, N.A.; Hui, R.; Leighl, N.; Balmanoukian, A.S.; Eder, J.P.; Patnaik, A.; Aggarwal, C.; Gubens, M.; Horn, L.; et al. Pembrolizumab for the Treatment of Non–Small-Cell Lung Cancer. N. Engl. J. Med. 2015, 372, 2018–2028.
- Yu, H.; Batenchuk, C.; Badzio, A.; Boyle, T.A.; Czapiewski, P.; Chan, D.C.; Lu, X.; Gao, D.; Ellison, K.; Kowalewski, A.A.; et al. PD-L1 Expression by Two Complementary Diagnostic Assays and MRNA In Situ Hybridization in Small Cell Lung Cancer. J. Thorac. Oncol. 2017, 12, 110–120.
- Ting, D.T.; Lipson, D.; Paul, S.; Brannigan, B.W.; Akhavanfard, S.; Coffman, E.J.; Contino, G.; Deshpande, V.; Iafrate, A.J.; Letovsky, S.; et al. Aberrant Overexpression of Satellite Repeats in Pancreatic and Other Epithelial Cancers. Science 2011, 331, 593–596.
- Merritt, C.R.; Ong, G.T.; Church, S.E.; Barker, K.; Danaher, P.; Geiss, G.; Hoang, M.; Jung, J.; Liang, Y.; McKay-Fleisch, J.; et al. Multiplex digital spatial profiling of proteins and RNA in fixed tissue. Nat. Biotechnol. 2020, 38, 586–599.
- Wang, Y.; Mashock, M.; Tong, Z.; Mu, X.; Chen, H.; Zhou, X.; Zhang, H.; Zhao, G.; Liu, B.; Li, X. Changing Technologies of RNA Sequencing and Their Applications in Clinical Oncology. Front. Oncol. 2020, 10, 447.
- Nagasawa, S.; Kashima, Y.; Suzuki, A.; Suzuki, Y. Single-Cell and Spatial Analyses of Cancer Cells: Toward Elucidating the Molecular Mechanisms of Clonal Evolution and Drug Resistance Acquisition. Inflamm. Regener. 2021, 41, 22.
- Bassiouni, R.; Gibbs, L.D.; Craig, D.W.; Carpten, J.D.; McEachron, T.A. Applicability of Spatial Transcriptional Profiling to Cancer Research. Mol. Cell 2021, 81, 1631–1639.
- Chen, K.H.; Boettiger, A.N.; Moffitt, J.R.; Wang, S.; Zhuang, X. Spatially Resolved, Highly Multiplexed RNA Profiling in Single Cells. Science 2015, 348, aaa6090.
- Moffitt, J.R.; Hao, J.; Bambah-Mukku, D.; Lu, T.; Dulac, C.; Zhuang, X. High-Performance Multiplexed Fluorescence in Situ Hybridization in Culture and Tissue with Matrix Imprinting and Clearing. Proc. Natl. Acad. Sci. USA 2016, 113, 14456–14461.
- Price, C.; Chen, J.; Pelka, K.; Chao, S.; He, J.; Boland, G.; Emanuel, G.; Hacohen, N. 920 A Single-Cell Spatially Resolved MERFISH Map of the Colorectal Tumor Immune Microenvironment. J. Immunother. Cancer 2021, 9, A965.
- Lu, Y.; Liu, M.; Yang, J.; Weissman, S.M.; Pan, X.; Katz, S.G.; Wang, S. Spatial Transcriptome Profiling by MERFISH Reveals Fetal Liver Hematopoietic Stem Cell Niche Architecture. Cell Discov. 2021, 7, 47.
- Xia, C.; Fan, J.; Emanuel, G.; Hao, J.; Zhuang, X. Spatial Transcriptome Profiling by MERFISH Reveals Subcellular RNA Compartmentalization and Cell Cycle-Dependent Gene Expression. Proc. Natl. Acad. Sci. USA 2019, 116, 19490–19499.
- Zhang, M.; Eichhorn, S.W.; Zingg, B.; Yao, Z.; Cotter, K.; Zeng, H.; Dong, H.; Zhuang, X. Spatially Resolved Cell Atlas of the Mouse Primary Motor Cortex by MERFISH. Nature 2021, 598, 137–143.
- AGBT 2022 Poster: In Situ Single-Cell Transcriptomic Imaging in Formalin-Fixed Paraffin-Embedded Tissues with MERSCOPETM. Available online: https://vizgen.com/resources/agbt-2022-poster/ (accessed on 22 June 2022).
- Caprioli, R.M.; Farmer, T.B.; Gile, J. Molecular Imaging of Biological Samples: Localization of Peptides and Proteins Using MALDI-TOF MS. Anal. Chem. 1997, 69, 4751–4760.
- Zimmerman, T.A.; Monroe, E.B.; Tucker, K.R.; Rubakhin, S.S.; Sweedler, J.V. Chapter 13 Imaging of Cells and Tissues with Mass Spectrometry. In Methods in Cell Biology; Elsevier: Amsterdam, The Netherlands, 2008; Volume 89, pp. 361–390. ISBN 978-0-12-372521-9.
- Celis, J.E.; Gromov, P. Proteomics in Translational Cancer Research: Toward an Integrated Approach. Cancer Cell 2003, 3, 9–15.
- Hanash, S. Disease Proteomics. Nature 2003, 422, 226–232.
- Mann, M.; Hendrickson, R.C.; Pandey, A. Analysis of Proteins and Proteomes by Mass Spectrometry. Annu. Rev. Biochem. 2001, 70, 437–473.
- Berghmans, E.; Van Raemdonck, G.; Schildermans, K.; Willems, H.; Boonen, K.; Maes, E.; Mertens, I.; Pauwels, P.; Baggerman, G. MALDI Mass Spectrometry Imaging Linked with Top-Down Proteomics as a Tool to Study the Non-Small-Cell Lung Cancer Tumor Microenvironment. Methods Protoc. 2019, 2, 44.
- Powers, T.W.; Neely, B.A.; Shao, Y.; Tang, H.; Troyer, D.A.; Mehta, A.S.; Haab, B.B.; Drake, R.R. MALDI Imaging Mass Spectrometry Profiling of N-Glycans in Formalin-Fixed Paraffin Embedded Clinical Tissue Blocks and Tissue Microarrays. PLoS ONE 2014, 9, e106255.
- Lou, S.; Balluff, B.; Cleven, A.H.G.; Bovée, J.V.M.G.; McDonnell, L.A. Prognostic Metabolite Biomarkers for Soft Tissue Sarcomas Discovered by Mass Spectrometry Imaging. J. Am. Soc. Mass Spectrom. 2017, 28, 376–383.
- Paine, M.R.L.; Liu, J.; Huang, D.; Ellis, S.R.; Trede, D.; Kobarg, J.H.; Heeren, R.M.A.; Fernández, F.M.; MacDonald, T.J. Three-Dimensional Mass Spectrometry Imaging Identifies Lipid Markers of Medulloblastoma Metastasis. Sci. Rep. 2019, 9, 2205.
- Schwartz, S.A.; Weil, R.J.; Thompson, R.C.; Shyr, Y.; Moore, J.H.; Toms, S.A.; Johnson, M.D.; Caprioli, R.M. Proteomic-Based Prognosis of Brain Tumor Patients Using Direct-Tissue Matrix-Assisted Laser Desorption Ionization Mass Spectrometry. Cancer Res. 2005, 65, 7674–7681.
- Patel, S.A.; Barnes, A.; Loftus, N.; Martin, R.; Sloan, P.; Thakker, N.; Goodacre, R. Imaging Mass Spectrometry Using Chemical Inkjet Printing Reveals Differential Protein Expression in Human Oral Squamous Cell Carcinoma. Analyst 2009, 134, 301–307.
- Rauser, S.; Marquardt, C.; Balluff, B.; Deininger, S.-O.; Albers, C.; Belau, E.; Hartmer, R.; Suckau, D.; Specht, K.; Ebert, M.P.; et al. Classification of HER2 Receptor Status in Breast Cancer Tissues by MALDI Imaging Mass Spectrometry. J. Proteome Res. 2010, 9, 1854–1863.
- Bauer, J.A.; Chakravarthy, A.B.; Rosenbluth, J.M.; Mi, D.; Seeley, E.H.; De Matos Granja-Ingram, N.; Olivares, M.G.; Kelley, M.C.; Mayer, I.A.; Meszoely, I.M.; et al. Identification of Markers of Taxane Sensitivity Using Proteomic and Genomic Analyses of Breast Tumors from Patients Receiving Neoadjuvant Paclitaxel and Radiation. Clin. Cancer Res. 2010, 16, 681–690.
- Morita, Y.; Ikegami, K.; Goto-Inoue, N.; Hayasaka, T.; Zaima, N.; Tanaka, H.; Uehara, T.; Setoguchi, T.; Sakaguchi, T.; Igarashi, H.; et al. Imaging Mass Spectrometry of Gastric Carcinoma in Formalin-Fixed Paraffin-Embedded Tissue Microarray. Cancer Sci. 2010, 101, 267–273.
- Djidja, M.-C.; Claude, E.; Snel, M.F.; Scriven, P.; Francese, S.; Carolan, V.; Clench, M.R. MALDI-Ion Mobility Separation-Mass Spectrometry Imaging of Glucose-Regulated Protein 78 KDa (Grp78) in Human Formalin-Fixed, Paraffin-Embedded Pancreatic Adenocarcinoma Tissue Sections. J. Proteome Res. 2009, 8, 4876–4884.
- Oppenheimer, S.R.; Mi, D.; Sanders, M.E.; Caprioli, R.M. Molecular Analysis of Tumor Margins by MALDI Mass Spectrometry in Renal Carcinoma. J. Proteome Res. 2010, 9, 2182–2190.
- Lemaire, R.; Ait Menguellet, S.; Stauber, J.; Marchaudon, V.; Lucot, J.-P.; Collinet, P.; Farine, M.-O.; Vinatier, D.; Day, R.; Ducoroy, P.; et al. Specific MALDI Imaging and Profiling for Biomarker Hunting and Validation: Fragment of the 11S Proteasome Activator Complex, Reg Alpha Fragment, Is a New Potential Ovary Cancer Biomarker. J. Proteome Res. 2007, 6, 4127–4134.
- Kang, S.; Shim, H.S.; Lee, J.S.; Kim, D.S.; Kim, H.Y.; Hong, S.H.; Kim, P.S.; Yoon, J.H.; Cho, N.H. Molecular Proteomics Imaging of Tumor Interfaces by Mass Spectrometry. J. Proteome Res. 2010, 9, 1157–1164.
- Herring, K.D.; Oppenheimer, S.R.; Caprioli, R.M. Direct Tissue Analysis by Matrix-Assisted Laser Desorption Ionization Mass Spectrometry: Application to Kidney Biology. Semin. Nephrol. 2007, 27, 597–608.
- Kriegsmann, M.; Casadonte, R.; Kriegsmann, J.; Dienemann, H.; Schirmacher, P.; Hendrik Kobarg, J.; Schwamborn, K.; Stenzinger, A.; Warth, A.; Weichert, W. Reliable Entity Subtyping in Non-Small Cell Lung Cancer by Matrix-Assisted Laser Desorption/Ionization Imaging Mass Spectrometry on Formalin-Fixed Paraffin-Embedded Tissue Specimens. Mol. Cell. Proteom. 2016, 15, 3081–3089.
- Pallua, J.D.; Schaefer, G.; Seifarth, C.; Becker, M.; Meding, S.; Rauser, S.; Walch, A.; Handler, M.; Netzer, M.; Popovscaia, M.; et al. MALDI-MS Tissue Imaging Identification of Biliverdin Reductase B Overexpression in Prostate Cancer. J. Proteom. 2013, 91, 500–514.
- Shruthi, B.; Vinodhkumar, P.; Selvamani, M. Proteomics: A New Perspective for Cancer. Adv. Biomed. Res. 2016, 5, 67.
More
Information
Contributors
MDPI registered users' name will be linked to their SciProfiles pages. To register with us, please refer to https://encyclopedia.pub/register
:
View Times:
758
Revisions:
2 times
(View History)
Update Date:
03 Aug 2022
Table of Contents


Notice
You are not a member of the advisory board for this topic. If you want to update advisory board member profile, please contact office@encyclopedia.pub.
OK
Confirm
Only members of the Encyclopedia advisory board for this topic are allowed to note entries. Would you like to become an advisory board member of the Encyclopedia?
Yes
No
${ textCharacter }/${ maxCharacter }
Submit
Cancel
Back
Comments
${ item }
|
${ item.createdUser.fullName }
${ item.createdAt }
${ item.vote }
${ item.reply }
Delete
${ reply.createdUser.fullName }
${ reply.createdAt }
${ reply.vote }
Delete
There is no reply to this comment~
${ item.replyTextCharacter }/${ item.replyMaxCharacter }
Submit
Cancel
More
No more~
There is no comment~
${ textCharacter }/${ maxCharacter }
Submit
Cancel
${ selectedItem.replyTextCharacter }/${ selectedItem.replyMaxCharacter }
Submit
Cancel
Confirm
Are you sure to Delete?
Yes
No