Your browser does not fully support modern features. Please upgrade for a smoother experience.
Please note this is a comparison between Version 1 by Tushar Garg and Version 2 by Conner Chen.
Technologies based on tissue sections are amongst the most common tools used for both morphologic and molecular characterization of cancers. These tools provide several unique advantages, most notably the preservation of spatial information. Furthermore, many of these assays can be performed on archival tissue, allowing for the post hoc analysis of preserved paraffin embedded samples in tissue banks.
- immune profiling
- tumor microenvironment
- tissue section
- single-cell characterization
1. Introduction
The patient prognosis in various types of cancers has traditionally been predicted with the use of the TNM staging guidelines provided by the American Joint Committee on Cancer and Union for International Cancer Control [1]. However, in recent years there has been increasing interest in using the immune contexture of the primary tumors to predict the patient’s prognosis by looking at the disease-free survival (DFS) and overall survival (OS). Tumor infiltrating lymphocytes (TILs), macrophages, dendritic cells (DC), mast cells, and cells comprise the tumor immune microenvironment. The TILs consist of T lymphocytes (TCRαβ+ T cells, CD8+ TCRαβ T cells, CD4+ TCRαβ+ T cells, TCRγδ+ T cells), B lymphocytes (antigen-presenting B cells, antibody-producing B cells, regulatory B cells) and innate lymphoid cells (natural killer cells and helper-like innate lymphoid cells). A tumor’s immune profile is characterized by analyzing at various parameters such as the density, composition, location, and functional state of TILs [2][3][4][5][2,3,4,5]. TILs play an important and diverse role in the tumorigenesis of cancers. The different subsets of TILs suppress or support the growth of tumor or metastasis through direct interactions and production of soluble factors such as growth factors, cytokines, and chemokines [6]. It has been shown that high lymphocytic infiltration such as CD3+ T cells, CD8+ cytotoxic T cells, and CD45RO+ memory T cells is associated with increased DFS and OS in patients with colorectal carcinoma, melanoma, ovarian cancer, head and neck cancer, bladder carcinoma, breast cancer, liver cancer, prostate cancer, and lung cancer [2][3][7][8][9][10][11][12][13][2,3,7,8,9,10,11,12,13].
One example of how data collected from immune contexture has been used to derive a simple, yet powerful classification system is called the ‘Immunoscore’. The Immunoscore is calculated after the assessment of CD3+ lymphocytes and cytotoxic CD8+ cells is performed using the Immunoscore assay in the tumor center (CT) and tumor margins (IM). The Immunoscore is calculated by looking at the number of cells in CT and TM, and based on this, the patients are divided into five groups from 0 to 4. Immunoscore has been validated internationally by the Society of Immunotherapy for Cancer, which created a consortium to globally evaluate the prognostic value of the Immunoscore in patients with stage I-III colon cancer [14]. In theirs study, 3539 samples were processed from 2681 patients with colon cancer [15]. The Immunoscore was found to be independently associated with time to recurrence and the rate of recurrence at 5 years was found to be significantly lower in patients with a high Immunoscore on cox multivariable analysis [15]. Immunoscore helps to capture a number of different complex mechanisms that affect the tumor progression such as presence of tumor immunogenicity (dependent on microsatellite instability, mismatch repair defect), activation of oncogenic signaling (WNT/β-catenin pathway), and differences in gut microbiota [16][17][18][16,17,18]. As a result of capturing these different mechanisms in one score, Immunoscore was found to be a better predictor for DFS, disease-specific survival and OS when compared to the TNM staging system, and grade of differentiation [15]. In another study conducted by Wirta et al., high Immunoscore was found to predict good 5-year survival in both microsatellite-stable and microsatellite-instable colon cancer [19]. As a result of these studies, the Immunoscore was approved for clinical, diagnostic use in patients with colorectal cancer [8][20][21][8,20,21]. A recent review looked at all the literature regarding the use of Immunoscore in patients with different cancers (colorectal cancer, gastric cancer, non-small cell lung cancer, pancreatic cancer, bladder cancer, head and neck squamous cell cancer, liver cancer, and ovarian cancer) [22]. AIn this review, all patients from these studies were pooled and the OS and DFS in patients with lower Immunoscore was found to be significantly lower when compared to those with higher score [22]. Further information about the predictive capabilities of the tumor immune microenvironment and the Immunoscore are discussed in a recent excellent review [23]. Incorporation of the Immunoscore in the traditionally used classification can lead to significantly improve prognostic and predictive tool development [14][24][14,24].
Interventional radiologists (IRs) play an important role in the biomarker-based evaluation of patients on systemically administered immunotherapies. Image-guided tissue sampling is a cornerstone in the diagnosis, stratification, and longitudinal evaluation of therapeutic efficacy for cancer patients receiving immunotherapies. Furthermore, locoregional interventions performed by IRs inarguably have a profound influence on the local tumor immune microenvironment, and strategies to manipulate local tumor immunity towards an immunostimulatory state through such locoregional interventions has the potential to overcome barriers to systemically administered immunotherapies [25][26][27][28][29][25,26,27,28,29]. A rigorous pursuit along these avenues of research is predicated upon the thorough characterization of the immune microenvironment after locoregional therapies.
2. Tissue Section-Based Immune Profiling
Technologies based on tissue sections are amongst the most common tools used for both morphologic and molecular characterization of cancers. These tools provide several unique advantages, most notably the preservation of spatial information. Furthermore, many of these assays can be performed on archival tissue, allowing for the post hoc analysis of preserved paraffin embedded samples in tissue banks. The archetype assay for tissue section-based analysis is hematoxylin and eosin (HE) staining. This stain can be used to evaluate the TILs in sections of the malignant tissue. The use of HE staining is relatively easy in the clinical practice due to its convenience and low cost. The evaluation of HE-sections is done according to the International Immuno-Oncology Biomarkers Working Group recommendations [30]. A standard slide of 4–5 µm of formalin-fixed and paraffin-embedded (FFPE) tissue is used for TIL evaluation. When evaluating the slides, we fit can be observed rst look at the IM and CT of the tumor under low magnification and semi-quantitatively evaluate the percent of tumor stroma and tumor cell compartment area that is occupied by mononuclear cells (at intervals of 10%) at high magnification (×200–400) [30][31][32][33][30,31,32,33]. TILs are reported as the mononuclear immune cells in the tumor stroma and tumor cell compartment separately, and they are evaluated by taking an average of the density of TILs in five different fields [33]. Specific guidelines for evaluation of TILs in different cancer types is beyond the scope of [30][33][34]this review [30,33,34]. Immunohistochemistry (IHC) (Figure 1) uses monoclonal or polyclonal antibodies to identify specific antigens in the tissue sections [35]. A standard 4–5 µm of FFPE tissue is used for IHC evaluation [33]. In evaluation of the immune microenvironment using standard IHC, the number of CD3+, CD4+, CD8+, CD45+ cells or cancer specific antigen expressing cells are counted manually or by using a detection system in the tumor stroma, cancer cell nests and the whole microscopic field at the IM of the tumor at the magnification of ×400 [33].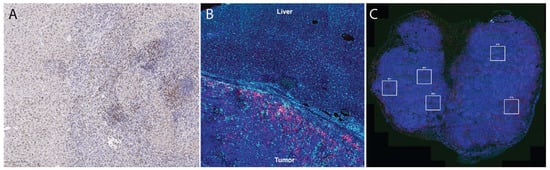
Figure 1. Tissue section-based immune profiling tools. (A), conventional immunohistochemistry of an orthotopic mouse liver tumor demonstrates infiltration of CD8+ cells (DAB, brown color stain) into the tumor. (B), immunofluorescence of CD68+ (light blue) and CD8+ (magenta) illustrates accumulation of macrophages and T cells at the liver-tumor border in a rat model of liver cancer. (C), Multi-color immunofluorescence (pan-cytokeratin = magenta, blue = DAPI, red = CD3, green = CD8) is helpful to characterize accumulation of multiple cell types; in this case, these images were used to draw regions of interest (boxes) within which high-dimensional RNA sequencing was performed using the Nanostring GeoMX platform [26].
2.1. Nanostring nCounter
Nanostring nCounter is a technology that allows direct quantification of the RNA present in the sample without the need for more complicated traditional microarray techniques such as quantitative PCR (qPCR) and RNA-seq. The sensitivity of RNA levels detected with the help of Nanostring nCounter has been found to be similar to that of traditional techniques without the need for amplification or separate enzymatic processing [36][37][38][36,37,38]. Additionally, when the tissue sections are fixed and embedded in paraffin, the RNA present on the tissue sections usually undergoes modification and degradation which makes the gene expression studies such as qPCR and RNA-seq challenging in these samples [39]. These techniques have demonstrated significantly worse quality of results when the input material is FFPE samples [40]. The Nanostring nCounter can be used to accurately measure the RNA expression from FFPE samples. It has been used to quantify the gene signatures from multiple tissue types [36][41][42][43][36,41,42,43]. It has been shown that the freshly prepared RNA and RNA extracted from matched FFPE samples have high correlation (r = 0.9) of transcript levels without the need for RNA purification [44]. The Nanostring nCounter works by providing a unique code to each gene being assayed. It provides multiplexed measurement of gene expression which a large number of mRNA transcripts studied simultaneously. RNA can be extracted from the FFPE slides using the QIAGEN® RNeasy® FFPE Kit. Nanostring nCounter kits designed to work with low quality FFPE samples with as little as 1 ng RNA can allow for analysis of a large number of gene transcripts from severely degraded samples. In total, 100 nanograms of RNA from the sample is hybridized to a custom human gene CodeSet and then processed on the nCounter platform after immobilization with Capture probe. Once the hybridization of the CodeSet with the mRNA has been completed, the next step is transferring the sample to the nCounter Prep Station. At the nCounter Prep Station, the target probes are first aligned and then immobilized in the nCounter Cartridge along with reduction in the excess probes that are inadvertently transferred to the station. The data collection then takes placed in the nCounter Digital Analyzer once the cartridge is placed in it. The target molecule of interest is identified by looking for the reporter probe which has six ordered fluorescent probes. This technology has various disadvantages such as the presence of only 800-predetermined genes which are mainly identified based on publication needs, and it does not provide any spatial information about the expression of genes.2.2. Multiplex Immunofluorescence
Multiplex IHC/immunofluorescence (IF) allows for visualization of multiple markers when evaluating a tissue section, whereas conventional IHC typically only evaluates one to two markers per tissue section. In multiplex IHC/IF, the target proteins are labeled using fluorochromes and then visualized using fluorescence microscopy tools to look at the distribution of these target proteins in a single tissue section (Figure 1). This further allows for evaluation of the relative spatial distribution of, for example, various immune cell types within a tumor. Other clinical applications of multiplex immunofluorescence include understanding transduction signaling pathway activity (pAKT, mTOR, MAPK, EFGR), cell cycle characterization, inflammation, understanding autoimmune disease and neurodegenerative diseases, and identifying lymph node metastasis. Two commercial technologies currently available to perform such analysis are Vectra and CODEX. Vectra is a multispectral immunofluorescence (IF) platform that allows detection of multiple proteins within the cells along with examination of the spatial arrangement of the cell phenotypes. The Vectra platform can be used to simultaneously detect up to nine different of proteins of interest on a single FFPE tissue slide with the help of Opal chemistry and spectral un-mixing. This technology provides information about biomarker expression levels; additionally, it also increases the biomarkers that can visualized at the same time. Vectra platform can automatically load and scan up to 200 slides. After the slides are loaded, they are first pre-scanned at ×4–1 × 10 magnification which is followed by high-power-field (HPF, ×20–×40) imaging of regions of interest in the multispectral mode. The use of multiplex IF images allows comprehensive understanding of complex cellular interactions that are not possible with the use of other methods [45]. Likewise, CO-Detection by inDEXing (CODEX) is a high-parameter multiplex tissue imaging platform that allows analysis of up to 60 markers in single cells on FFPE tissue sections [46][47][48][46,47,48]. It uses oligonucleotide-conjugated antibodies and sequential fluorescent reports for this task. CODEX helps in the generation of detailed information about the distribution of different cellular phenotypes (‘cellular neighborhoods’) in a healthy or diseased tissue while maintaining their morphological structures [46]. It provides critical biological and clinical insight about cell–cell contacts, environmental context, and tissue structure [47]. One of the most important parts of the CODEX methodology relies on the well-designed and validated antibody panel [49][50][51][49,50,51]. CODEX can be used to study disease and identify biomarkers that will be useful in clinical trials to understand the cell interaction on a histological level and predict clinical outcome. Both Vectra and CODEX are Clinical Laboratory Improvement Amendments (CLIA)-certified technologies; however, the results of these technologies are required to be validated in a CLIA-certified laboratory against a gold standard (such as standard IHC), which can be a significant hurdle in the use of these technologies.2.3. Spatial Transcriptomics
Over the past several years, new technologies have become available that marry the high-dimensional capabilities of bulk tissue genomic sequencing tools with the preserved spatial information of tissue section-based tools. These spatial transcriptomic tools are capable of providing unprecedented detail regarding cellular RNA and protein expression without sacrificing information from where the cells are located.2.3.1. Nanostring (GeoMX)
The GeoMX Digital Spatial Profiler (DSP) is a platform that has been developed to use the barcoding technology of nCounter in order to both spatially resolve and digitally quantify the protein and mRNA expression. GeoMX DSP can be used to analyze any sample type such as core needle biopsy, FFPE tissue block, tissue microarray, slide mounted tissue, and fresh frozen tissue based on the availability of sample. This technology uses antibodies for protein detection and RNA probes for mRNA detection. These antibodies and RNA probes are linked to oligonucleotide tags [52]. The DSP allows selection of a region of interest, which is then exposed to UV light to cause delinking of the oligonucleotide tags. Selection of the region of interest is a critical step and can be facilitated with guidance from expert pathologists [53]. These oligonucleotide tags can then be quantified using a standard nCounter assay to assess the amount of protein or mRNA present in different morphological structures. As such, the GeoMX DSP provides a spatially resolved digital profile of the analyzed tissue. The GeoMX DSP uses five different profiling modalities to define the region of interest which include contour, gridded, geometric, rare cell, and segment profiling. GeoMX DSP allows for understanding the spatial distribution of proteins and RNA which can help is discovering biomarkers to predict the patient response to therapy [26][54][55][56][26,54,55,56]. Using GeoMX DSP, it is not possible to profile every cell in a tissue slice due to its limited resolution, whereas imaging-based methods can be used to obtain multiplexed information about every cell in a tissue section [57]. Additionally, previous knowledge about the genes present is required, and only a small number of mRNAs can be investigated at once [58], though this limitation is rapidly being lifted with new integrated workflows that allow analysis of the complete transcriptome within regions of interest.2.3.2. Visium (10× Genomics)
The Visium Spatial Gene Expression platform helps with gene expression profiling at a high-resolution level [59][60][59,60]. Visium allows for spatially profiling of more than 18,000 genes by assessing their RNA expression in FFPE samples with a high resolution across the entire section of the tissue. The process begins with placing the FFPE tissue section on to the Visium gene expression slide which is stained using routine stains and images for histological purposes. The Visium slide with the stained, fixed, and imaged tissue is then loaded into the slide cassette. The RNA on the capture area (6.5 × 6.5 mm) in the FFPE slide is then bound to a capture probe. Extension of probe pairs is performed to include complements of the spatial barcodes and the sequencing library is prepared. The libraries are then sequenced, and the data is visualized to see which genes are expressed in what quantity and at which location. Comparison between NanoString GeoMX DSP and 10x Genomics Visium is shown in Table 1.Table 1. Comparison between commonly used commercially available spatial transcriptional profiling platforms (Adapted from Bassiouni et al. [60]).
| Comparison Parameters | 10× Genomics Visium | NanoString Ge-oMX DSP |
|---|---|---|
| Tissue compatibility | Compatible with fresh frozen tissue | Compatible with fresh frozen tissue and FFPE |
| RNA quality | Needs RNA integrity number >7 | No requirements for RNA quality |
| Tissue preparation | Tissue is mounted on a specialized gene expression slide | Tissue is mounted on a standard microscope slide |
| Tissue size | 6.5 × 6.5 mm per capture area | 14.6 × 36.2 mm |
| Detection area | Within the full capture area | Within user-defined regions of interest |
| Cellular resolution | ~10 cells/feature | ~20–200 cells/region of interest |
| Direct RNA detection | Absent | Present |
| Concurrent protein detection | Present | Present |