Your browser does not fully support modern features. Please upgrade for a smoother experience.
Submitted Successfully!
 +1 credit
Thank you for your contribution! You can also upload a video entry or images related to this topic.
For video creation, please contact our Academic Video Service.
| Version | Summary | Created by | Modification | Content Size | Created at | Operation |
|---|---|---|---|---|---|---|
| 1 | Konstantinos Tziomalos | -- | 1098 | 2022-08-01 11:43:21 | | | |
| 2 | Rita Xu | + 25 word(s) | 1123 | 2022-08-02 02:35:06 | | |
Video Upload Options
We provide professional Academic Video Service to translate complex research into visually appealing presentations. Would you like to try it?
Cite
If you have any further questions, please contact Encyclopedia Editorial Office.
Sofogianni, A.; Stalikas, N.; Antza, C.; Tziomalos, K. Cardiovascular Risk Prediction Models. Encyclopedia. Available online: https://encyclopedia.pub/entry/25729 (accessed on 25 July 2026).
Sofogianni A, Stalikas N, Antza C, Tziomalos K. Cardiovascular Risk Prediction Models. Encyclopedia. Available at: https://encyclopedia.pub/entry/25729. Accessed July 25, 2026.
Sofogianni, Areti, Nikolaos Stalikas, Christina Antza, Konstantinos Tziomalos. "Cardiovascular Risk Prediction Models" Encyclopedia, https://encyclopedia.pub/entry/25729 (accessed July 25, 2026).
Sofogianni, A., Stalikas, N., Antza, C., & Tziomalos, K. (2022, August 01). Cardiovascular Risk Prediction Models. In Encyclopedia. https://encyclopedia.pub/entry/25729
Sofogianni, Areti, et al. "Cardiovascular Risk Prediction Models." Encyclopedia. Web. 01 August, 2022.
Copy Citation
Cardiovascular disease (CVD) is the leading cause of death worldwide. Management of cardiovascular risk factors, particularly hypertension and dyslipidemia, has been shown to reduce cardiovascular morbidity and mortality. Cardiovascular risk prediction is a sine qua non for optimizing cardiovascular prevention strategies, particularly in patients without established CVD or type 2 diabetes mellitus (T2DM).
cardiovascular risk
prediction
equation
1. Introduction
Cardiovascular disease (CVD) is the leading cause of death worldwide [1]. Management of cardiovascular risk factors, particularly hypertension and dyslipidemia has been shown to reduce cardiovascular morbidity and mortality [2][3]. However, current guidelines recommend adjusting the intensity of blood pressure- and lipid-lowering treatment according to the cardiovascular risk of the patient [4][5]. Therefore, cardiovascular risk prediction is a sine qua non for optimizing cardiovascular prevention strategies, particularly in patients without established CVD or type 2 diabetes mellitus (T2DM) [4][5]. As a result, several cardiovascular risk prediction equations have been developed. Nevertheless, it is still unclear which is the optimal prediction risk equation.
2. Systematic Coronary Risk Evaluation (SCORE)
SCORE (Systematic Coronary Risk Evaluation) (Figure 1) predicts the 10-year risk of cardiovascular mortality and was developed from 12 European cohort studies (n = 205,178) with 7934 cardiovascular deaths [6][7]. SCORE takes into account the following parameters: age, sex, systolic blood pressure (SBP), total cholesterol (TC) and smoking [6][7]. The age range is 40 to 65 years old, and patients with established CVD or T2DM are excluded [6][7]. There are three versions of SCORE for low-, high- and very-high-risk countries, respectively, as well as country-specific versions [6][7].
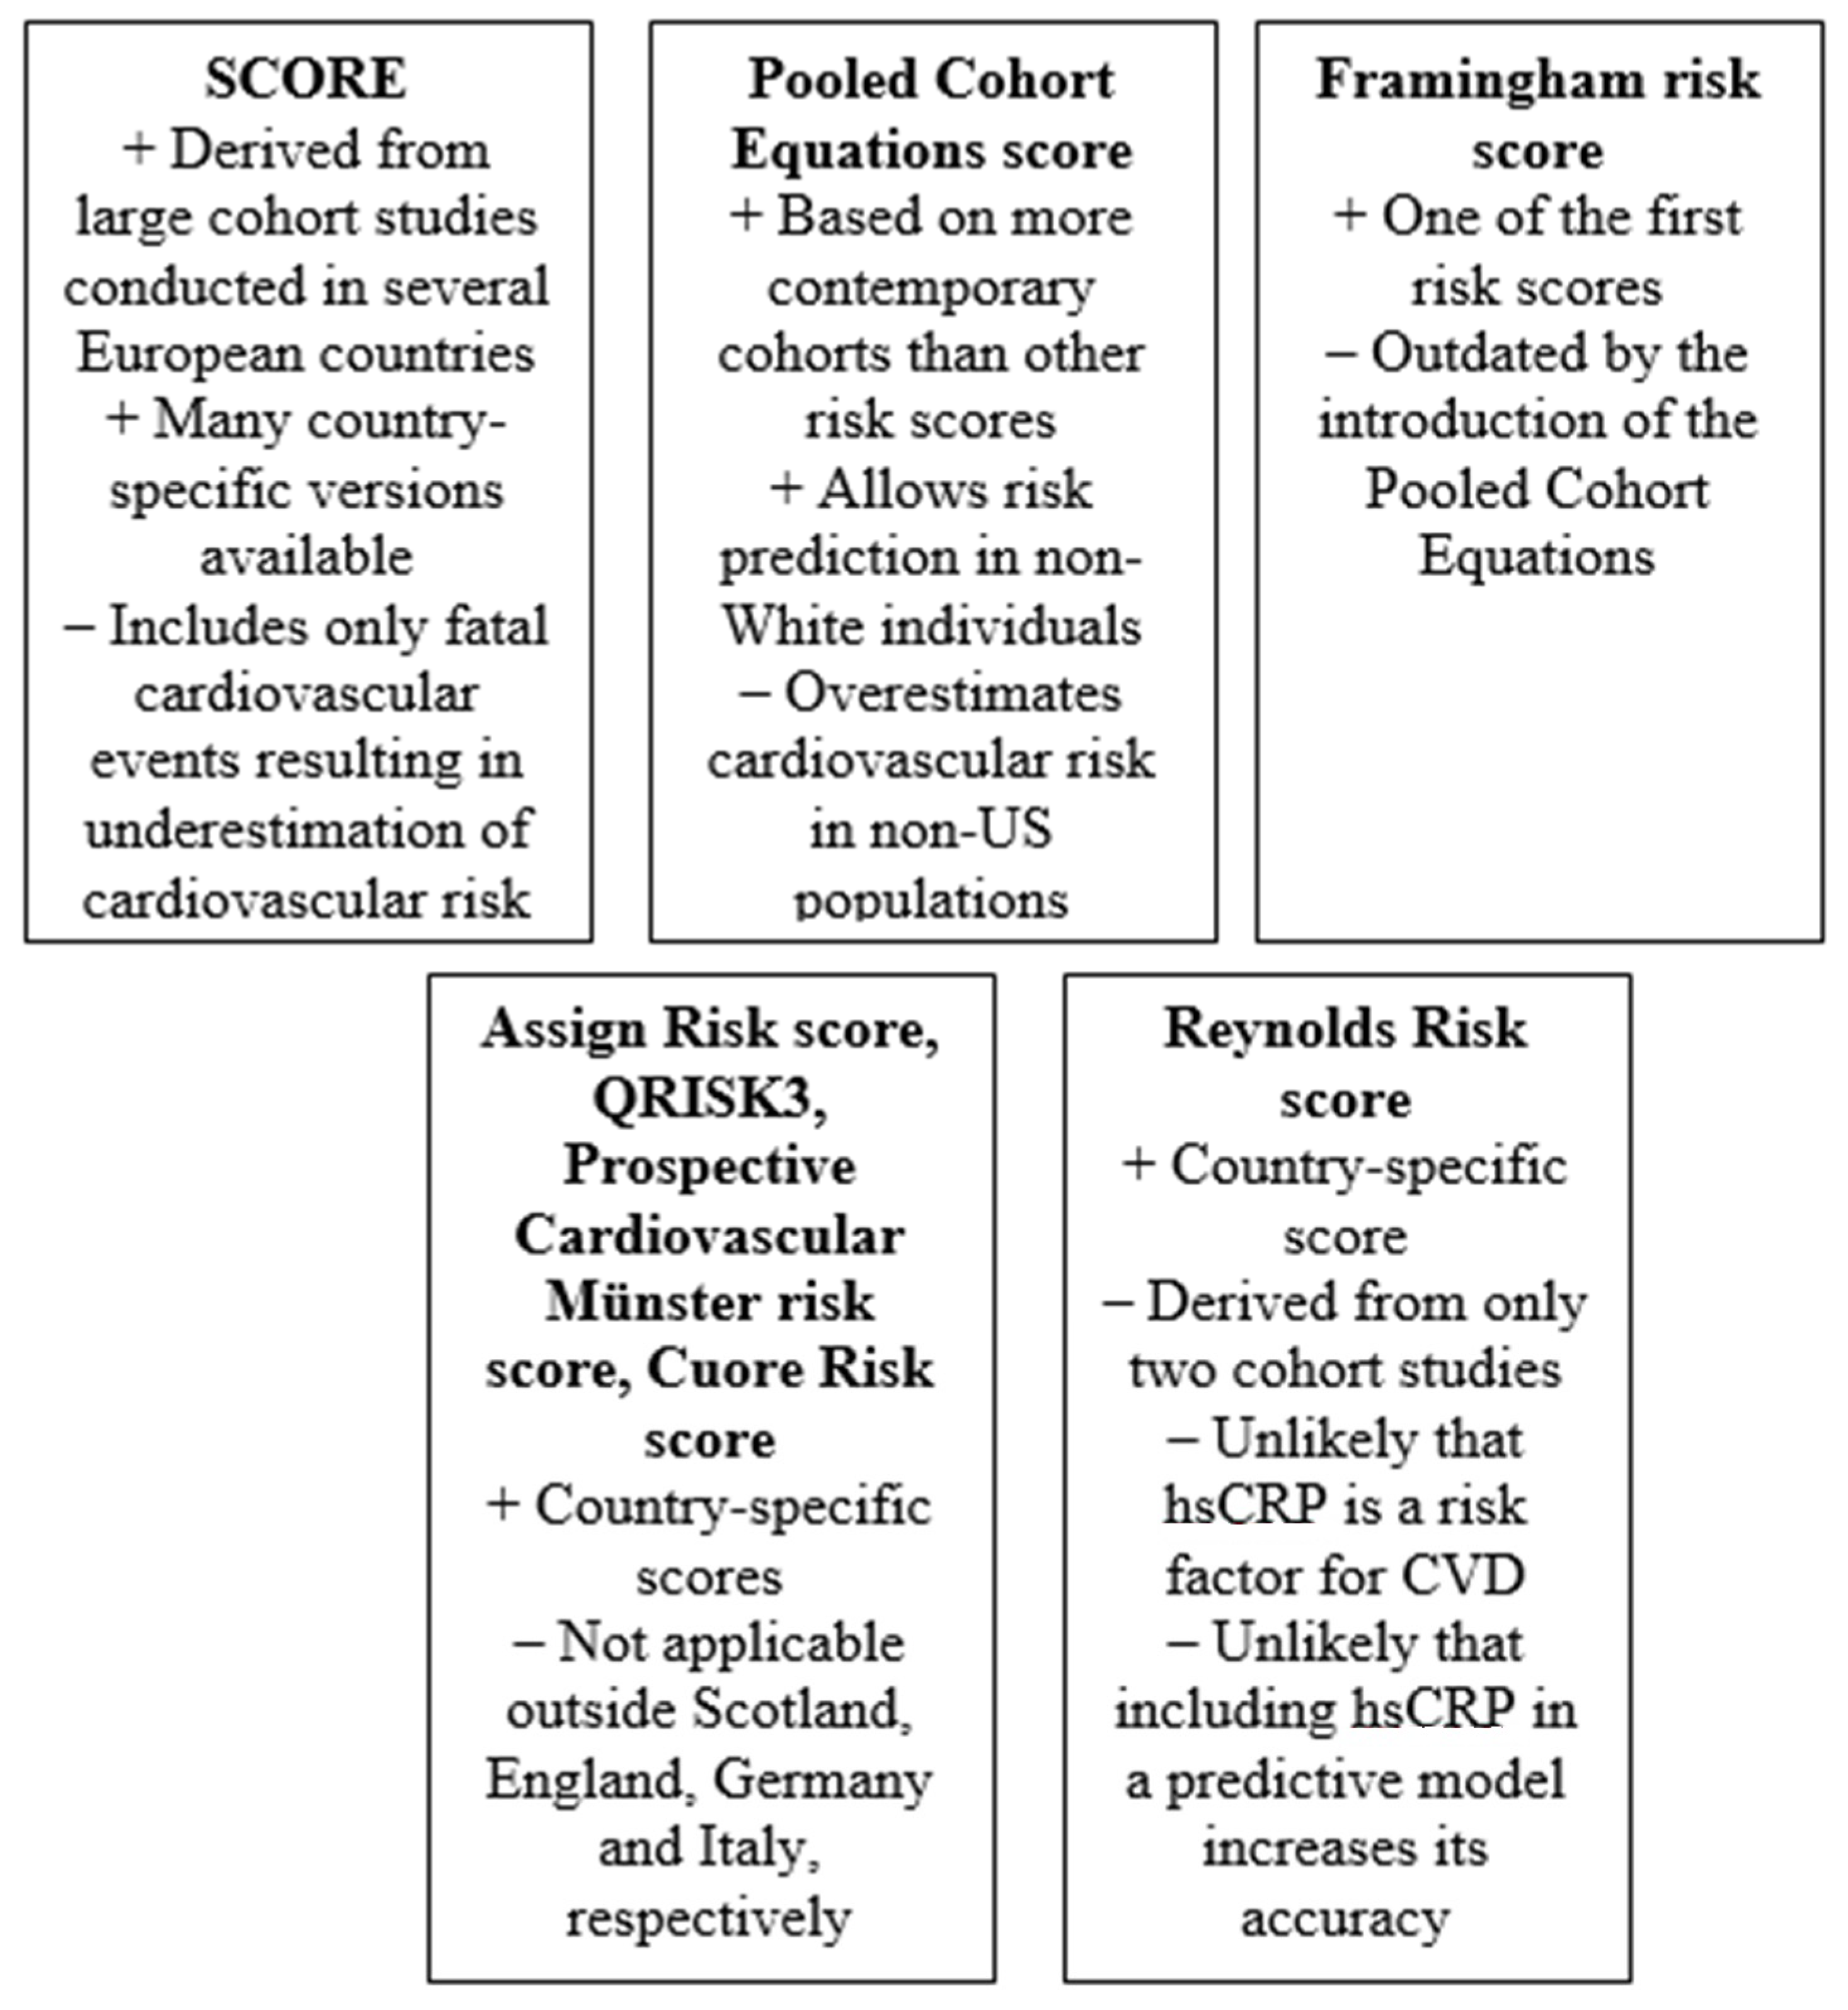
Figure 1. Key advantages and pitfalls of most relevant risk scores (hsCRP: high-sensitivity C-reactive protein; CVD: cardiovascular disease).
A number of studies compared the predictive ability of SCORE with other risk equations. In the Hoorn Study (n = 1482), SCORE was more accurate than the Framingham and UK Prospective Diabetes Study risk equations in patients with normal glucose tolerance [8]. Notably, SCORE was equally precise for estimating risk in patients with normal glucose tolerance and impaired glucose tolerance, but less accurate in patients with T2DM [8]. In a smaller study from Spain (n = 608), both SCORE and Framingham overestimated cardiovascular risk, but the former was more accurate [9]. In another study (n = 1344), SCORE had better specificity than the risk chart developed by the European Society of Hypertension, but the latter was more sensitive [10]. In the Third National Health and Nutrition Examination Survey (n = 5999), the SCORE and the Framingham risk prediction equation discriminated cardiovascular mortality risk equally well [11]. In a large Dutch cohort study (n = 39,719), the SCORE and the Framingham risk prediction equation had similarly good discrimination, but were both inadequately calibrated [12]. In contrast, in the Atherosclerosis Risk In Communities (ARIC) Study (n = 14,343), the SCORE showed worse discrimination than the Framingham equation, possibly because this study was performed in the US [13].
A limited number of studies evaluated the concordance between the SCORE and markers of subclinical atherosclerosis or target-organ damage. In a cohort of 190 patients without symptoms of coronary heart disease (CHD), there was a strong correlation between SCORE and the results of coronary computed tomographic angiography [14]. In another study, the presence of carotid atherosclerotic plaques, urine albumin/creatinine ratio, left ventricular mass and pulse wave velocity predicted cardiovascular risk independently from SCORE and combining the two methods improved the accuracy of SCORE [15].
An important limitation of the SCORE is that it is not applicable in patients older than 65 years. Accordingly, a version of SCORE for older patients has been developed and was evaluated in the European Prospective Investigation of Cancer Norfolk study (n = 6590) [16]. Although this version of SCORE was accurate in predicting cardiovascular mortality, its discriminative action was inadequate [16]. More specifically, it overestimated cardiovascular mortality risk in subjects aged 65–69 years and in normotensive subjects, whereas it underestimated cardiovascular mortality risk in hypertensive patients and in subjects 70–79 years-old [16].
The major advantages of SCORE are that it is derived from large cohort studies conducted in several European countries and that there are many country-specific versions derived from local data, which are expected to be more accurate. The major disadvantages is that it includes only fatal cardiovascular events and might therefore underestimate the total cardiovascular risk.
3. Pooled Cohort Equations Calculator
The Pooled Cohort Equations Calculator, first published in the 2013 American College of Cardiology and American Heart Association guidelines, uses simple parameters such as sex, age, TC, high-density lipoprotein cholesterol (HDL-C), SBP, treatment for hypertension, history of T2DM and smoking status to predict the 10-year risk of a first hard cardiovascular event, defined as nonfatal myocardial infarction (MI), CHD death and fatal or nonfatal stroke [17]. The rationale for the development of this equation was to replace the widely used Framingham risk score because the latter was derived from only White populations and only evaluated the risk of CHD [17]. In contrast, the Pooled Cohort Equations Calculator was created using data from a wider range of studies in both White and African American populations [18][19][20][21][22].
The first validation of the Pooled Cohort Equations score was performed in 2014 from a cohort study, using data from a population similar with the one from which the score was derived [23]. The results showed that the observed and predicted 5-year cardiovascular risk for participants with 10-year predicted risk < 7.5% was similar, while for those at risk ≥ 7.5%, the Pooled Cohort Equations overestimated risk [23]. Ensuing studies including analyses from the Women’s Health Study, the Physicians’ Health Study, the Women’s Health Initiative Observational Study and the National Cardiovascular Data Registry Practice Innovation and Clinical Excellence registry were generally in accordance with this first publication, confirming that the Pooled Cohort Equations score overestimates cardiovascular risk, particularly in elderly subjects [24][25][26][27][28][29][30]. Results from a multi-ethnic cohort show that the observed overestimation is also highest among Chinese (especially for men) and lowest in White women and Hispanic men [31]. When the Pooled Cohort Equations score was evaluated in non-Hispanic White and Black people as well as in Mexican Americans, the prediction of 10-year atherosclerotic CVD mortality was accurate in non-Hispanic White and Black men, but not in women [32].
The Pooled Cohort Equations score was also evaluated for other outcomes, except cardiovascular mortality. It has been reported that this score could be a useful tool to predict and stratify 1-year risk of recurrent stroke and total cardiovascular events in patients with acute ischemic stroke or transient ischemic attack [33]. Compared with the Framingham risk score, the Pooled Cohort Equations score provided a better estimate of racial differences in vascular function and structure [34]. Moreover, a higher score using this equation was found to be associated with increased 24h variability of blood pressure [35] and also with worse health-related quality of life [36].
The major advantages of the Pooled Cohort Equations score is that it is based on more contemporary cohorts than other risk prediction equations and that it also allows risk prediction in non-White individuals. However, the major disadvantage is that it overestimates cardiovascular risk and might result in overtreatment of low-risk subjects.
References
- Townsend, N.; Nichols, M.; Scarborough, P.; Rayner, M. Cardiovascular disease in Europe—Epidemiological update 2015. Eur. Heart J. 2015, 36, 2696–2705.
- Law, M.R.; Morris, J.K.; Wald, N.J. Use of blood pressure lowering drugs in the prevention of cardiovascular disease: Meta-analysis of 147 randomised trials in the context of expectations from prospective epidemiological studies. BMJ 2009, 338, b1665.
- Cholesterol Treatment Trialists’ (CTT) Collaboration; Baigent, C.; Blackwell, L.; Emberson, J.; Holland, L.E.; Reith, C.; Bhala, N.; Peto, R.; Barnes, E.H.; Keech, A.; et al. Efficacy and safety of more intensive lowering of LDL cholesterol: A meta-analysis of data from 170,000 participants in 26 randomised trials. Lancet 2010, 376, 1670–1681.
- Williams, B.; Mancia, G.; Spiering, W.; Agabiti Rosei, E.; Azizi, M.; Burnier, M.; Clement, D.; Coca, A.; De Simone, G.; Dominiczak, A.; et al. 2018 Practice Guidelines for the management of arterial hypertension of the European Society of Hypertension and the European Society of Cardiology: ESH/ESC Task Force for the Management of Arterial Hypertension. J. Hypertens. 2018, 36, 2284–2309.
- Mach, F.; Baigent, C.; Catapano, A.L.; Koskinas, K.C.; Casula, M.; Badimon, L.; Chapman, M.J.; De Backer, G.G.; Delgado, V.; Ference, B.A.; et al. 2019 ESC/EAS Guidelines for the management of dyslipidaemias: Lipid modification to reduce cardiovascular risk. Eur. Heart J. 2020, 41, 111–188.
- Conroy, R.M.; Pyörälä, K.; Fitzgerald, A.P.; Sans, S.; Menotti, A.; De Backer, G.; De Bacquer, D.; Ducimetière, P.; Jousilahti, P.; Keil, U.; et al. Estimation of ten-year risk of fatal cardiovascular disease in Europe: The SCORE project. Eur. Heart J. 2003, 24, 987–1003.
- Mortensen, M.B.; Falk, E. Limitations of the SCORE-guided European guidelines on cardiovascular disease prevention. Eur. Heart J. 2017, 38, 2259–2263.
- van der Heijden, A.A.; Ortegon, M.M.; Niessen, L.W.; Nijpels, G.; Dekker, J.M. Prediction of coronary heart disease risk in a general, pre-diabetic, and diabetic population during 10 years of follow-up: Accuracy of the Framingham, SCORE, and UKPDS risk functions: The Hoorn Study. Diabetes Care 2009, 32, 2094–2098.
- Cañón-Barroso, L.; Muro, E.C.; Herrera, N.D.; Ochoa, G.F.; Hueros, J.I.C.; Buitrago, F. Performance of the Framingham and SCORE cardiovascular risk prediction functions in a non-diabetic population of a Spanish health care centre: A validation study. Scand. J. Prim. Health Care 2010, 28, 242–248.
- Sehestedt, T.; Jeppesen, J.; Hansen, T.; Rasmussen, S.; Wachtell, K.; Ibsen, H.; Torp-Pedersen, C.; Olsen, M.H. Risk stratification with the risk chart from the European Society of Hypertension compared with SCORE in the general population. J. Hypertens 2009, 27, 2351–2357.
- Pandya, A.; Weinstein, M.C.; Gaziano, T.A. A comparative assessment of non-laboratory-based versus commonly used laboratory-based cardiovascular disease risk scores in the NHANES III population. PLoS ONE 2011, 6, e20416.
- Scheltens, T.; Verschuren, W.M.; Boshuizen, H.C.; Hoes, A.W.; Zuithoff, N.P.; Bots, M.L.; Grobbee, D.E. Estimation of cardiovascular risk: A comparison between the Framingham and the SCORE model in people under 60 years of age. Eur. J. Cardiovasc. Prev. Cardiol. 2008, 15, 562–566.
- Mainous, A.G., 3rd; Koopman, R.J.; Diaz, V.A.; Everett, C.J.; Wilson, P.W.; Tilley, B.C. A coronary heart disease risk score based on patient-reported information. Am. J. Cardiol. 2007, 99, 1236–1241.
- Schneer, S.; Bachar, G.N.; Atar, E.; Koronowski, R.; Dicker, D. Evaluation of framingham and systematic coronary risk evaluation scores by coronary computed tomographic angiography in asymptomatic adults. Am. J. Cardiol. 2013, 111, 700–704.
- Sehestedt, T.; Jeppesen, J.; Hansen, T.W.; Wachtell, K.; Ibsen, H.; Torp-Petersen, C.; Hildebrandt, P.; Olsen, M.H. Risk prediction is improved by adding markers of subclinical organ damage to SCORE. Eur. Heart J. 2010, 31, 883–891.
- Verweij, L.; Peters, R.J.G.; Scholte Op Reimer, W.J.M.; Boekholdt, S.M.; Luben, R.M.; Wareham, N.J.; Khaw, K.T.; Latour, C.H.M.; Jorstad, H.T. Validation of the Systematic COronary Risk Evaluation—Older Persons (SCORE-OP) in the EPIC-Norfolk prospective population study. Int. J. Cardiol. 2019, 293, 226–230.
- Goff, D.C., Jr.; Lloyd-Jones, D.M.; Bennett, G.; Coady, S.; D’Agostino, R.B.; Gibbons, R.; Greenland, P.; Lackland, D.T.; Levy, D.; O’Donnell, C.J.; et al. 2013 ACC/AHA guideline on the assessment of cardiovascular risk: A report of the American College of Cardiology/American Heart Association Task Force on Practice Guidelines. J. Am. Coll Cardiol. 2014, 63, 2935–2959.
- The ARIC Investigators. The Atherosclerosis Risk in Communities (ARIC) Study: Design and objectives. Am. J. Epidemiol. 1989, 129, 687–702.
- Fried, L.P.; Borhani, N.O.; Enright, P.; Furberg, C.D.; Gardin, J.M.; Kronmal, R.A.; Kuller, L.H.; Manolio, T.A.; Mittelmark, M.B.; Newman, A.; et al. The Cardiovascular Health Study: Design and rationale. Ann. Epidemiol. 1991, 1, 263–276.
- Friedman, G.D.; Cutter, G.R.; Donahue, R.P.; Hughes, G.H.; Hulley, S.B.; Jacobs, D.R., Jr.; Liu, K.; Savage, P.J. CARDIA: Study design, recruitment, and some characteristics of the examined subjects. J. Clin. Epidemiol. 1988, 41, 1105–1116.
- Dawber, T.R.; Kannel, W.B.; Lyell, L.P. An approach to longitudinal studies in a community: The Framingham Study. Ann. N. Y. Acad. Sci. 1963, 107, 539–556.
- Kannel, W.B.; Feinleib, M.; McNamara, P.M.; Garrison, R.J.; Castelli, W.P. An investigation of coronary heart disease in families. The Framingham offspring study. Am. J. Epidemiol. 1979, 110, 281–290.
- Muntner, P.; Colantonio, L.; Cushman, M.; Goff, D.C.; Howard, G.; Howard, V.J.; Kissela, B.; Levitan, E.; Lloyd-Jones, D.; Safford, M.M. Validation of the atherosclerotic cardiovascular disease Pooled Cohort risk equations. JAMA 2014, 311, 1406–1415.
- DeFilippis, A.P.; Young, R.; Carrubba, C.J.; McEvoy, M.J.W.; Budoff, M.J.; Blumenthal, R.S.; Kronmal, R.A.; McClelland, R.L.; Nasir, K.; Blaha, M.J. An analysis of calibration and discrimination among multiple cardiovascular risk scores in a modern multiethnic cohort. Ann. Intern. Med. 2015, 162, 266–275.
- Emdin, C.A.; Khera, A.V.; Natarajan, P.; Klarin, D.; Baber, U.; Mehran, R.; Rader, D.J.; Fuster, V.; Kathiresan, S. Evaluation of the Pooled Cohort Equations for Prediction of Cardiovascular Risk in a Contemporary Prospective Cohort. Am. J. Cardiol. 2017, 119, 881–885.
- Rospleszcz, S.; Thorand, B.; Gala, T.D.L.H.; Meisinger, C.; Holle, R.; Koenig, W.; Mansmann, U.; Peters, A. Temporal trends in cardiovascular risk factors and performance of the Framingham Risk Score and the Pooled Cohort Equations. J. Epidemiol. Comm. Health 2019, 73, 19–25.
- Mora, S.; Wenger, N.K.; Cook, N.R.; Liu, J.; Howard, B.V.; Limacher, M.C.; Liu, S.; Margolis, K.; Martin, L.W.; Paynter, N.P.; et al. Evaluation of the Pooled Cohort Risk Equations for Cardiovascular Risk Prediction in a Multiethnic Cohort from the Women’s Health Initiative. JAMA Intern. Med. 2018, 178, 1231–1240.
- Nanna, M.G.; Peterson, E.D.; Wojdyla, D.; Navar, A.M. The Accuracy of Cardiovascular Pooled Cohort Risk Estimates in U.S. Older Adults. J. Gen. Intern. Med. 2019, 35, 1701–1708.
- Ridker, P.M.; Cook, N.R. Statins: New American guidelines for prevention of cardiovascular disease. Lancet 2013, 382, 1762–1765.
- Maddox, T.M.; Borden, W.B.; Tang, F.; Virani, S.S.; Oetgen, W.J.; Mullen, J.B.; Chan, P.S.; Casale, P.N.; Douglas, P.S.; Masoudi, F.A.; et al. Implications of the 2013 ACC/AHA cholesterol guidelines for adults in contemporary cardiovascular practice: Insights from the NCDR PINNACLE registry. J. Am. Coll. Cardiol. 2014, 64, 2183–2192.
- DeFilippis, A.P.; Young, R.; McEvoy, J.W.; Michos, E.D.; Sandfort, V.; Kronmal, R.A.; McClelland, R.L.; Blaha, M.J. Risk score overestimation: The impact of individual cardiovascular risk factors and preventive therapies on the performance of the American Heart Association-American College of Cardiology-Atherosclerotic Cardiovascular Disease risk score in a modern multi-ethnic cohort. Eur. Heart J. 2017, 38, 598–608.
- Zhang, Z.; Gillespie, C.; Bowman, B.; Yang, Q. Prediction of atherosclerotic cardiovascular disease mortality in a nationally representative cohort using a set of risk factors from pooled cohort risk equations. PLoS ONE 2017, 12, e0175822.
- Li, H.; Zhang, R.; Liu, G.; Liu, L.; Wang, Y.; Wang, Y. External Validation of Pooled Cohort Risk Equations to Predict 1-Year Clinical Outcome in Ischemic Stroke Patients. Med. Sci. Monit. 2017, 23, 4415–4421.
- Topel, M.L.; Shen, J.; Morris, A.A.; Al Mheid, I.; Sher, S.; Dunbar, S.B.; Vaccarino, V.; Sperling, L.S.; Gibbons, G.H.; Martin, G.S.; et al. Comparisons of the Framingham and Pooled Cohort Equation Risk Scores for Detecting Subclinical Vascular Disease in Blacks Versus Whites. Am. J. Cardiol. 2018, 121, 564–569.
- Celik, M.; Yuksel, U.C.; Yildirim, E.; Gursoy, E.; Koklu, M.; Yasar, S.; Gormel, S.; Gungor, M.; Bugan, B.; Barcin, C. The relationship between blood pressure variability and Pooled Cohort Risk Assessment Equations 10-year cardiovascular risk score. Blood Press Monit. 2016, 21, 282–287.
- Nooe, A.; Edwards, M.K.; Addoh, O.; Loprinzi, P.D. Convergent validity of the ACC/AHA pooled cohort equations in associating with health-related quality of life among adults in the United States. Health Promot. Perspect. 2017, 7, 42–46.
More
Information
Subjects:
Cardiac & Cardiovascular Systems
Contributors
MDPI registered users' name will be linked to their SciProfiles pages. To register with us, please refer to https://encyclopedia.pub/register
:
View Times:
794
Revisions:
2 times
(View History)
Update Date:
02 Aug 2022
Table of Contents


Notice
You are not a member of the advisory board for this topic. If you want to update advisory board member profile, please contact office@encyclopedia.pub.
OK
Confirm
Only members of the Encyclopedia advisory board for this topic are allowed to note entries. Would you like to become an advisory board member of the Encyclopedia?
Yes
No
${ textCharacter }/${ maxCharacter }
Submit
Cancel
Back
Comments
${ item }
|
${ item.createdUser.fullName }
${ item.createdAt }
${ item.vote }
${ item.reply }
Delete
${ reply.createdUser.fullName }
${ reply.createdAt }
${ reply.vote }
Delete
There is no reply to this comment~
${ item.replyTextCharacter }/${ item.replyMaxCharacter }
Submit
Cancel
More
No more~
There is no comment~
${ textCharacter }/${ maxCharacter }
Submit
Cancel
${ selectedItem.replyTextCharacter }/${ selectedItem.replyMaxCharacter }
Submit
Cancel
Confirm
Are you sure to Delete?
Yes
No