2. Systematic Coronary Risk Evaluation (SCORE)
SCORE (Systematic Coronary Risk Evaluation) (
Figure 1) predicts the 10-year risk of cardiovascular mortality and was developed from 12 European cohort studies (n = 205,178) with 7934 cardiovascular deaths
[6][7][6,7]. SCORE takes into account the following parameters: age, sex, systolic blood pressure (SBP), total cholesterol (TC) and smoking
[6][7][6,7]. The age range is 40 to 65 years old, and patients with established CVD or T2DM are excluded
[6][7][6,7]. There are three versions of SCORE for low-, high- and very-high-risk countries, respectively, as well as country-specific versions
[6][7][6,7].
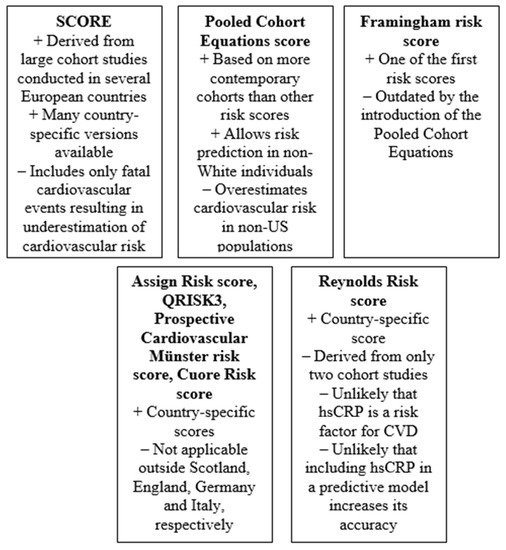
Figure 1. Key advantages and pitfalls of most relevant risk scores (hsCRP: high-sensitivity C-reactive protein; CVD: cardiovascular disease).
A number of studies compared the predictive ability of SCORE with other risk equations. In the Hoorn Study (n = 1482), SCORE was more accurate than the Framingham and UK Prospective Diabetes Study risk equations in patients with normal glucose tolerance
[8]. Notably, SCORE was equally precise for estimating risk in patients with normal glucose tolerance and impaired glucose tolerance, but less accurate in patients with T2DM
[8]. In a smaller study from Spain (n = 608), both SCORE and Framingham overestimated cardiovascular risk, but the former was more accurate
[9]. In another study (n = 1344), SCORE had better specificity than the risk chart developed by the European Society of Hypertension, but the latter was more sensitive
[10]. In the Third National Health and Nutrition Examination Survey (n = 5999), the SCORE and the Framingham risk prediction equation discriminated cardiovascular mortality risk equally well
[11]. In a large Dutch cohort study (n = 39,719), the SCORE and the Framingham risk prediction equation had similarly good discrimination, but were both inadequately calibrated
[12]. In contrast, in the Atherosclerosis Risk In Communities (ARIC) Study (n = 14,343), the SCORE showed worse discrimination than the Framingham equation, possibly because this study was performed in the US
[13].
A limited number of studies evaluated the concordance between the SCORE and markers of subclinical atherosclerosis or target-organ damage. In a cohort of 190 patients without symptoms of coronary heart disease (CHD), there was a strong correlation between SCORE and the results of coronary computed tomographic angiography
[14]. In another study, the presence of carotid atherosclerotic plaques, urine albumin/creatinine ratio, left ventricular mass and pulse wave velocity predicted cardiovascular risk independently from SCORE and combining the two methods improved the accuracy of SCORE
[15].
An important limitation of the SCORE is that it is not applicable in patients older than 65 years. Accordingly, a version of SCORE for older patients has been developed and was evaluated in the European Prospective Investigation of Cancer Norfolk study (n = 6590)
[16]. Although this version of SCORE was accurate in predicting cardiovascular mortality, its discriminative action was inadequate
[16]. More specifically, it overestimated cardiovascular mortality risk in subjects aged 65–69 years and in normotensive subjects, whereas it underestimated cardiovascular mortality risk in hypertensive patients and in subjects 70–79 years-old
[16].
The major advantages of SCORE are that it is derived from large cohort studies conducted in several European countries and that there are many country-specific versions derived from local data, which are expected to be more accurate. The major disadvantages is that it includes only fatal cardiovascular events and might therefore underestimate the total cardiovascular risk.
3. Pooled Cohort Equations Calculator
The Pooled Cohort Equations Calculator, first published in the 2013 American College of Cardiology and American Heart Association guidelines, uses simple parameters such as sex, age, TC, high-density lipoprotein cholesterol (HDL-C), SBP, treatment for hypertension, history of T2DM and smoking status to predict the 10-year risk of a first hard cardiovascular event, defined as nonfatal myocardial infarction (MI), CHD death and fatal or nonfatal stroke
[17]. The rationale for the development of this equation was to replace the widely used Framingham risk score because the latter was derived from only White populations and only evaluated the risk of CHD
[17]. In contrast, the Pooled Cohort Equations Calculator was created using data from a wider range of studies in both White and African American populations
[18][19][20][21][22][18,19,20,21,22].
The first validation of the Pooled Cohort Equations score was performed in 2014 from a cohort study, using data from a population similar with the one from which the score was derived
[23]. The results showed that the observed and predicted 5-year cardiovascular risk for participants with 10-year predicted risk < 7.5% was similar, while for those at risk ≥ 7.5%, the Pooled Cohort Equations overestimated risk
[23]. Ensuing studies including analyses from the Women’s Health Study, the Physicians’ Health Study, the Women’s Health Initiative Observational Study and the National Cardiovascular Data Registry Practice Innovation and Clinical Excellence registry were generally in accordance with this first publication, confirming that the Pooled Cohort Equations score overestimates cardiovascular risk, particularly in elderly subjects
[24][25][26][27][28][29][30][24,25,26,27,28,29,30]. Results from a multi-ethnic cohort show that the observed overestimation is also highest among Chinese (especially for men) and lowest in White women and Hispanic men
[31]. When the Pooled Cohort Equations score was evaluated in non-Hispanic White and Black people as well as in Mexican Americans, the prediction of 10-year atherosclerotic CVD mortality was accurate in non-Hispanic White and Black men, but not in women
[32].
The Pooled Cohort Equations score was also evaluated for other outcomes, except cardiovascular mortality. It has been reported that this score could be a useful tool to predict and stratify 1-year risk of recurrent stroke and total cardiovascular events in patients with acute ischemic stroke or transient ischemic attack
[33]. Compared with the Framingham risk score, the Pooled Cohort Equations score provided a better estimate of racial differences in vascular function and structure
[34]. Moreover, a higher score using this equation was found to be associated with increased 24h variability of blood pressure
[35] and also with worse health-related quality of life
[36].
The major advantages of the Pooled Cohort Equations score is that it is based on more contemporary cohorts than other risk prediction equations and that it also allows risk prediction in non-White individuals. However, the major disadvantage is that it overestimates cardiovascular risk and might result in overtreatment of low-risk subjects.