 +1 credit
| Version | Summary | Created by | Modification | Content Size | Created at | Operation |
|---|---|---|---|---|---|---|
| 1 | Petri Sebastian Kotiranta | -- | 2865 | 2022-07-14 18:20:42 | | | |
| 2 | Rita Xu | + 102 word(s) | 2967 | 2022-07-15 07:40:07 | | | | |
| 3 | Rita Xu | Meta information modification | 2967 | 2022-07-15 07:41:02 | | | | |
| 4 | Rita Xu | Meta information modification | 2967 | 2022-07-15 07:43:34 | | | | |
| 5 | Rita Xu | Meta information modification | 2967 | 2022-07-15 07:44:37 | | |
Video Upload Options
In developing NoSQL databases, a major motivation is to achieve better efficient query performance compared with relational databases. The graph database is a NoSQL paradigm where navigation is based on links instead of joining tables. Links can be implemented as pointers, and following a pointer is a constant time operation, whereas joining tables is more complicated and slower, even in the presence of foreign keys. Therefore, link-based navigation has been seen as a more efficient query approach than using join operations on tables. Existing studies strongly support this assumption. Query complexity has received less attention. For example, in enterprise information systems, queries are usually complex so data need to be collected from several tables or by traversing paths of graph nodes of different types.
1. Introduction
2. Previous Performance Related Study
3. Test Settings
The relational database has 10 tables. The basic tables customer, invoice, target, work, worktype and item represent entities of the application domain. These tables contain the customer information, customer’s invoices, the target (or project) where the work is performed, a listing of each work, and a listing of different worktypes with different prices and information about the items used for each work. Relationships between the entities are stored in relationship tables of worktarget, workinvoice, useditem and workhours. These represent many-to-many relationships between entities. Below image shows the database structure as a relational database schema. Arrows illustrate how the tables are associated with each other. For example, the arrow from the invoice to the customer means that customer_id in the invoice table refers to an id in the customer table.
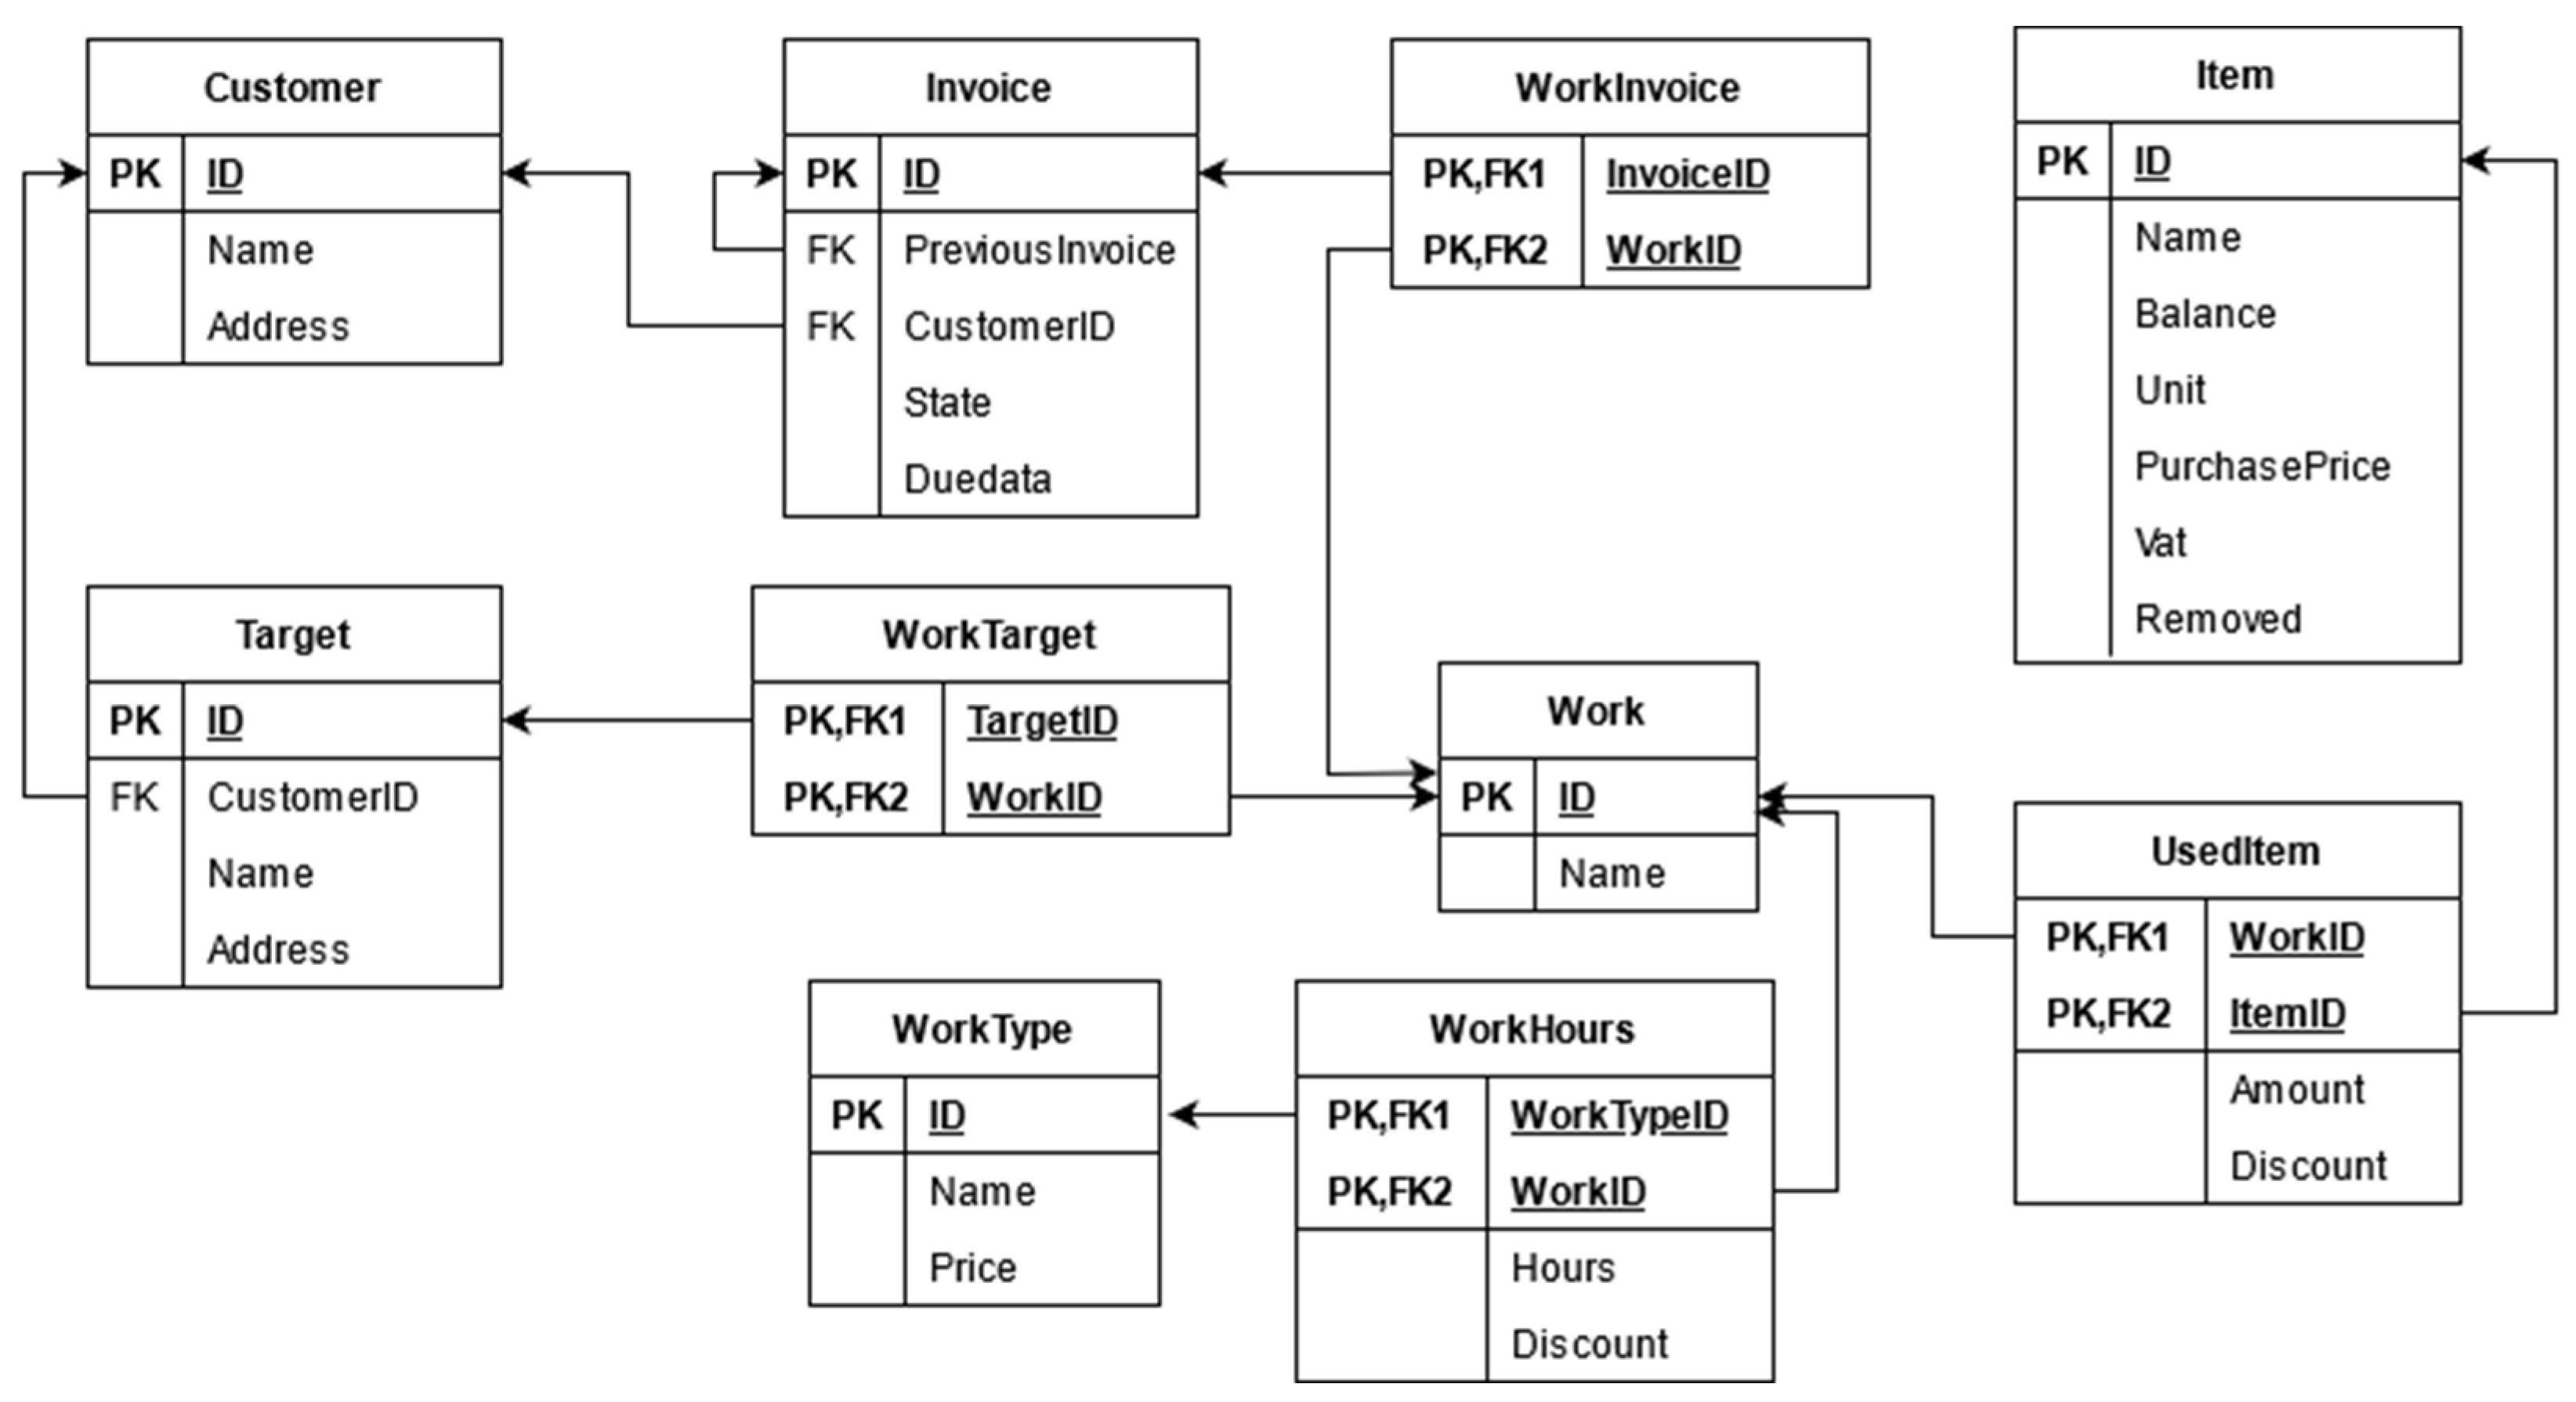
Figure 1. Database structure in relational format.
In the graph database schema, entities are represented as nodes, and relationships as directed edges. Two edges are used to represent many-to-many relationships. Customer, invoice, target, work, and worktype entities are represented as nodes. Relationships PAYS from the customer to invoice, and CUSTOMER_TARGET from the customer to the target, and PREVIOUS_INVOICE from an invoice to another are represented by directed edges, the last being a recursive relationship. WORK_TARGET, WORK_INVOICE, WORKHOURS and USED_ITEM are each represented by two edges. Below image represents the database structure in a graph format. The attributes of nodes and edges are not illustrated.
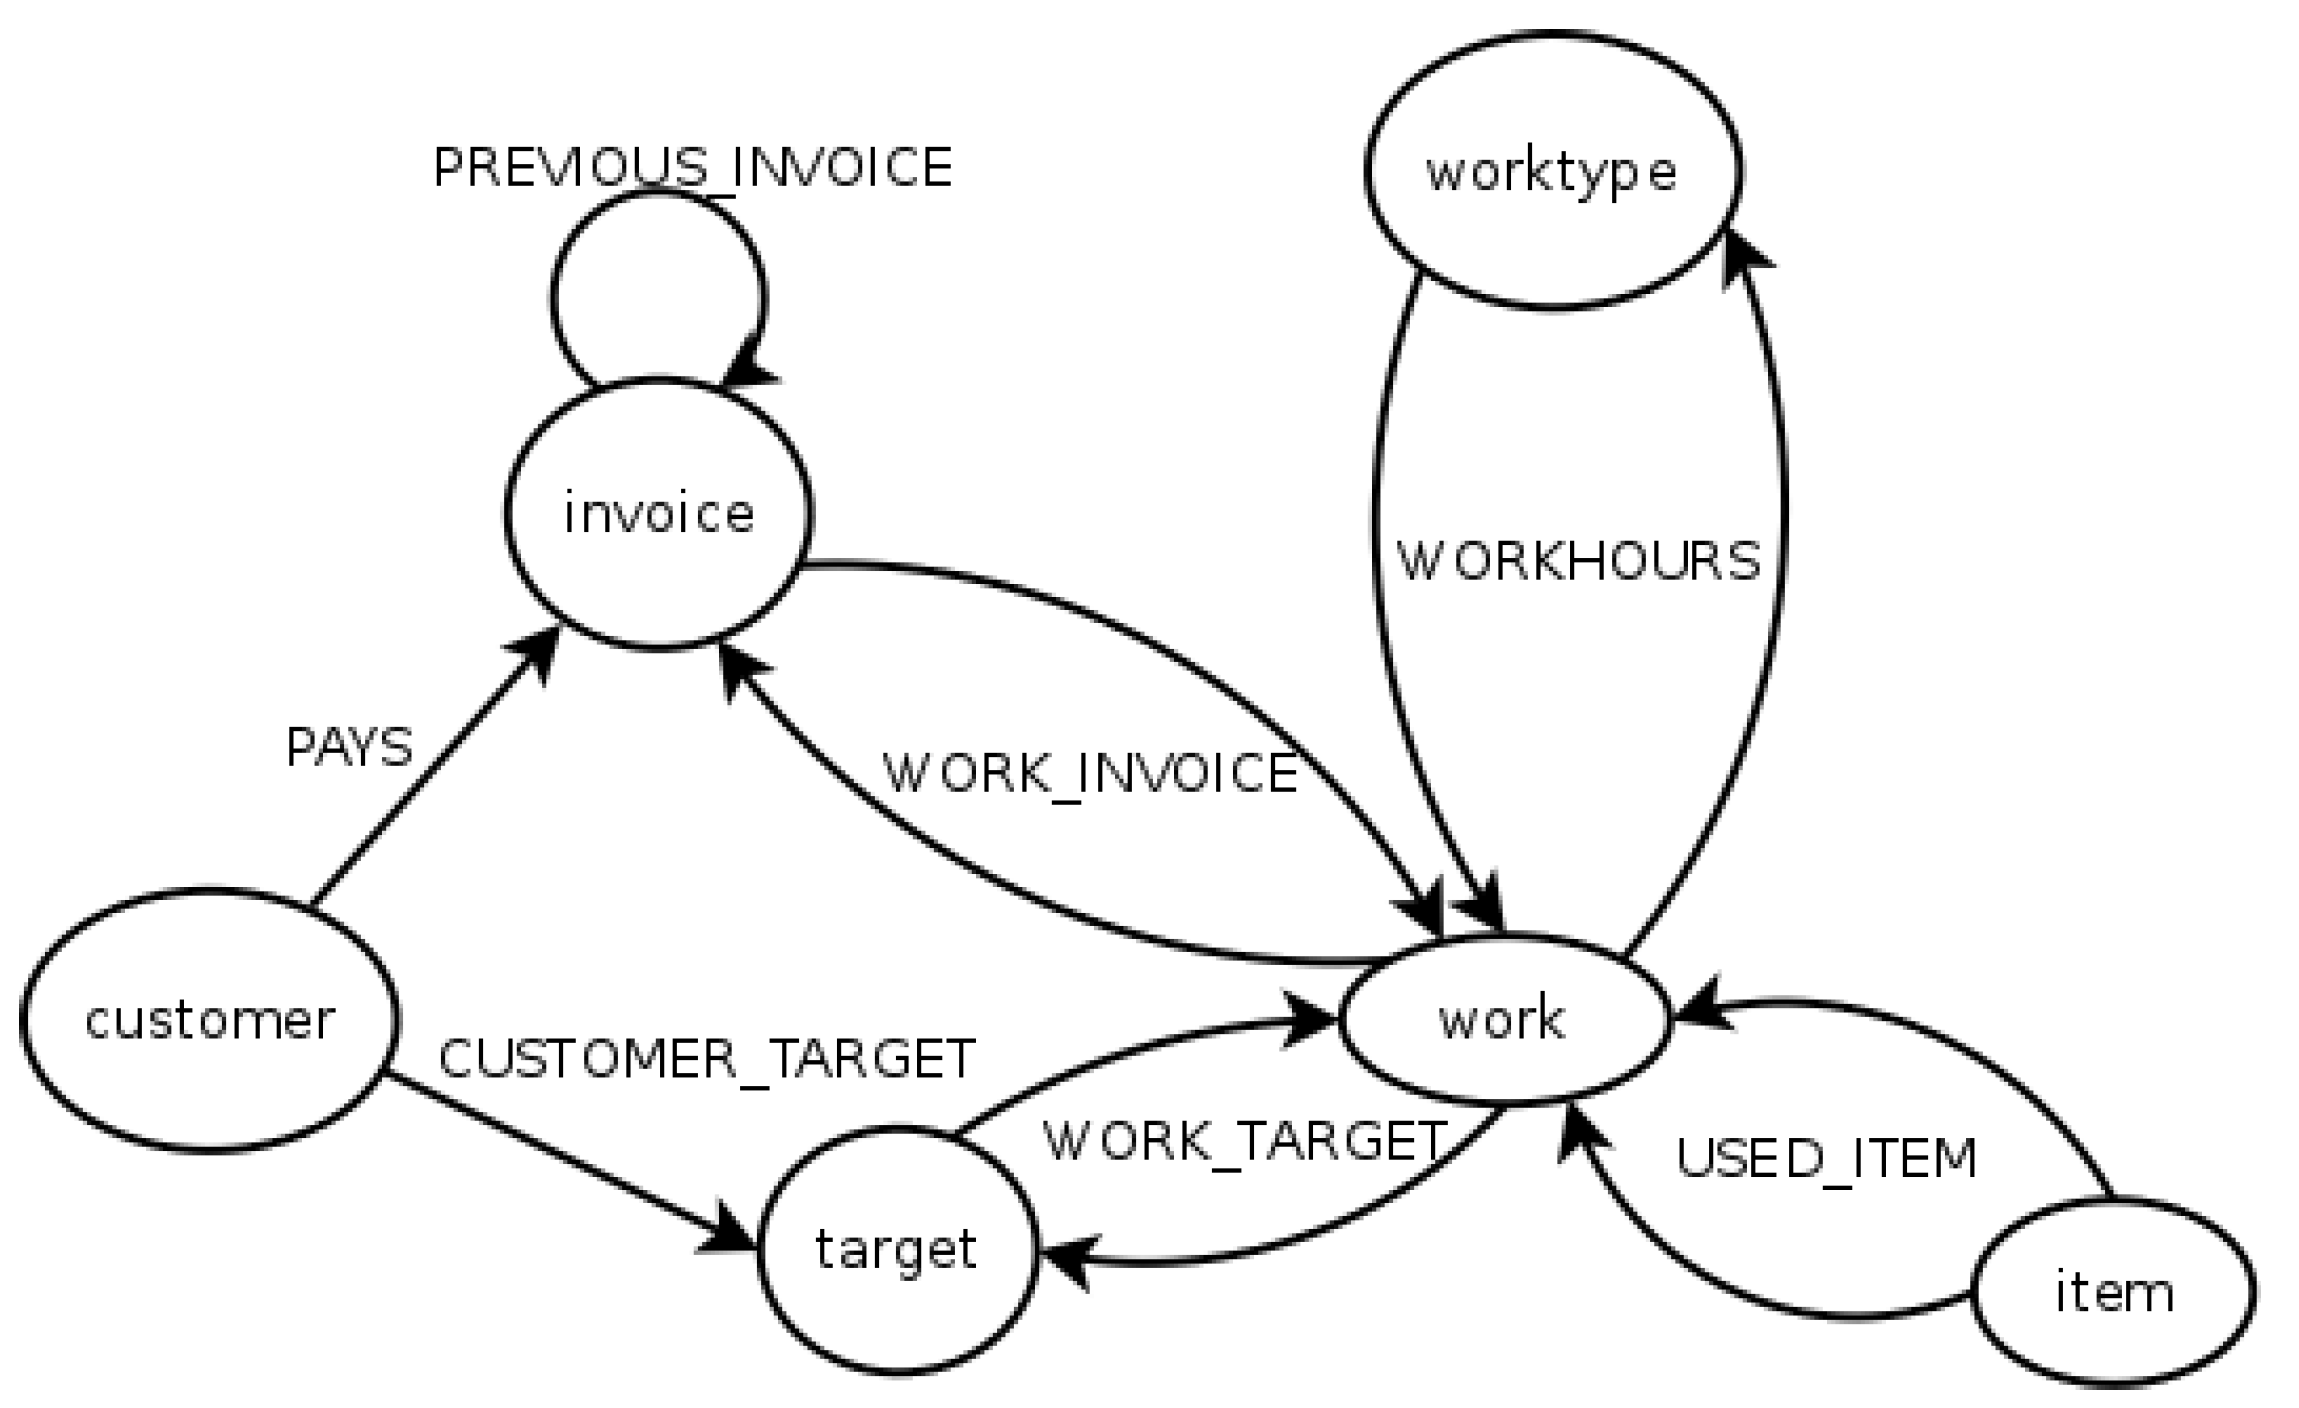
Figure 2. Graph database structure.
The test data follows the schemata of the databases given in previous figures. The used dataset was generated using the test program [6]. Table below shows the numbers of rows/objects generated for the dataset. For each row in the relationship tables of useditem, workhours, workinvoice and worktarget, two respective edges were generated for the Neo4j graph database, as a many-to-many relationship was expressed as a bidirectional relationship, i.e., two edges. The size of relational databases is 214 Mt and the size of Neo4J is 1,12 Gt.
| Table/Object | Rows in SQL | Object in Neo4J |
|---|---|---|
| Customer | 10,000 | 10,000 nodes |
| Invoice | 100,000 | 100,000 nodes |
| Item | 100,000 | 100,000 nodes |
| Target | 100,000 | 100,000 nodes |
| Work | 10,000 | 10,000 nodes |
| Workhours | 100,000 | 200,000 edges |
| Workinvoice | 1,000,000 | 2000,000 edges |
| Worktarget | 1,000,000 | 2,000,000 edges |
| Worktype | 100,000 | 100,000 nodes |
| UsedItem | 100,000 | 200,000 edges |
| Pays | - | 100,000 edges |
| Customertarget | - | 100,000 edges |
| Previousinvoice | 100/1000 | 100/1000 edges |
4. Query Tests
The query tests contain queries with different complexities. A query task represents an information need to be fulfilled using a query to the database, and it is implemented in SQL and Cypher queries. Each task involves the following two Cypher queries: basic form and optimized/CALL forms. The query tasks are ordered from simple to complex starting from the work price and the work price with items ending in the invoice prices, and invoice prices for a given customer. Finally, recursive queries combine all the related invoices.
The tasks were chosen as they represent typical information needs that would be executed in the chosen test databases. Finding and calculating invoice related information the primary use for a database, and this is what all the test queries demonstrated. Querying all the information required for invoices leads to complex queries. Simpler queries were included in order to see how databases perform with different complexities of queries.
Calculating the invoice prices is one of the most important query tasks. The schema does not store invoice prices explicitly. The price must be calculated based on the amount of workhours and the items used. The “price of work” and the “price of work with items” are the subqueries for calculating this price. The queries calculating invoice prices for a given customer add customer information into this task. The recursive queries find all the recursively related invoices given the top-level invoice.
The results of tests are given in tables below. Each query result contains an average time for the query in milliseconds. First table contains the results for the queries related to Tasks 1, 2, 3 and 4. Second table contains the result of recursive queries for Task 5. Second table does not contain results for MySQL 5.1 because MySQL 5.1 does not support those queries. The results are illustrated and further analyzed in the following subsections. Indexed (ind) is the same query on an indexed database. Notably, the performance ranking of different systems varied for different tasks and settings, with the exception that MySQL was always slower than MariaDB.
| MySQL 5 | MySQL 8 | MariaDB | Neo4J | Neo4J CALL | |
|---|---|---|---|---|---|
| Task 1 (Short Query) | |||||
| Avg | 576 | 464 | 486 | 162 | 149 |
| Avg, ind | 453 | 459 | 472 | 173 | 149 |
| Task 2 (Long Query) | |||||
| Avg | 6550 | 5337 | 5549 | 1868 | 1776 |
| Avg, ind | 5190 | 5257 | 5293 | 1968 | 1831 |
| Task 3 (Aggregate Query) | |||||
| Avg | 276,935 | 7674 | 7242 | 212,171 | 209,816 |
| Avg, ind | 251,138 | 7615 | 7117 | 215,053 | 205,198 |
| Task 4 (Aggregate Query with defined key) | |||||
| Avg | 3,938,500 | 5212 | 59 | 33 | 57 |
| Avg, ind | 3,891,082 | 5227 | 57 | 26 | 55 |
| MySQL 8 | MariaDB | Neo4J | Neo4J Optimized | |
|---|---|---|---|---|
| Recursive Query, 100 entities | ||||
| Avg | 7850 | 9152 | 73 | 42 |
| Avg, ind | 1 | 1 | 72 | 42 |
| Recursive Query, 1000 entities | ||||
| Avg | 79,037 | 92,917 | 331,338 | 2146 |
| Avg, ind | 2 | 4 | 208,573 | 2127 |
5. Conclusions
The present study compared relational database systems (MariaDB and two versions of MySQL) and a graph database system (Neo4j) efficiency using queries with different com- plexities. The results support earlier studies where graph database systems outperformed relational database systems with structurally simple datasets and simple queries. However, with more complex queries new relational database systems outperformed Neo4j.
The significantly better performance of new relational database systems compared to MySQL 5.1 is not surprising as the tested MariaDB and MySQL 8.0.29 versions are 10 years newer, and many developments have occurred during that time. Although MariaDB is based on old MySQL, it offers a different feature set and is completely open source. One significant change after MySQL 5.1.41 is a change in the default storage engine from MyISAM to InnoDB in version 5.5. InnoDB is used as a default storage engine of MariaDB. The study indicates the extent to which relational database query performance has improved during the last one and half decade.
Neo4j outperformed modern relational database systems in most of the query tasks. Using the best settings of database systems, Neo4J was often at least three times faster than modern relational databases. However, in the task where an aggregated value was calculated for the given entity, Neo4J was 200 times faster than MySQL 8.0.29. In this task, the most essential difference between modern databases also appeared. MariaDB was over 90 times faster than MySQL 8.0.29. In the most complex query task, MariaDB was 29 times faster than Neo4j when indices were used and Neo4J query was optimized. In the same setting, MySQL 8.0.29 was 27 times faster than Neo4J. The role of optimization and indexing played an essential role in performance, especially in the long recursive query. Without indexing, basic Neo4J was the slowest, but the optimized query was the fastest. Indexing changes the situation, i.e., relational database systems outperformed Neo4J. MySQL 8.0.29 performed best. It was over 1000 times faster than the optimized Neo4J query and over 100,000 times faster than basic Neo4J.
The general conclusion is that on the basis of tests with the data set and queries, it cannot be generally concluded which of the database systems possesses the best query efficiency. In other words, the efficiency depends on the complexity of data and queries. Furthermore, query optimization and indexing may play important roles. This means that when choosing a database for an application domain, the query needs must be analyzed carefully beforehand. The results in the present study show how a relational database system is still a good alternative when it comes to performance compared with an NoSQL graph database.
References
- Khan, W.; Ahmad, W.; Luo, B.; Ahmed, E. SQL Database with physical database tuning technique and NoSQL graph database comparisons. In Proceedings of the 2019 IEEE 3rd Information Technology, Networking, Electronic and Automation Control Conference (ITNEC), Chengdu, China, 15–17 March 2019; pp. 110–116.
- Holzschuher, F.; Peinl, R. Performance of graph query languages: Comparison of cypher, gremlin and native access in Neo4j. In Proceedings of the Joint EDBT/ICDT 2013 Workshops, Genova, Italy, 18–22 March 2013.
- Khan, W.; Shahzad, W. Predictive performance comparison analysis of relational & NoSQL graph databases. Int. J. Adv. Comput. Sci. Appl. 2017, 8, 523–530.
- Vicknair, C.; Macias, M.; Zhao, Z.; Nan, X.; Chen, Y.; Wilkins, D. A comparison of a graph database and a relational database: A data provenance perspective. In Proceedings of the 48th Annual Southeast Regional Conference, Oxford, MI, USA, 15–17 April 2010; pp. 1–6.
- Batra, S.; Tyagi, C. Comparative analysis of relational and graph databases. Int. J. Soft Comput. Eng. (IJSCE) 2012, 2, 509–512.
- GitHub. InvoicingDBTestBench Repository. Available online: https://github.com/homebeach/InvoicingDBTestBench (accessed on 13 December 2020).
- DB-Engines. Available online: https://db-engines.com/ (accessed on 20 June 2022).
- Tongkaw, S.; Tongkaw, A. A comparison of database performance of MariaDB and MySQL with OLTP workload. In Proceedings of the IEEE Conference on Open Systems (ICOS), Langkawi, Malaysia, 10–12 October 2016.
- Difallah, D.E.; Pavlo, A.; Curino, C.; Cudre-Mauroux, P. Oltp-bench: An extensible testbed for benchmarking relational databases. Proc. VLDB Endow. 2013, 7, 277–288.
- Shalygina, G.; Novikov, B. Implementing common table expressions for MariaDB. In Proceedings of the 2nd Conference on Software Engineering and Information Management (SEIM-2017), St. Petersburg, Russia, 21 April 2017.
- Stanescu, L. A Comparison between a Relational and a Graph Database in the Context of a Recommendation System. In Proceedings of the 16th Conference on Computer Science and Intelligence Systems, Online, 2–5 September 2021.
- Sholichah, R.; Jayanty, M.I.; Andry, A. Performance Analysis of Neo4j and MySQL Databases using Public Policies Decision Making Data. In Proceedings of the 7th International Conference on Information Technology, Computer, and Electrical Engineering (ICITACEE), Semarang, Indonesia, 24–25 September 2021.
- Cheng, Y.; Ding, P.; Wang, T.; Lu, W.; Du, X. Which category is better: Benchmarking relational and graph database management systems. Data Sci. Eng. 2019, 4, 309–322.

