Your browser does not fully support modern features. Please upgrade for a smoother experience.
Submitted Successfully!
 +1 credit
Thank you for your contribution! You can also upload a video entry or images related to this topic.
For video creation, please contact our Academic Video Service.
| Version | Summary | Created by | Modification | Content Size | Created at | Operation |
|---|---|---|---|---|---|---|
| 1 | Li-Yan Xu | -- | 3355 | 2022-05-25 04:17:53 | | | |
| 2 | Lindsay Dong | -23 word(s) | 3332 | 2022-05-25 10:19:39 | | |
Video Upload Options
We provide professional Academic Video Service to translate complex research into visually appealing presentations. Would you like to try it?
Cite
If you have any further questions, please contact Encyclopedia Editorial Office.
Xu, L.; Chen, Y.; Li, E. A Bioinformatics Workflow of Metabolomics Analysis. Encyclopedia. Available online: https://encyclopedia.pub/entry/23325 (accessed on 23 July 2026).
Xu L, Chen Y, Li E. A Bioinformatics Workflow of Metabolomics Analysis. Encyclopedia. Available at: https://encyclopedia.pub/entry/23325. Accessed July 23, 2026.
Xu, Li-Yan, Yang Chen, Enmin Li. "A Bioinformatics Workflow of Metabolomics Analysis" Encyclopedia, https://encyclopedia.pub/entry/23325 (accessed July 23, 2026).
Xu, L., Chen, Y., & Li, E. (2022, May 25). A Bioinformatics Workflow of Metabolomics Analysis. In Encyclopedia. https://encyclopedia.pub/entry/23325
Xu, Li-Yan, et al. "A Bioinformatics Workflow of Metabolomics Analysis." Encyclopedia. Web. 25 May, 2022.
Copy Citation
Metabolomics is an emerging field that quantifies numerous metabolites systematically. The key purpose of metabolomics is to identify the metabolites corresponding to each biological phenotype, and then provide an analysis of the mechanisms involved. Although metabolomics is important to understand the involved biological phenomena, the approach’s ability to obtain an exhaustive description of the processes is limited. Thus, an analysis-integrated metabolomics, transcriptomics, proteomics, and other omics approach is recommended. Such integration of different omics data requires specialized statistical and bioinformatics software.
metabolomics
metabolomics analysis tools
metabolic pathways summary
multi-omics integration algorithms
1. Introduction
Metabolomics is a rapidly evolving field that deals with the high-throughput characterization of metabolites, and is the study of the metabolite composition of cell types, tissues, organs, or organisms [1][2]. Metabolomics is the collection of endogenous small molecules that mark specific fingerprints of cellular biochemistry [3]. It measures numerous low-molecular weight metabolites, such as amino acids, sugars, fatty acids, lipids, and steroids [4]. Small modifications in the chemical structure and some external stimuli (e.g., infections and allergens) can dramatically change the function of a metabolite [5][6][7]. Metabolites, in addition to being produced directly by the host organism, can be derived by host microbiota or transformed from dietary, xenobiotic or other exogenous sources [8].
2. The Analysis Workflow of Metabolomics
The specific characteristics of metabolomics data require the application of different bioinformatics tools following a specific workflow (Figure 1). The first step in the metabolomics workflow involves using different techniques to isolate and characterize different groups of metabolites. There are two main platforms of metabolomics analysis: mass spectrometry (MS) and nuclear magnetic resonance (NMR) spectroscopy. Each has its own advantages and disadvantages [9]. MS-based metabolomics is generally preceded by a separation step, which reduces the complexity of the biological sample and allows MS analysis of different sets of molecules at different time [10]. MS acquires spectral data in the form of a mass-to-charge ratio (m/z) and a relative intensity of the ionized compound [11]. The most common separation techniques in MS technology are liquid chromatography (LC) and gas chromatography (GC) columns (LC-MS and GC-MS, respectively) [12]. MS allows for the reliable identification of metabolites. Especially when MS is used in tandem with chromatographic separation methods, its resolving ability is improved. At the same time, MS has a short analysis cycle (with an analysis time ranging from 5 to 140 min) and allows for selective qualitative and quantitative analyses. Therefore, this technique is the most widely used. The main disadvantages of MS are the high cost of the instruments and the requirement for sample separation or purification prior to putting the sample into the mass spectrometer. NMR is a spectroscopic technique based on the principle of energy absorption and re-emission by atomic nuclei due to variations in an external magnetic field [13]. The spectral data generated by NMR can be used to quantify the concentration and characterize the chemical structure of metabolites. The advantages of NMR are that it is a nondestructive and highly reproducible technique, and does not require extensive sample preparation [14]. In particular, NMR has the ability to provide a high degree of structural information in a short time. Nevertheless, NMR has a lower sensitivity, which means that lower concentrations of potentially important compounds can be masked by larger peaks, and thus cannot be identified [15].
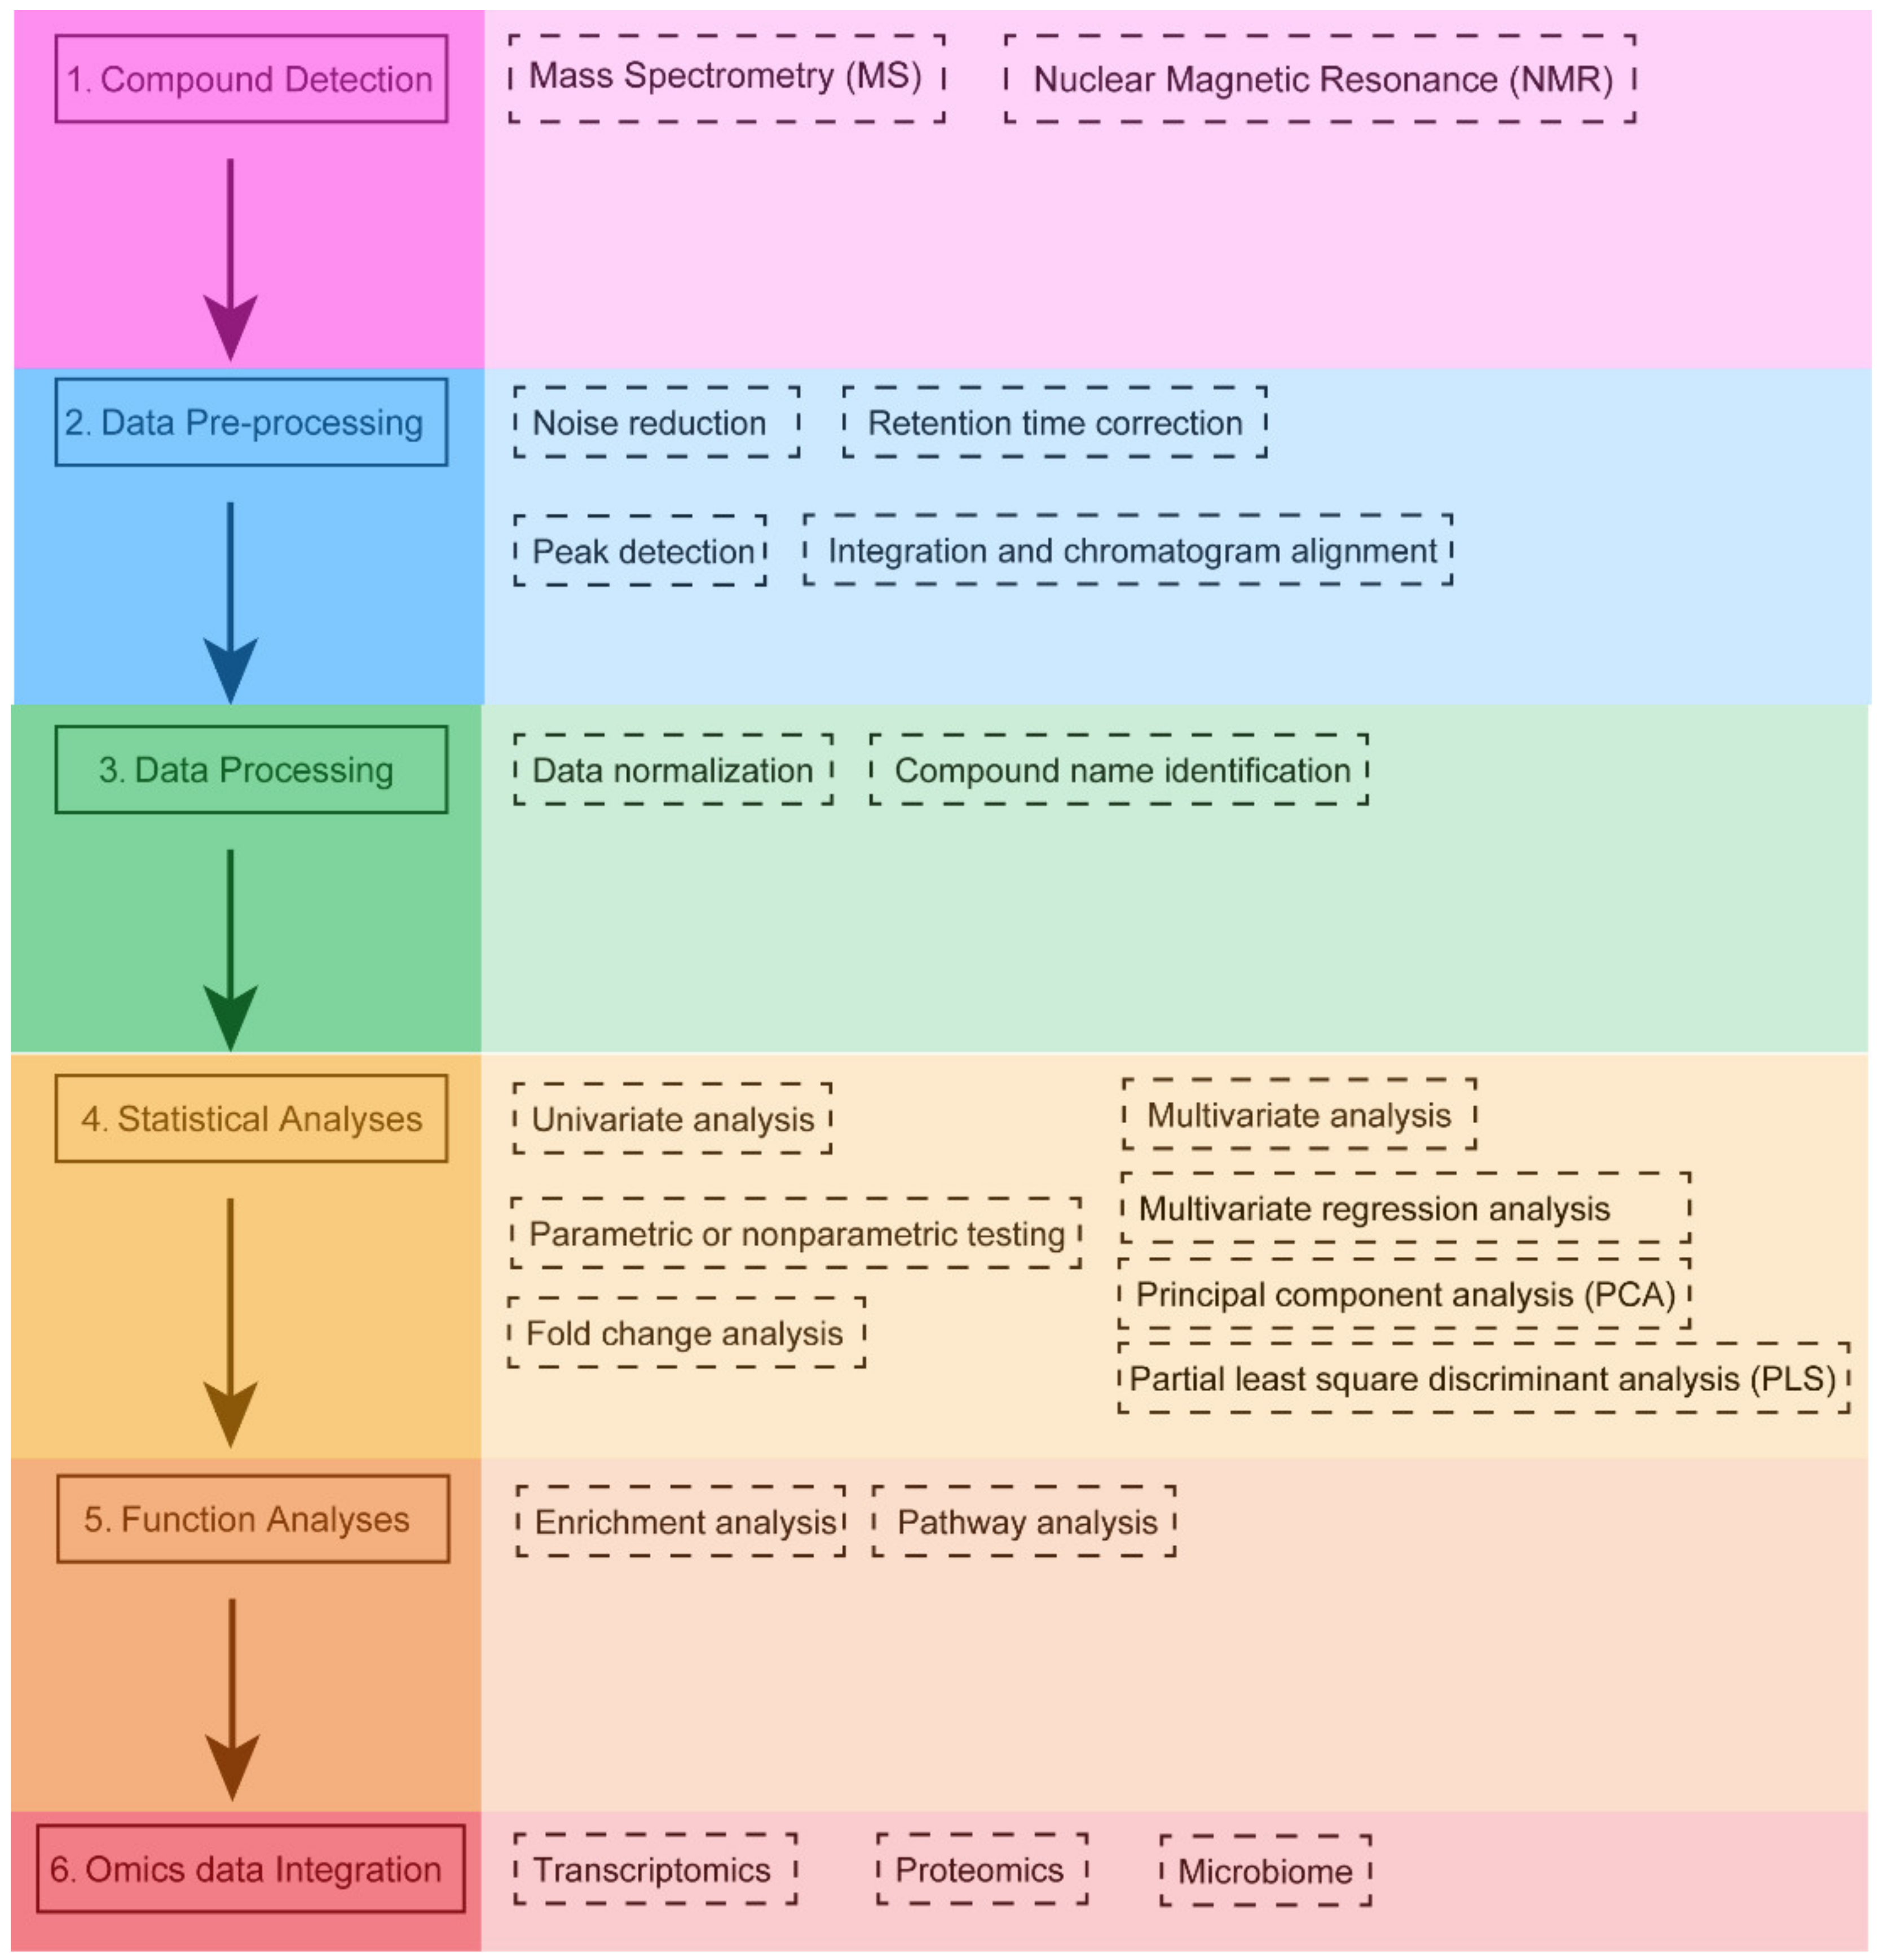
Figure 1. Typical workflow of metabolomics analysis. Metabolites are detected by using specific detection techniques (compound detection). Raw signals are then pre-processed to produce data in a suitable format for subsequent statistical analysis (data pre-processing). Then, data normalization is used to reduce the system and technical bias. For untargeted studies, metabolites are identified from spectral information in some given database (data processing). Univariate and multivariate statistical analyses are used to identify significantly expressed metabolites (statistical analyses). Next, the significantly expressed metabolites are subsequently linked to the biological context by using enrichment and pathway analysis (function analyses). Finally, metabolomics data may be integrated with other omics data (transcriptomics, proteomics, or the microbiome) to gain a comprehensive understanding of the molecular mechanisms of pathophysiological processes (Omics data Integration).
The second step is the preprocessing of raw signals (chromatograms, spectra, or NMR data) by specific software for quantitative analysis of compounds. (e.g., XCMS [16], MAVEN [17] or MZmine3 [18]). In general, this step includes noise reduction, retention time correction, peak detection and integration, and chromatographic alignment.
In the third step, data processing is performed, and quality control (QC) is necessary. Data from QC samples are used to separate different-quality (high or low) data, balance the analytical platform’s bias, and correct for noise in the signal. QC samples are used to determine the variance of metabolite features. If the variance of a feature is too high, it will be removed from the analysis [12][19]. Then, data normalization is used to reduce systematic bias or technical variation and to avoid misidentification due to disparate input of large amounts of metabolomics data. Subsequently, mass spectrometry peak data are used for compound identification by comparing it to authentic standard data (typically through an in-house library). In the absence of an in-house library, researchers can also apply public databases for compound identification.
In the next step, the screened metabolites are linked to their biological context by pathway and enrichment analysis. The aim of enrichment analysis is to explore the profile of functionally relevant metabolites to determine the link between changes in metabolite expression and biological context. This allows the use of a list of altered metabolites to suggest biological pathways or disease conditions that would indicate the subsequent steps in the study. The goal of pathway analysis is to identify pathways that have a significant impact on a specific biological process. Enrichment and pathway analyses are performed using specialized software tools [20] that map metabolites to known biochemical pathways based on information in public databases such as KEGG [21]. Subsequently, investigators typically use network visualization tools to present and understand their results.
Multi-omics data integration and analysis pipelines for studying the pathogenesis of disease and the influence of environmental risk factors are scarce. In this last step, an integrated multi-omics platform provides a reliable and understandable overview of metabolic changes [20]. The identified metabolites and metabolic pathways can be integrated with other omics data, which may help us to obtain more comprehensive information about the biological phenomena.
3. Statistical Analysis in Metabolomics
3.1. Univariate Analysis
Univariate analysis usually provides a preliminary overview of data characteristics that may be important in identifying the conditions under study. For two-group data (both unpaired and paired analyses), scholars can perform fold change analysis, t-tests, and volcano plots. For multi-group data, scholars can perform one-way analysis of variance (ANOVA), as well as related post hoc analysis and correlation analysis.
3.2. Multivariate Analysis
Since multi-omics data usually contain some characteristics that vary with phenotype or experimental conditions, the use of multivariate analyses that allow simultaneous observation and analysis of more than two statistical variables is recommended. Multivariate analysis includes multiple variance analysis (ANOVA), multiple regression analysis, factor analysis, principal component analysis (PCA), partial least squares discriminant analysis (PLS), cluster analysis, and machine learning (e.g., random forest and SVM). Because multivariate analysis uses the weighted averages to summarize the original variables in fewer variables, they are useful for exploratory data analysis. PCA analysis starts from the interrelationship between the original variables, linearly transforms them to several independent composite indicators (i.e., principal components) according to the principle of variance maximization, takes two to three principal components for graphing, visually describes the differences in metabolic patterns and clustering results between different groups, and searches for the original variables that contribute to intergroup classification as biomarkers through loadings plots. PCA is commonly used as a pre-analysis and quality control step for metabolomics data to observe whether there are intergroup classification trends and data outlier points. PCA can also be used to analyze whether quality control samples are clustered together, or if they are scattered or have some variability, which would indicate problems with the quality of the assay.
4. Software Tools for Metabolomics Data Analysis and Integration
4.1. MS-DIAL
MS-DIAL was previously developed as free data pre-processing software for LC-MS data processing, but now the MS-DIAL 4.0 tool can also process LC-MS, GC-MS, and NMR data, in particular to obtain deconvoluted spectra from high-resolution GC-MS data as a prerequisite for compound identification (MS-DIAL 4.0, Hiroshi Tsugawa, Kanagawa, Japan) [22][23]. MS-DIAL offers multiple data-acquisition processing and includes the spectra for compound ID. It also includes normalization and statistical analysis options (http://prime.psc.riken.jp/, accessed on 31 March 2022) [22]. MS-DIAL has an internal GC/MS database, as well as silica retention time and MS/MS database for LC-MS/MS-based lipidomics [23].
4.2. MZmine 3
MZmine 3 (Tomáš Pluskal, Prague, Czech) is an open source software for mass spectrometry data processing that focuses on LC-MS data but can still handle GC-MS and NMR data (http://mzmine.github.io/, accessed on 13 January 2022). This software includes a complete workflow for LC-MS data analysis, including raw data processing, data filtering and peak identification, isotope detection, statistical analysis, and visualization [18].
4.3. El-MAVEN
El-MAVEN (Shubhra Agrawal, Cambridge, USA) is an open source desktop software for processing LC-MS, GC-MS and NMR data labeled in open formats (mzXML, mzML, CDF) [24]. This software has a graphical and command line interface, integrates with a cloud-based platform for storage, and conducts further analyses, such as relative fluxes and quantification [24]. El-MAVEN features a multi-file chromatography comparator, a peak feature detector, and an isotope calculator. El-MAVEN is more powerful, faster, and more user-friendly than Maven, and includes an additive calculator, fragment spectra matching, and peak editor. The El-MAVEN installer is available for Windows and Mac OS (www.elucidata.io/el-maven, accessed on 31 March 2022). Users can download the latest versions of these platforms-. Additionally, developers can follow the instructions to build El-MAVEN on Windows, Ubuntu, or Mac OS to set up the development environment (64-bit platforms only).
4.4. LipidMatch
LipidMatch can be used to annotate lipids detected by LC-MS (http://secim.ufl.edu/secim-tools/lipidmatch/, accessed on 31 March 2022). The LipidMatch fragment library contains over 250,000 lipid species spanning over 50 lipid types [25]. Users can annotate lipids in feature tables generated by its optimized peak picking and filtering strategy. LipidMatch is also used for the annotation of direct infusion and imaging experiments. The software is modular, which makes it suitable for a variety of workflows, and researchers can use it with a variety of peak picking software (e.g., MZmine 3, XCMS (Gary Siuzdak, California, USA), and MS-DIAL 4.0). LipidMatch also provides its lipid libraries in csv format and the R scripts for LipidMatch.
4.5. LipiDex
LipiDex (Joshua J Coon, Madison, WI, USA) is a unified software that can be used for lipid identification by LC-MS/MS. It has the ability to greatly reduce manual processing bias and improve the confidence of identification [26]. When using LipiDex, researchers first create a library of lipid spectra, then use fragment templates to build composite lipid spectra and mass spectrometry fragment models, and subsequently correlate spectral identifications with chromatographic peaks to generate LC-MS/MS lipidomic datasets with high confidence. LipiDex can automatically filter peak lists for additive peaks, endogenous fragments, and dimers (https://github.com/coongroup/LipiDex, accessed on 31 March 2022).
4.6. MetFlow
MetFlow is a web-based tool developed in 2019 (http://metflow.zhulab.cn/, accessed on 13 January 2022) [27]. It offers a standardized workflow for metabolomics data processing and is an interactive web server. Researchers can also use it to perform data cleaning and differential analysis. Its functions include: (1) batch alignment, (2) data quality check and visualization, (3) missing value processing and outlier removal, (4) data normalization and integration, (5) statistical analysis, (6) performance validation, and (7) pathway enrichment analysis. The software enables users with little knowledge in programming and statistics to perform metabolomics data analysis. MetFlow is simple to operate. It has excellent graphic visualization ability (Figure 2a–f) and it can verify the results by uploading test data. However, its disadvantages are that the uploaded file format is fixed, and its pathway enrichment analysis cannot provide the visualization of specific pathways. Therefore, scholars cannot intuitively find the role of metabolites in the pathway.
4.7. MetaboAnalyst 5.0
MetaboAnalyst 5.0 is a comprehensive, freely accessible web-based metabolomics analysis platform (https://www.metaboanalyst.ca/, accessed on 13 January 2022). It was first developed in 2009 [28], then updated in 2012 (MetaboAnalyst 2.0 [29]), in 2015 (MetaboAnalyst 3.0 [30]), in 2019 (MetaboAnalyst 4.0 [20]) and in 2021 (MetaboAnalyst 5.0 [31]). It can be locally installed at the same time. MetaboAnalyst provides comprehensive online tools for metabolomics data analysis, statistical analysis, functional annotation, and visualization of data. MetaboAnalyst 5.0 improves its analytical performance and user interactivity. The platform provides four major functional modules that can be classified into 12 categories: (1) statistical analysis (statistics, biomarker analysis, multifactor/time series analysis, power analysis); (2) functional analysis (metabolome enrichment analysis, metabolic pathway analysis, mass spectrometry peak prediction of pathway activity); (3) data integration and systems biology (biomarker meta-analysis, joint-pathway analysis, and network explorer) and (4) data processing and utility functions (compound ID conversion, batch effect correction, lipidomics, and links to several spectra analysis tools). The advantages of MetaboAnalyst 5.0 are that it supports several formats of uploaded data, and the statistical methods are more selective. The wide variety of pathway analysis methods can also meet most needs. MetaboAnalyst 5.0 has a corresponding R package, which greatly improves the autonomy of metabolomics analysis. In addition, multiple databases are linked for multi-omics analysis. Nevertheless, MetaboAnalyst 5.0 did not have the analysis module for integration of the metabolome and microbiome, which is a disadvantage of most metabolomics analysis software.
4.8. LipidSig
LipidSig is a web-based platform for the comprehensive analysis of lipidomic data [32]. It contains five main functions: (1) profiling (for pre-processing data), (2) differential expression, (3) machine learning, (4) correlation analysis, and (5) network. LipidSig can also create interactive plots and generate downloadable images and corresponding tables (http://chenglab.cmu.edu.tw/lipidsig/, accessed on 31 March 2022).
4.9. LION
LION/web enables statistical analysis of lipids. Additionally, the most powerful feature of the software is the integration of more than 50,000 lipids with biophysical, biochemical and cell biological features, allowing a comprehensive enrichment of lipids [33]. Additionally, the scholars developed a web-based interface based on LION for easy operation by researchers (www.lipidontology.com, accessed on 31 March 2022).
4.10. METLIN
The METLIN tandem mass spectrometry (MS/MS) database was created in 2003 and made publicly available in 2005 [34] to help identify metabolites. At that time, no such database existed for identifying metabolites. In 2018, to improve the coverage of metabolites and help annotate them, in silico MS/MS spectra were generated on additional molecules in METLIN. These data were based on machine learning algorithms, the METLIN database, and the unique fragmentation information (provided by stable isotopes) [35]. METLIN is a free cloud-based platform and metabolite database. It has since grown from a small collection of MS/MS spectra on 100 metabolites in its first iteration to more than 10,000 metabolites in 2012 [36], with an additional 12,000 metabolites and compounds having been analyzed in the last 5 years.
4.11. PaintOmics 3
PaintOmics 3 is a web-based resource for the integrated visualization of multi-omics data types on KEGG pathway diagrams (www.paintomics.org, accessed on 13 January 2022) [37]. PaintOmics 3 combines data analysis with data visualization, providing researchers with an efficient framework for their multi-omics data. Unlike other visualization tools, PaintOmics 3 covers a comprehensive pathway analysis workflow, including automatic feature name conversion, multi-layered feature matching, pathway enrichment, network analysis, heatmaps, trend charts, and more. It accepts a wide variety of omics types, including transcriptomics, proteomics, and metabolomics, as well as region-based approaches such as ATAC-seq or ChIP-seq data. However, the input data need to be pre-processed.
4.12. 3Omics
3Omics is a web-based tool that was developed in 2013 (http://3omics.cmdm.tw, accessed on 13 January 2022). It is used to analyze, integrate, and visualize transcriptome, proteome, and metabolome human data [38]. 3Omics supports correlation analysis, phenotype mapping, pathway enrichment analysis, and co-expression analysis. In fact, depending on the input data, the software offers four parts of integrated analyses: (1) transcriptomics, proteomics, and metabolomics (T-P-M), (2) transcriptomics and proteomics (T-P), (3) proteomics and metabolomics (P-M) and (4) transcriptomics and metabolomics (T-M). A single omics analysis mode is also available in the tool. 3Omics can also carry out text mining of the biomedical literature through information Hyperlinked Over Protein (iHOP [39]) to supplement missing information. The drawback is that pathway enrichment analysis cannot provide the visualization of specific pathways.
4.13. IMPaLa
IMPaLA is a web tool for transcriptomics, proteomics, and metabolomics pathway analysis (http://impala.molgen.mpg.de, accessed on 13 January 2022) [40]. It was developed in 2011. The web tool uses over 3000 pre-annotated approaches from 11 databases to perform over-expression or enrichment analysis on uploaded metabolites and gene lists. Therefore, it is possible to identify pathways that may be regulated at the transcriptional level, metabolic level, or both. The output results of the tool include a ranked list of pathways, the size of each pathway and the p-value and q-values from the joint analysis of genes and metabolites. By clicking on the pathway name, users will be guided to a summary web page at the source database. Results can also be downloaded as a tab-delimited file.
4.14. MetPA
MetPA is a user friendly, web-based tool for the analysis and visualization of metabolomics data (http://metpa.metabolomics.ca, accessed on 13 January 2022) [41]. It combines pathway enrichment analysis programs and pathway topology feature analysis to help identify the most relevant metabolic pathways. The results are displayed in an interactive network visualization system that can be selected, dragged, and zoomed in and out. In addition, this tool offers a comprehensive compound library for metabolite name conversion, and it can also implement various univariate analyses. MetPA currently supports the analysis and visualization of 874 metabolic pathways in 11 common model organisms and it has been integrated into the MetaboAnalyst 5.0 platform.
4.15. MassTRIX
MassTRIX is a web-based software for metabolomics pathway enrichment analysis [42]. The input data of this tool require a mass peak list from high-precision MS experiments. MassTRIX marks the identified chemical compounds as differentially colored objects on the KEGG pathway maps. Therefore, users can interpret the metabolic state of the organism based on the original organism and the true enzymatic capabilities in the case of submitted transcriptomics data. The tools’ output page summarizes the number of identified metabolites on all available pathways and gives a list of all metabolites that are annotated on any given pathway of the organism. Here, users should note that in some cases multiple alternative annotations may be found. The MassTRIX web server is freely accessible at http://masstrix.org (accessed on 13 January 2022).
4.16. MetaCore™
MetaCore™ (http://thomsonreuters.com/metacore/, accessed on 13 January 2022) is a commercial tool used as a web-based application. The software can analyze different kinds of high-throughput molecular data. MetaCore™ is also a high-quality database of mammalian biology, with collections including metabolites and other molecular classes, bioactive molecules and their interactions, signal transduction and metabolic pathways. It also enables genomic analysis, identifies potentially important variants, and provides data visualization, analysis, and data mining. Unfortunately, no detailed information is available on how MetaCore™ works.
4.17. OmicsNet
OmicsNet (www.omicsnet.ca, accessed on 31 March 2022) can integrate different omics data based on molecular interaction knowledge and visualization using network analysis. It also can annotate SNPs, microbial taxa, or LC-MS peaks for network analysis [43]. The network analysis can contain genes, proteins, transcription factors (TF), miRNAs and metabolites, and the creation of different types of biological networks is derived from multiple molecular interaction databases (PPI, TF-gene, miRNA-gene, and metabolic protein interactions).
5. The Integration Algorithm of Multi-Omics Data
The development of an efficient and practical multi-omics algorithm is important to interpret the results of metabolomics.
In 2018, Pedersen et al. [44] proposed a calculation protocol, detailing and discussing dimensionality reduction technology and the subsequent method of integrating and interpreting multi-omics data. Dimensionality reduction of the different omics data was achieved through data normalization, the combination of co-abundant genes and metabolites, and the integration of existing biological knowledge. Using prior knowledge to overcome the functional redundancy among microbiome species is a major advancement of the method compared with existing alternative methods. Researchers can integrate multi-omics data with host physiology variables or any other phenotypes of interest to perform a three-pronged analysis to identify potential mechanistic connections through this framework and then test it through experimentation. Although it is a framework for a human metabolome-microbiome study, it is generalizable to other organisms and environmental metagenomes, and it could also be used for studies including other omics data (e.g., transcriptomics and proteomics). The R code of the protocol is available at https://bitbucket.org/hellekp/clinical-micro-meta-integration (accessed on 13 January 2022).
References
- Patti, G.J.; Yanes, O.; Siuzdak, G. Innovation: Metabolomics: The apogee of the omics trilogy. Nat. Rev. Mol. Cell Biol. 2012, 13, 263–269.
- Zhang, A.; Sun, H.; Wang, X. Serum metabolomics as a novel diagnostic approach for disease: A systematic review. Anal. Bioanal. Chem. 2012, 404, 1239–1245.
- Gowda, G.A.; Zhang, S.; Gu, H.; Asiago, V.; Shanaiah, N.; Raftery, D. Metabolomics-based methods for early disease diagnostics. Expert Rev. Mol. Diagn. 2008, 8, 617–633.
- Turi, K.N.; Romick-Rosendale, L.; Ryckman, K.K.; Hartert, T.V. A review of metabolomics approaches and their application in identifying causal pathways of childhood asthma. J. Allergy Clin. Immunol. 2018, 141, 1191–1201.
- Idle, J.R.; Gonzalez, F.J. Metabolomics. Cell Metab. 2007, 6, 348–351.
- Pacchiarotta, T.; Deelder, A.M.; Mayboroda, O.A. Metabolomic investigations of human infections. Bioanalysis 2012, 4, 919–925.
- Scrivo, R.; Casadei, L.; Valerio, M.; Priori, R.; Valesini, G.; Manetti, C. Metabolomics approach in allergic and rheumatic diseases. Curr. Allergy Asthma Rep. 2014, 14, 445.
- Johnson, C.H.; Patterson, A.D.; Idle, J.R.; Gonzalez, F.J. Xenobiotic metabolomics: Major impact on the metabolome. Annu. Rev. Pharmacol. Toxicol. 2012, 52, 37–56.
- Beisken, S.; Eiden, M.; Salek, R.M. Getting the right answers: Understanding metabolomics challenges. Expert Rev. Mol. Diagn. 2015, 15, 97–109.
- Burnap, R.L. Systems and photosystems: Cellular limits of autotrophic productivity in cyanobacteria. Front. Bioeng. Biotechnol. 2015, 3, 1.
- Ma, S.; Huang, J. Regularized gene selection in cancer microarray meta-analysis. BMC Bioinform. 2009, 10, 1.
- Theodoridis, G.; Gika, H.G.; Wilson, I.D. Mass spectrometry-based holistic analytical approaches for metabolite profiling in systems biology studies. Mass Spectrom. Rev. 2011, 30, 884–906.
- Ho, C.S.; Lam, C.W.; Chan, M.H.; Cheung, R.C.; Law, L.K.; Lit, L.C.; Ng, K.F.; Suen, M.W.; Tai, H.L. Electrospray ionisation mass spectrometry: Principles and clinical applications. Clin. Biochem. Rev. 2003, 24, 3–12.
- Pan, Z.; Raftery, D. Comparing and combining NMR spectroscopy and mass spectrometry in metabolomics. Anal. Bioanal. Chem. 2007, 387, 525–527.
- Veenstra, T.D. Metabolomics: The final frontier? Genome Med. 2012, 4, 40.
- Smith, C.A.; Want, E.J.; O’Maille, G.; Abagyan, R.; Siuzdak, G. XCMS: Processing mass spectrometry data for metabolite profiling using nonlinear peak alignment, matching, and identification. Anal. Chem. 2006, 78, 779–787.
- Clasquin, M.F.; Melamud, E.; Rabinowitz, J.D. LC-MS data processing with MAVEN: A metabolomic analysis and visualization engine. Curr. Protoc. Bioinform. 2012, 37, 14.11.1–14.11.23.
- Pluskal, T.; Castillo, S.; Villar-Briones, A.; Oresic, M. MZmine 2: Modular framework for processing, visualizing, and analyzing mass spectrometry-based molecular profile data. BMC Bioinform. 2010, 11, 395.
- Mattoli, L.; Gianni, M.; Burico, M. Mass Spectrometry Based Metabolomic Analysis as a Tool for Quality Control of Natural Complex Products. Mass Spectrom. Rev. 2022.
- Chong, J.; Soufan, O.; Li, C.; Caraus, I.; Li, S.; Bourque, G.; Wishart, D.S.; Xia, J. MetaboAnalyst 4.0: Towards more transparent and integrative metabolomics analysis. Nucleic Acids Res. 2018, 46, W486–W494.
- Ogata, H.; Goto, S.; Sato, K.; Fujibuchi, W.; Bono, H.; Kanehisa, M. KEGG: Kyoto Encyclopedia of Genes and Genomes. Nucleic Acids Res. 1999, 27, 29–34.
- Tsugawa, H.; Cajka, T.; Kind, T.; Ma, Y.; Higgins, B.; Ikeda, K.; Kanazawa, M.; VanderGheynst, J.; Fiehn, O.; Arita, M. MS-DIAL: Data-independent MS/MS deconvolution for comprehensive metabolome analysis. Nat. Methods 2015, 12, 523–526.
- Tsugawa, H.; Ikeda, K.; Takahashi, M.; Satoh, A.; Mori, Y.; Uchino, H.; Okahashi, N.; Yamada, Y.; Tada, I.; Bonini, P.; et al. A lipidome atlas in MS-DIAL 4. Nat. Biotechnol. 2020, 38, 1159–1163.
- Agrawal, S.; Kumar, S.; Sehgal, R.; George, S.; Gupta, R.; Poddar, S.; Jha, A.; Pathak, S. El-MAVEN: A Fast, Robust, and User-Friendly Mass Spectrometry Data Processing Engine for Metabolomics. Methods Mol. Biol. 2019, 1978, 301–321.
- Koelmel, J.P.; Kroeger, N.M.; Ulmer, C.Z.; Bowden, J.A.; Patterson, R.E.; Cochran, J.A.; Beecher, C.W.W.; Garrett, T.J.; Yost, R.A. LipidMatch: An automated workflow for rule-based lipid identification using untargeted high-resolution tandem mass spectrometry data. BMC Bioinform. 2017, 18, 331.
- Hutchins, P.D.; Russell, J.D.; Coon, J.J. LipiDex: An Integrated Software Package for High-Confidence Lipid Identification. Cell Syst. 2018, 6, 621–625.e625.
- Shen, X.; Zhu, Z.J. MetFlow: An interactive and integrated workflow for metabolomics data cleaning and differential metabolite discovery. Bioinformatics 2019, 35, 2870–2872.
- Xia, J.; Psychogios, N.; Young, N.; Wishart, D.S. MetaboAnalyst: A web server for metabolomic data analysis and interpretation. Nucleic Acids Res. 2009, 37, W652–W660.
- Xia, J.; Mandal, R.; Sinelnikov, I.V.; Broadhurst, D.; Wishart, D.S. MetaboAnalyst 2.0—A comprehensive server for metabolomic data analysis. Nucleic Acids Res. 2012, 40, W127–W133.
- Xia, J.; Sinelnikov, I.V.; Han, B.; Wishart, D.S. MetaboAnalyst 3.0—Making metabolomics more meaningful. Nucleic Acids Res. 2015, 43, W251–W257.
- Pang, Z.; Chong, J.; Zhou, G.; de Lima Morais, D.A.; Chang, L.; Barrette, M.; Gauthier, C.; Jacques, P.E.; Li, S.; Xia, J. MetaboAnalyst 5.0: Narrowing the gap between raw spectra and functional insights. Nucleic Acids Res. 2021, 49, W388–W396.
- Lin, W.J.; Shen, P.C.; Liu, H.C.; Cho, Y.C.; Hsu, M.K.; Lin, I.C.; Chen, F.H.; Yang, J.C.; Ma, W.L.; Cheng, W.C. LipidSig: A web-based tool for lipidomic data analysis. Nucleic Acids Res. 2021, 49, W336–W345.
- Molenaar, M.R.; Jeucken, A.; Wassenaar, T.A.; van de Lest, C.H.A.; Brouwers, J.F.; Helms, J.B. LION/web: A web-based ontology enrichment tool for lipidomic data analysis. Gigascience 2019, 8, giz061.
- Smith, C.A.; O’Maille, G.; Want, E.J.; Qin, C.; Trauger, S.A.; Brandon, T.R.; Custodio, D.E.; Abagyan, R.; Siuzdak, G. METLIN: A metabolite mass spectral database. Ther. Drug Monit. 2005, 27, 747–751.
- Guijas, C.; Montenegro-Burke, J.R.; Domingo-Almenara, X.; Palermo, A.; Warth, B.; Hermann, G.; Koellensperger, G.; Huan, T.; Uritboonthai, W.; Aisporna, A.E.; et al. METLIN: A Technology Platform for Identifying Knowns and Unknowns. Anal. Chem. 2018, 90, 3156–3164.
- Tautenhahn, R.; Cho, K.; Uritboonthai, W.; Zhu, Z.; Patti, G.J.; Siuzdak, G. An accelerated workflow for untargeted metabolomics using the METLIN database. Nat. Biotechnol. 2012, 30, 826–828.
- Hernandez-de-Diego, R.; Tarazona, S.; Martinez-Mira, C.; Balzano-Nogueira, L.; Furio-Tari, P.; Pappas, G.J., Jr.; Conesa, A. PaintOmics 3: A web resource for the pathway analysis and visualization of multi-omics data. Nucleic Acids Res. 2018, 46, W503–W509.
- Kuo, T.C.; Tian, T.F.; Tseng, Y.J. 3Omics: A web-based systems biology tool for analysis, integration and visualization of human transcriptomic, proteomic and metabolomic data. BMC Syst. Biol. 2013, 7, 64.
- Fernandez, J.M.; Hoffmann, R.; Valencia, A. iHOP web services. Nucleic Acids Res. 2007, 35, W21–W26.
- Kamburov, A.; Cavill, R.; Ebbels, T.M.; Herwig, R.; Keun, H.C. Integrated pathway-level analysis of transcriptomics and metabolomics data with IMPaLA. Bioinformatics 2011, 27, 2917–2918.
- Xia, J.; Wishart, D.S. MetPA: A web-based metabolomics tool for pathway analysis and visualization. Bioinformatics 2010, 26, 2342–2344.
- Suhre, K.; Schmitt-Kopplin, P. MassTRIX: Mass translator into pathways. Nucleic Acids Res. 2008, 36, W481–W484.
- Zhou, G.; Xia, J. OmicsNet: A web-based tool for creation and visual analysis of biological networks in 3D space. Nucleic Acids Res. 2018, 46, W514–W522.
- Pedersen, H.K.; Forslund, S.K.; Gudmundsdottir, V.; Petersen, A.O.; Hildebrand, F.; Hyotylainen, T.; Nielsen, T.; Hansen, T.; Bork, P.; Ehrlich, S.D.; et al. A computational framework to integrate high-throughput ‘-omics’ datasets for the identification of potential mechanistic links. Nat. Protoc. 2018, 13, 2781–2800.
More
Information
Subjects:
Biochemistry & Molecular Biology
Contributors
MDPI registered users' name will be linked to their SciProfiles pages. To register with us, please refer to https://encyclopedia.pub/register
:
View Times:
3.3K
Revisions:
2 times
(View History)
Update Date:
25 May 2022
Table of Contents


Notice
You are not a member of the advisory board for this topic. If you want to update advisory board member profile, please contact office@encyclopedia.pub.
OK
Confirm
Only members of the Encyclopedia advisory board for this topic are allowed to note entries. Would you like to become an advisory board member of the Encyclopedia?
Yes
No
${ textCharacter }/${ maxCharacter }
Submit
Cancel
Back
Comments
${ item }
|
${ item.createdUser.fullName }
${ item.createdAt }
${ item.vote }
${ item.reply }
Delete
${ reply.createdUser.fullName }
${ reply.createdAt }
${ reply.vote }
Delete
There is no reply to this comment~
${ item.replyTextCharacter }/${ item.replyMaxCharacter }
Submit
Cancel
More
No more~
There is no comment~
${ textCharacter }/${ maxCharacter }
Submit
Cancel
${ selectedItem.replyTextCharacter }/${ selectedItem.replyMaxCharacter }
Submit
Cancel
Confirm
Are you sure to Delete?
Yes
No