In the next step, the screened metabolites are linked to their biological context by pathway and enrichment analysis. The aim of enrichment analysis is to explore the profile of functionally relevant metabolites to determine the link between changes in metabolite expression and biological context. This allows the use of a list of altered metabolites to suggest biological pathways or disease conditions that would indicate the subsequent steps in the study. The goal of pathway analysis is to identify pathways that have a significant impact on a specific biological process. Enrichment and pathway analyses are performed using specialized software tools
[20][94] that map metabolites to known biochemical pathways based on information in public databases such as KEGG
[21][95]. Subsequently, investigators typically use network visualization tools to present and understand their results.
Multi-omics data integration and analysis pipelines for studying the pathogenesis of disease and the influence of environmental risk factors are scarce. In this last step, an integrated multi-omics platform provides a reliable and understandable overview of metabolic changes
[20][94]. The identified metabolites and metabolic pathways can be integrated with other omics data, which may help us to obtain more comprehensive information about the biological phenomena.
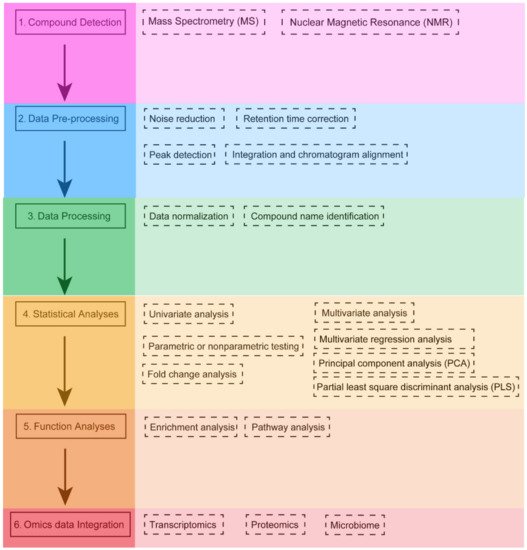
3. Statistical Analysis in Metabolomics
3.1. Univariate Analysis
Univariate analysis usually provides a preliminary overview of data characteristics that may be important in identifying the conditions under study. For two-group data (both unpaired and paired analyses),
scholarswe can perform fold change analysis,
t-tests, and volcano plots. For multi-group data,
scholarswe can perform one-way analysis of variance (ANOVA), as well as related post hoc analysis and correlation analysis.
3.2. Multivariate Analysis
Since multi-omics data usually contain some characteristics that vary with phenotype or experimental conditions, the use of multivariate analyses that allow simultaneous observation and analysis of more than two statistical variables is recommended. Multivariate analysis includes multiple variance analysis (ANOVA), multiple regression analysis, factor analysis, principal component analysis (PCA), partial least squares discriminant analysis (PLS), cluster analysis, and machine learning (e.g., random forest and SVM). Because multivariate analysis uses the weighted averages to summarize the original variables in fewer variables, they are useful for exploratory data analysis. PCA analysis starts from the interrelationship between the original variables, linearly transforms them to several independent composite indicators (i.e., principal components) according to the principle of variance maximization, takes two to three principal components for graphing, visually describes the differences in metabolic patterns and clustering results between different groups, and searches for the original variables that contribute to intergroup classification as biomarkers through loadings plots. PCA is commonly used as a pre-analysis and quality control step for metabolomics data to observe whether there are intergroup classification trends and data outlier points. PCA can also be used to analyze whether quality control samples are clustered together, or if they are scattered or have some variability, which would indicate problems with the quality of the assay.
4. Software Tools for Metabolomics Data Analysis and Integration
4.1. MS-DIAL
MS-DIAL was previously developed as free data pre-processing software for LC-MS data processing, but now the MS-DIAL 4.0 tool can also process LC-MS, GC-MS, and NMR data, in particular to obtain deconvoluted spectra from high-resolution GC-MS data as a prerequisite for compound identification (MS-DIAL 4.0, Hiroshi Tsugawa, Kanagawa, Japan)
[22][23][100,101]. MS-DIAL offers multiple data-acquisition processing and includes the spectra for compound ID. It also includes normalization and statistical analysis options (
http://prime.psc.riken.jp/, accessed on 31 March 2022)
[22][100]. MS-DIAL has an internal GC/MS database, as well as silica retention time and MS/MS database for LC-MS/MS-based lipidomics
[23][101].
4.2. MZmine 3
MZmine 3 (Tomáš Pluskal, Prague, Czech) is an open source software for mass spectrometry data processing that focuses on LC-MS data but can still handle GC-MS and NMR data (
http://mzmine.github.io/, accessed on 13 January 2022). This software includes a complete workflow for LC-MS data analysis, including raw data processing, data filtering and peak identification, isotope detection, statistical analysis, and visualization
[18][87].
4.3. El-MAVEN
El-MAVEN (Shubhra Agrawal, Cambridge, USA) is an open source desktop software for processing LC-MS, GC-MS and NMR data labeled in open formats (mzXML, mzML, CDF)
[24][102]. This software has a graphical and command line interface, integrates with a cloud-based platform for storage, and conducts further analyses, such as relative fluxes and quantification
[24][102]. El-MAVEN features a multi-file chromatography comparator, a peak feature detector, and an isotope calculator. El-MAVEN is more powerful, faster, and more user-friendly than Maven, and includes an additive calculator, fragment spectra matching, and peak editor. The El-MAVEN installer is available for Windows and Mac OS (
www.elucidata.io/el-maven, accessed on 31 March 2022). Users can download the latest versions of these platforms-. Additionally, developers can follow the instructions to build El-MAVEN on Windows, Ubuntu, or Mac OS to set up the development environment (64-bit platforms only).
4.4. LipidMatch
LipidMatch can be used to annotate lipids detected by LC-MS (
http://secim.ufl.edu/secim-tools/lipidmatch/, accessed on 31 March 2022). The LipidMatch fragment library contains over 250,000 lipid species spanning over 50 lipid types
[25][103]. Users can annotate lipids in feature tables generated by its optimized peak picking and filtering strategy. LipidMatch is also used for the annotation of direct infusion and imaging experiments. The software is modular, which makes it suitable for a variety of workflows, and researchers can use it with a variety of peak picking software (e.g., MZmine 3, XCMS (Gary Siuzdak, California, USA), and MS-DIAL 4.0). LipidMatch also provides its lipid libraries in csv format and the R scripts for LipidMatch.
4.5. LipiDex
LipiDex (Joshua J Coon, Madison, WI, USA) is a unified software that can be used for lipid identification by LC-MS/MS. It has the ability to greatly reduce manual processing bias and improve the confidence of identification
[26][104]. When using LipiDex, researchers first create a library of lipid spectra, then use fragment templates to build composite lipid spectra and mass spectrometry fragment models, and subsequently correlate spectral identifications with chromatographic peaks to generate LC-MS/MS lipidomic datasets with high confidence. LipiDex can automatically filter peak lists for additive peaks, endogenous fragments, and dimers (
https://github.com/coongroup/LipiDex, accessed on 31 March 2022).
4.6. MetFlow
MetFlow is a web-based tool developed in 2019 (
http://metflow.zhulab.cn/, accessed on 13 January 2022)
[27][105]. It offers a standardized workflow for metabolomics data processing and is an interactive web server. Researchers can also use it to perform data cleaning and differential analysis. Its functions include: (1) batch alignment, (2) data quality check and visualization, (3) missing value processing and outlier removal, (4) data normalization and integration, (5) statistical analysis, (6) performance validation, and (7) pathway enrichment analysis. The software enables users with little knowledge in programming and statistics to perform metabolomics data analysis. MetFlow is simple to operate. It has excellent graphic visualization ability (
Figure 2a–f) and it can verify the results by uploading test data. However, its disadvantages are that the uploaded file format is fixed, and its pathway enrichment analysis cannot provide the visualization of specific pathways. Therefore,
scholarswe cannot intuitively find the role of metabolites in the pathway.
4.7. MetaboAnalyst 5.0
MetaboAnalyst 5.0 is a comprehensive, freely accessible web-based metabolomics analysis platform (
https://www.metaboanalyst.ca/, accessed on 13 January 2022). It was first developed in 2009
[28][106], then updated in 2012 (MetaboAnalyst 2.0
[29][107]), in 2015 (MetaboAnalyst 3.0
[30][108]), in 2019 (MetaboAnalyst 4.0
[20][94]) and in 2021 (MetaboAnalyst 5.0
[31][109]). It can be locally installed at the same time. MetaboAnalyst provides comprehensive online tools for metabolomics data analysis, statistical analysis, functional annotation, and visualization of data. MetaboAnalyst 5.0 improves its analytical performance and user interactivity. The platform provides four major functional modules that can be classified into 12 categories: (1) statistical analysis (statistics, biomarker analysis, multifactor/time series analysis, power analysis); (2) functional analysis (metabolome enrichment analysis, metabolic pathway analysis, mass spectrometry peak prediction of pathway activity); (3) data integration and systems biology (biomarker meta-analysis, joint-pathway analysis, and network explorer) and (4) data processing and utility functions (compound ID conversion, batch effect correction, lipidomics, and links to several spectra analysis tools). The advantages of MetaboAnalyst 5.0 are that it supports several formats of uploaded data, and the statistical methods are more selective
(Figure 2g–i). The wide variety of pathway analysis methods can also meet most needs
(Figure 2j–l). MetaboAnalyst 5.0 has a corresponding R package, which greatly improves the autonomy of metabolomics analysis. In addition, multiple databases are linked for multi-omics analysis. Nevertheless, MetaboAnalyst 5.0 did not have the analysis module for integration of the metabolome and microbiome, which is a disadvantage of most metabolomics analysis software.
4.8. LipidSig
LipidSig is a web-based platform for the comprehensive analysis of lipidomic data
[32][110]. It contains five main functions: (1) profiling (for pre-processing data), (2) differential expression, (3) machine learning, (4) correlation analysis, and (5) network. LipidSig can also create interactive plots and generate downloadable images and corresponding tables (
http://chenglab.cmu.edu.tw/lipidsig/, accessed on 31 March 2022).
4.9. LION
LION/web enables statistical analysis of lipids. Additionally, the most powerful feature of the software is the integration of more than 50,000 lipids with biophysical, biochemical and cell biological features, allowing a comprehensive enrichment of lipids
[33][111]. Additionally, the
scholarauthors developed a web-based interface based on LION for easy operation by researchers (
www.lipidontology.com, accessed on 31 March 2022).
4.10. METLIN
The METLIN tandem mass spectrometry (MS/MS) database was created in 2003 and made publicly available in 2005
[34][112] to help identify metabolites. At that time, no such database existed for identifying metabolites. In 2018, to improve the coverage of metabolites and help annotate them, in silico MS/MS spectra were generated on additional molecules in METLIN. These data were based on machine learning algorithms, the METLIN database, and the unique fragmentation information (provided by stable isotopes)
[35][90]. METLIN is a free cloud-based platform and metabolite database. It has since grown from a small collection of MS/MS spectra on 100 metabolites in its first iteration to more than 10,000 metabolites in 2012
[36][113], with an additional 12,000 metabolites and compounds having been analyzed in the last 5 years.
4.11. PaintOmics 3
PaintOmics 3 is a web-based resource for the integrated visualization of multi-omics data types on KEGG pathway diagrams (
www.paintomics.org, accessed on 13 January 2022)
[37][114]. PaintOmics 3 combines data analysis with data visualization, providing researchers with an efficient framework for their multi-omics data. Unlike other visualization tools, PaintOmics 3 covers a comprehensive pathway analysis workflow
(Figure 3a,b), including automatic feature name conversion, multi-layered feature matching, pathway enrichment, network analysis, heatmaps, trend charts, and more. It accepts a wide variety of omics types, including transcriptomics, proteomics, and metabolomics, as well as region-based approaches such as ATAC-seq or ChIP-seq data. However, the input data need to be pre-processed.
4.12. 3Omics
3Omics is a web-based tool that was developed in 2013 (
http://3omics.cmdm.tw, accessed on 13 January 2022). It is used to analyze, integrate, and visualize transcriptome, proteome, and metabolome human data
[38][115]. 3Omics supports correlation analysis, phenotype mapping, pathway enrichment analysis, and co-expression analysis
(Figure 3c). In fact, depending on the input data, the software offers four parts of integrated analyses: (1) transcriptomics, proteomics, and metabolomics (T-P-M), (2) transcriptomics and proteomics (T-P), (3) proteomics and metabolomics (P-M) and (4) transcriptomics and metabolomics (T-M). A single omics analysis mode is also available in the tool. 3Omics can also carry out text mining of the biomedical literature through information Hyperlinked Over Protein (iHOP
[39][116]) to supplement missing information. The drawback is that pathway enrichment analysis cannot provide the visualization of specific pathways.
4.13. IMPaLa
IMPaLA is a web tool for transcriptomics, proteomics, and metabolomics pathway analysis (
http://impala.molgen.mpg.de, accessed on 13 January 2022)
[40][117]. It was developed in 2011. The web tool uses over 3000 pre-annotated approaches from 11 databases to perform over-expression or enrichment analysis on uploaded metabolites and gene lists. Therefore, it is possible to identify pathways that may be regulated at the transcriptional level, metabolic level, or both. The output results of the tool include a ranked list of pathways, the size of each pathway and the
p-value and
q-values from the joint analysis of genes and metabolites. By clicking on the pathway name, users will be guided to a summary web page at the source database. Results can also be downloaded as a tab-delimited file.
4.14. MetPA
MetPA is a user friendly, web-based tool for the analysis and visualization of metabolomics data (
http://metpa.metabolomics.ca, accessed on 13 January 2022)
[41][118]. It combines pathway enrichment analysis programs and pathway topology feature analysis to help identify the most relevant metabolic pathways
(Figure 3d). The results are displayed in an interactive network visualization system that can be selected, dragged, and zoomed in and out. In addition, this tool offers a comprehensive compound library for metabolite name conversion, and it can also implement various univariate analyses. MetPA currently supports the analysis and visualization of 874 metabolic pathways in 11 common model organisms and it has been integrated into the MetaboAnalyst 5.0 platform.
4.15. MassTRIX
MassTRIX is a web-based software for metabolomics pathway enrichment analysis
[42][119]. The input data of this tool require a mass peak list from high-precision MS experiments. MassTRIX marks the identified chemical compounds as differentially colored objects on the KEGG pathway maps
(Figure 3e). Therefore, users can interpret the metabolic state of the organism based on the original organism and the true enzymatic capabilities in the case of submitted transcriptomics data. The tools’ output page summarizes the number of identified metabolites on all available pathways and gives a list of all metabolites that are annotated on any given pathway of the organism. Here, users should note that in some cases multiple alternative annotations may be found. The MassTRIX web server is freely accessible at
http://masstrix.org (accessed on 13 January 2022).
4.16. MetaCore™
MetaCore™ (
http://thomsonreuters.com/metacore/, accessed on 13 January 2022) is a commercial tool used as a web-based application. The software can analyze different kinds of high-throughput molecular data. MetaCore™ is also a high-quality database of mammalian biology, with collections including metabolites and other molecular classes, bioactive molecules and their interactions, signal transduction and metabolic pathways. It also enables genomic analysis, identifies potentially important variants, and provides data visualization, analysis, and data mining. Unfortunately, no detailed information is available on how MetaCore™ works.
Therefore, our review of this tool is limited.
4.17. OmicsNet
OmicsNet (
www.omicsnet.ca, accessed on 31 March 2022) can integrate different omics data based on molecular interaction knowledge and visualization using network analysis. It also can annotate SNPs, microbial taxa, or LC-MS peaks for network analysis
[43][120]. The network analysis can contain genes, proteins, transcription factors (TF), miRNAs and metabolites, and the creation of different types of biological networks is derived from multiple molecular interaction databases (PPI, TF-gene, miRNA-gene, and metabolic protein interactions).
5. The Integration Algorithm of Multi-Omics Data
The development of an efficient and practical multi-omics algorithm is important to interpret the results of metabolomics.
In 2018, Pedersen et al.
[44][122] proposed a calculation protocol, detailing and discussing dimensionality reduction technology and the subsequent method of integrating and interpreting multi-omics data. Dimensionality reduction of the different omics data was achieved through data normalization, the combination of co-abundant genes and metabolites, and the integration of existing biological knowledge. Using prior knowledge to overcome the functional redundancy among microbiome species is a major advancement of the method compared with existing alternative methods. Researchers can integrate multi-omics data with host physiology variables or any other phenotypes of interest to perform a three-pronged analysis to identify potential mechanistic connections through this framework and then test it through experimentation. Although it is a framework for a human metabolome-microbiome study, it is generalizable to other organisms and environmental metagenomes, and it could also be used for studies including other omics data (e.g., transcriptomics and proteomics). The R code of the protocol is available at
https://bitbucket.org/hellekp/clinical-micro-meta-integration (accessed on 13 January 2022).