 +1 credit
| Version | Summary | Created by | Modification | Content Size | Created at | Operation |
|---|---|---|---|---|---|---|
| 1 | Ahmet Kaynak | -- | 2607 | 2022-05-24 14:44:01 | | | |
| 2 | Vivi Li | Meta information modification | 2607 | 2022-05-25 04:20:33 | | |
Video Upload Options
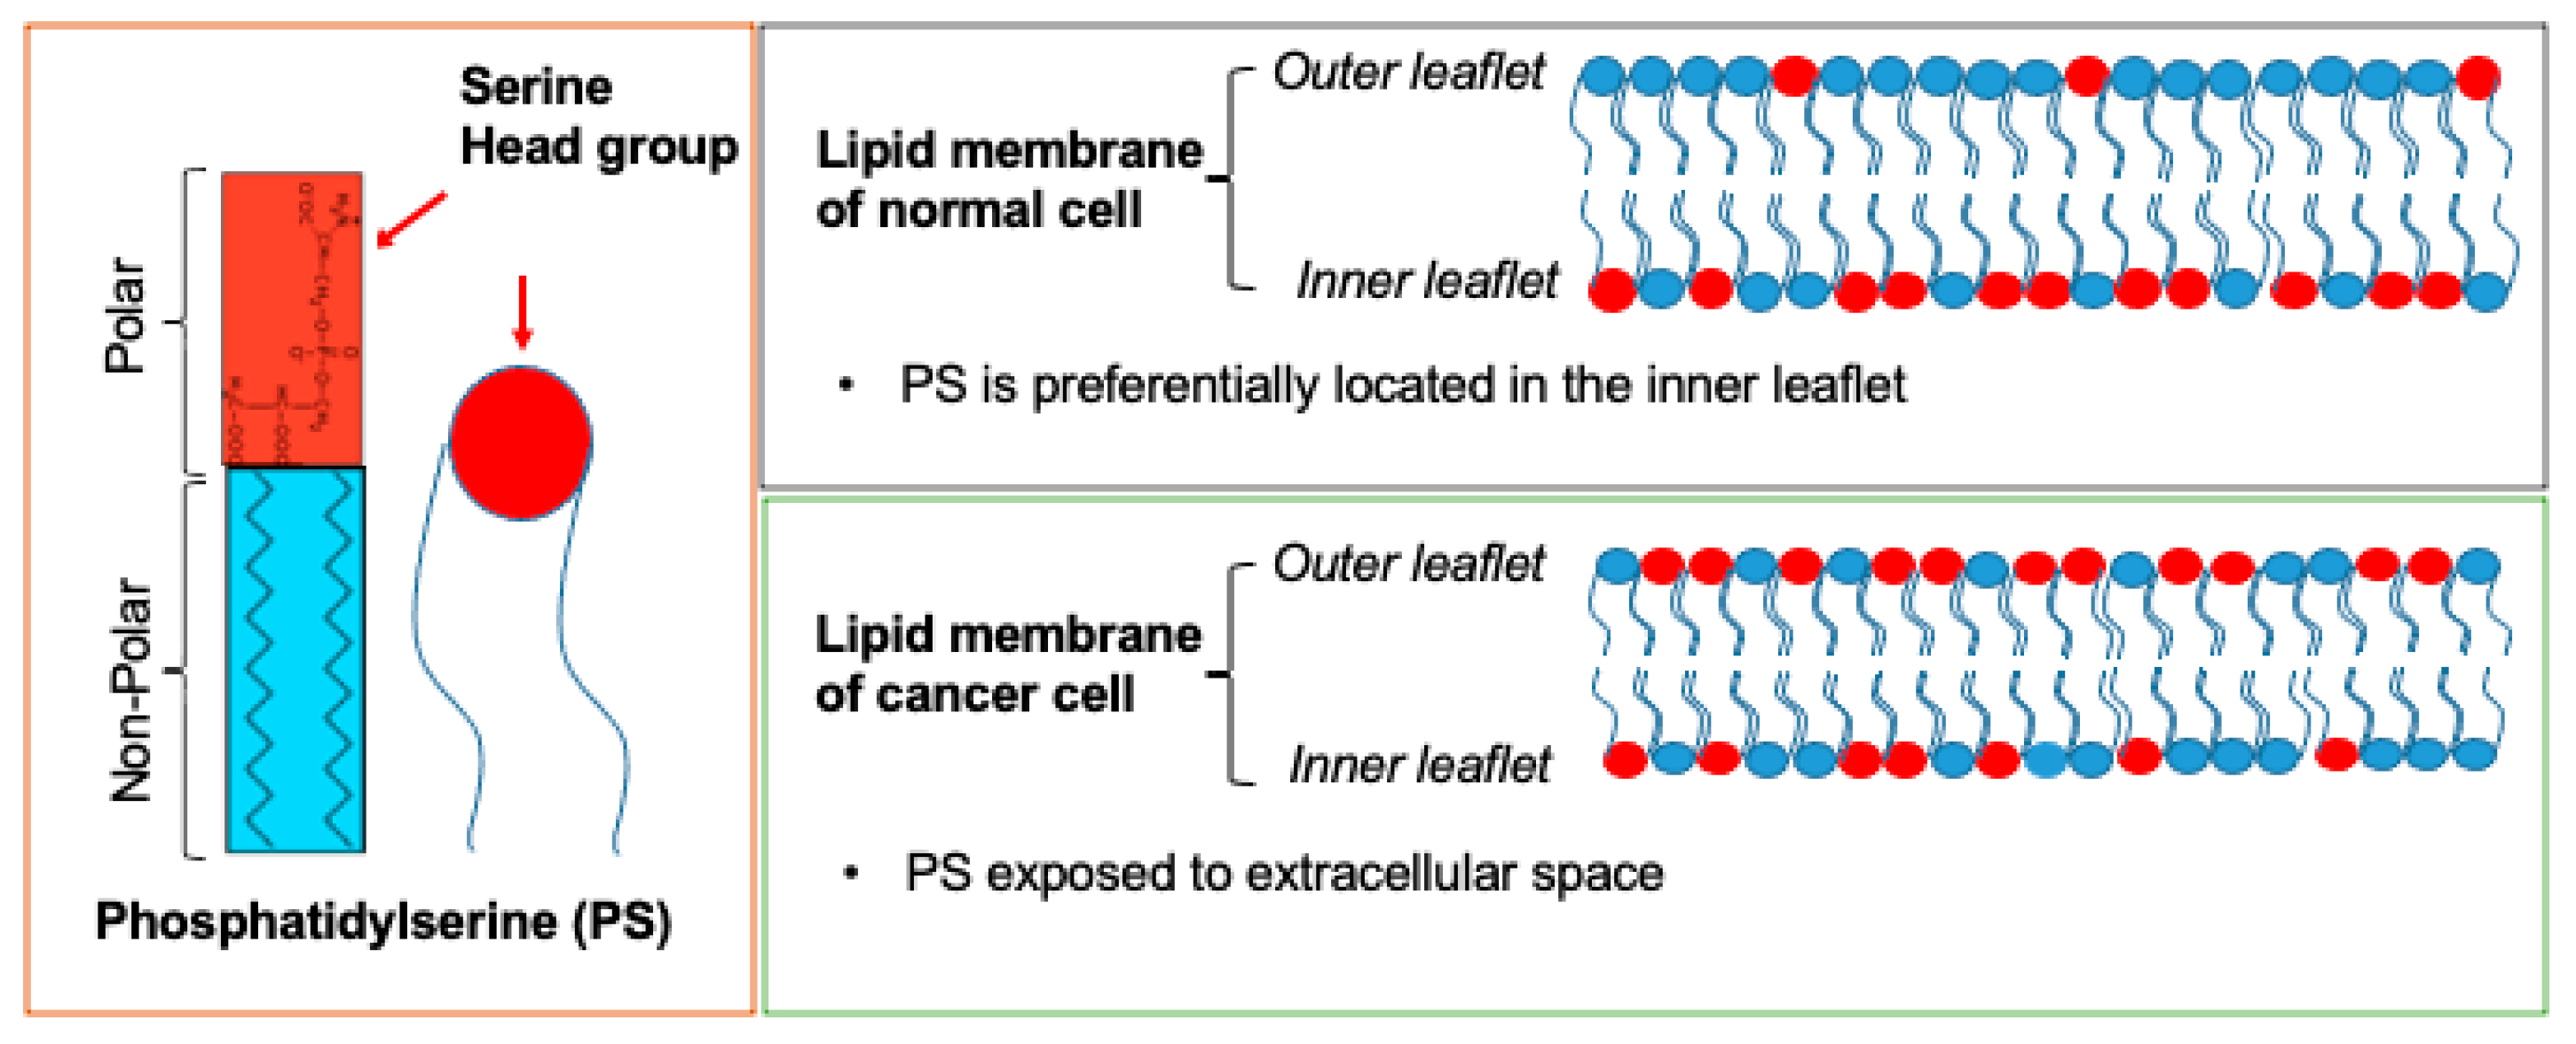
Cancer is among the leading causes of death worldwide. In recent years, many cancer-associated biomarkers have been identified that are used for cancer diagnosis, prognosis, screening, and early detection, as well as for predicting and monitoring carcinogenesis and therapeutic effectiveness. Phosphatidylserine (PS) is a negatively charged phospholipid which is predominantly located in the inner leaflet of the cell membrane. In many cancer cells, PS externalizes to the outer cell membrane, a process regulated by calcium-dependent flippases and scramblases. Saposin C coupled with dioleoylphosphatidylserine (SapC-DOPS) nanovesicle (BXQ-350) and bavituximab, (Tarvacin, human–mouse chimeric monoclonal antibodies) are cell surface PS-targeting drugs being tested in clinical trial for treating a variety of cancers. Additionally, a number of other PS-selective agents have been used to trigger cytotoxicity in tumor-associated endothelial cells or cancer cells in pre-clinical studies.
1. Introduction: Biomarkers in Cancer Imaging and Therapy
2. PS: Cellular Distribution and Roles
3. PS as a Cancer Biomarker
3.1. Heterogeneity in Surface PS Exposure on Membranes May Indicate a Susceptibility of Cancer Cells to Cancer Treatments at Different Stages
| PS-Targeting Imaging | ||||
|---|---|---|---|---|
| Type of Imaging Modality | PS-Targeting Antibody + Imaging Compound | Results | Cancer Type(s) | Refs. |
| Optical Imaging | Annexin V-Cy | A 2- to 3-fold stronger near-infrared fluorescent signal was observed in tumors of mice once treated with pro-apoptotic drug, cyclophosphamide. | Gliosarcoma | [34] |
| Optical Imaging | PGN635+ 800CW | Successfully imaged the tumor 4 h post-IV injection of PGN635-800 CW. Highest signal observed at 24 h. |
Glioblastoma | [35] |
| Positron Emission Tomography (PET) | PGN635 + 89Zr | High accumulation 89Zr-PGN635 in treated tumors undergoing apoptosis. Tumor-to-blood ratios of up to 13. |
Human colorectal cancer Breast cancer |
[32] |
| PET | 74As-labeled bavituximab | Tumor–liver ratio was 22 for bavituximab compared with 1.5 for an isotype matched control chimeric antibody 72 h after injection. | Prostate cancer | [36] |
| Magnetic resonance imaging (MRI) (9.4T) | PGN635 + Superparamagnetic iron oxide nanoparticles (SPIO) | T2-weighted MRI detected a drastic reduction in signal intensity and T2 values of tumors at 24 h. | Breast cancer | [33] |
3.2. SapC-DOPS Nanovesicles Can Target Cancer Surface PS
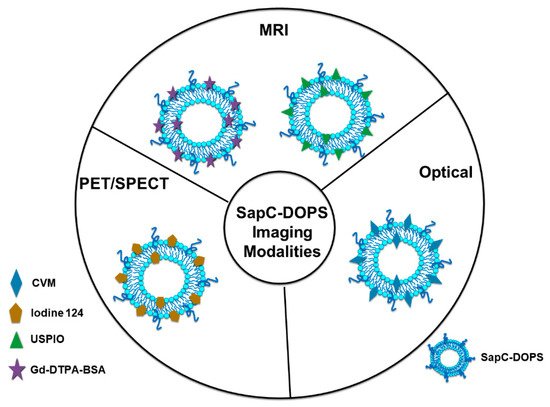
3.2.1. Optical Cancer Imaging Using PS-Targeting SapC-DOPS Nanovesicles
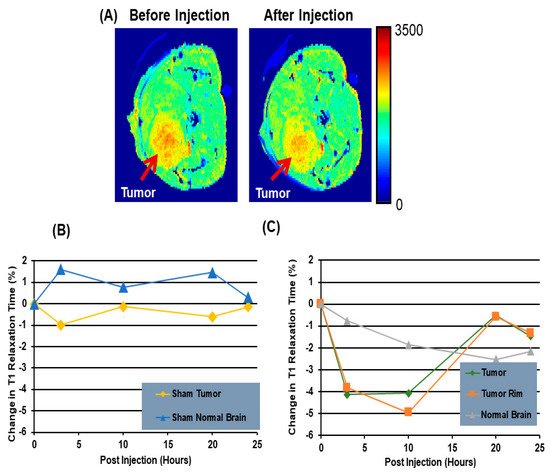
3.2.2. Magnetic Resonance Imaging (MRI) Using PS-Targeting SapC-DOPS Nanovesicles
3.2.3. Positron Emission Tomography/Single Photon Emission Computed Tomography (PET/SPECT) Imaging Using PS-Targeting SapC-DOPS Nanovesicles
References
- Bray, F.; Ferlay, J.; Soerjomataram, I.; Siegel, R.L.; Torre, L.A.; Jemal, A. Global cancer statistics 2018: GLOBOCAN estimates of incidence and mortality worldwide for 36 cancers in 185 countries. CA Cancer J. Clin. 2018, 68, 394–424.
- Siegel, R.L.; Miller, K.D.; Jemal, A. Cancer statistics, 2020. CA Cancer J. Clin. 2020, 70, 7–30.
- Sugie, T. Immunotherapy for metastatic breast cancer. Chin. Clin. Oncol. 2018, 7, 28.
- Steven, A.; Fisher, S.A.; Robinson, B.W. Immunotherapy for lung cancer. Respirology 2016, 21, 821–833.
- Ayodele, O.; Razak, A.R.A. Immunotherapy in soft-tissue sarcoma. Curr. Oncol. 2020, 27, 17–23.
- Merz, J.; Bossart, M.; Bamberg, F.; Eisenblaetter, M. Revised FIGO Staging for Cervical Cancer-A New Role for MRI. RoFo Fortschr. Auf Dem Geb. Der Rontgenstrahlen Und Der Nukl. 2020, 192, 937–944.
- Jadvar, H.; Ballas, L.K.; Choyke, P.L.; Fanti, S.; Gulley, J.L.; Herrmann, K.; Hope, T.A.; Klitzke, A.K.; Oldan, J.D.; Pomper, M.G.; et al. Appropriate Use Criteria for Imaging Evaluation of Biochemical Recurrence of Prostate Cancer After Definitive Primary Treatment. J. Nucl. Med. Off. Publ. Soc. Nucl. Med. 2020, 61, 552–562.
- Kalimuthu, S.; Jeong, J.H.; Oh, J.M.; Ahn, B.C. Drug Discovery by Molecular Imaging and Monitoring Therapy Response in Lymphoma. Int. J. Mol. Sci. 2017, 18, 1639.
- Available online: https://www.cancer.gov/search/results?swKeyword=biomarker (accessed on 19 May 2022).
- Liu, D. Cancer biomarkers for targeted therapy. Biomark. Res. 2019, 7, 25.
- Ludwig, J.A.; Weinstein, J.N. Biomarkers in Cancer Staging, Prognosis and Treatment Selection. Nat. Rev. Cancer 2005, 5, 845–856.
- Grivas, P.D.; Melas, M.; Papavassiliou, A.G. The biological complexity of urothelial carcinoma: Insights into carcinogenesis, targets and biomarkers of response to therapeutic approaches. Semin. Cancer Biol. 2015, 35, 125–132.
- Taylor, D.D.; Gercel-Taylor, C. MicroRNA signatures of tumor-derived exosomes as diagnostic biomarkers of ovarian cancer. Gynecol. Oncol. 2008, 110, 13–21.
- Mar-Aguilar, F.; Mendoza-Ramirez, J.A.; Malagon-Santiago, I.; Espino-Silva, P.K.; Santuario-Facio, S.K.; Ruiz-Flores, P.; Rodriguez-Padilla, C.; Resendez-Perez, D. Serum circulating microRNA profiling for identification of potential breast cancer biomarkers. Dis. Markers 2013, 34, 163–169.
- Ibanez de Caceres, I.; Battagli, C.; Esteller, M.; Herman, J.G.; Dulaimi, E.; Edelson, M.I.; Bergman, C.; Ehya, H.; Eisenberg, B.L.; Cairns, P. Tumor cell-specific BRCA1 and RASSF1A hypermethylation in serum, plasma, and peritoneal fluid from ovarian cancer patients. Cancer Res. 2004, 64, 6476–6481.
- Feng, M.; Chen, J.Y.; Weissman-Tsukamoto, R.; Volkmer, J.-P.; Ho, P.Y.; McKenna, K.M.; Cheshier, S.; Zhang, M.; Guo, N.; Gip, P.; et al. Macrophages eat cancer cells using their own calreticulin as a guide: Roles of TLR and Btk. Proc. Natl. Acad. Sci. USA 2015, 112, 2145–2150.
- Manel Esteller, M.T.; Sanchez-Cespedes, M.; Capella, G.; Peinado, M.A.; Watkins, D.N.; Issa, J.-P.J.; Sidransky, D.; Baylin, S.B.; Herman, J.G. Inactivation of the DNA Repair Gene O6-Methylguanine-DNA Methyltransferase by Promoter Hypermethylation Is Associated with G to A Mutations in K-ras in Colorectal Tumorigenesis. Cancer Res. 2000, 60, 2368–2371.
- Vallabhapurapu, S.D.; Blanco, V.M.; Sulaiman, M.K.; Vallabhapurapu, S.L.; Chu, Z.; Franco, R.S.; Qi, X. Variation in human cancer cell external phosphatidylserine is regulated by flippase activity and intracellular calcium. Oncotarget 2015, 6, 34375–34388.
- Blanco, V.M.; Latif, T.; Chu, Z.; Qi, X. Imaging and Therapy of Pancreatic Cancer with Phosphatidylserine-Targeted Nanovesicles. Transl. Oncol. 2015, 8, 196–203.
- Kidd, P.M. Alzheimer’s disease, amnestic mild cognitive impairment, and age-associated memory impairment: Current understanding and progress toward integrative prevention. Altern. Med. Rev. A J. Clin. Ther. 2008, 13, 85–115.
- Hernández-Alvarez, M.I.; Sebastián, D.; Vives, S.; Ivanova, S.; Bartoccioni, P.; Kakimoto, P.; Plana, N.; Veiga, S.R.; Hernández, V.; Vasconcelos, N.; et al. Deficient Endoplasmic Reticulum-Mitochondrial Phosphatidylserine Transfer Causes Liver Disease. Cell 2019, 177, 881–895.e17.
- Kim, H.-Y.; Huang, B.X.; Spector, A.A. Phosphatidylserine in the brain: Metabolism and function. Prog. Lipid Res. 2014, 56, 1–18.
- Nagata, S.; Sakuragi, T.; Segawa, K. Flippase and scramblase for phosphatidylserine exposure. Curr. Opin. Immunol. 2020, 62, 31–38.
- Birge, R.B.; Boeltz, S.; Kumar, S.; Carlson, J.; Wanderley, J.; Calianese, D.; Barcinski, M.; Brekken, R.A.; Huang, X.; Hutchins, J.T.; et al. Phosphatidylserine is a global immunosuppressive signal in efferocytosis, infectious disease, and cancer. Cell Death Differ. 2016, 23, 962–978.
- Dayoub, A.S.; Brekken, R.A. TIMs, TAMs, and PS- antibody targeting: Implications for cancer immunotherapy. Cell Commun. Signal. 2020, 18, 29.
- Calianese, D.C.; Birge, R.B. Biology of phosphatidylserine (PS): Basic physiology and implications in immunology, infectious disease, and cancer. Cell Commun. Signal. 2020, 18, 41.
- N’Guessan, K.F.; Patel, P.H.; Qi, X. SapC-DOPS–a Phosphatidylserine-targeted Nanovesicle for selective Cancer therapy. Cell Commun. Signal. 2020, 18, 6.
- N’Guessan, K.F.; Davis, H.W.; Chu, Z.; Vallabhapurapu, S.D.; Lewis, C.S.; Franco, R.S.; Olowokure, O.; Ahmad, S.A.; Yeh, J.J.; Bogdanov, V.Y.; et al. Enhanced Efficacy of Combination of Gemcitabine and Phosphatidylserine-Targeted Nanovesicles against Pancreatic Cancer. Mol. Ther. 2020, 28, 1876–1886.
- Davis, H.W.; Vallabhapurapu, S.D.; Chu, Z.; Vallabhapurapu, S.L.; Franco, R.S.; Mierzwa, M.; Kassing, W.; Barrett, W.L.; Qi, X. Enhanced phosphatidylserine-selective cancer therapy with irradiation and SapC-DOPS nanovesicles. Oncotarget 2019, 10, 856–868.
- Davis, H.W.; Kaynak, A.; Vallabhapurapu, S.D.; Qi, X. Targeting of elevated cell surface phosphatidylserine with saposin C-dioleoylphosphatidylserine nanodrug as individual or combination therapy for pancreatic cancer. World J. Gastrointest. Oncol. 2021, 13, 550–559.
- Riedl, S.; Rinner, B.; Asslaber, M.; Schaider, H.; Walzer, S.; Novak, A.; Lohner, K.; Zweytick, D. In search of a novel target-phosphatidylserine exposed by non-apoptotic tumor cells and metastases of malignancies with poor treatment efficacy. Biochim. Et Biophys. Acta 2011, 1808, 2638–2645.
- Ogasawara, A.; Tinianow, J.N.; Vanderbilt, A.N.; Gill, H.S.; Yee, S.; Flores, J.E.; Williams, S.P.; Ashkenazi, A.; Marik, J. ImmunoPET imaging of phosphatidylserine in pro-apoptotic therapy treated tumor models. Nucl. Med. Biol. 2013, 40, 15–22.
- Zhang, L.; Zhou, H.; Belzile, O.; Thorpe, P.; Zhao, D. Phosphatidylserine-targeted bimodal liposomal nanoparticles for in vivo imaging of breast cancer in mice. J. Control. Release 2014, 183, 114–123.
- Petrovsky, A.; Schellenberger, E.; Josephson, L.; Weissleder, R.; Bogdanov, A.J. Near-infrared fluorescent imaging of tumor apoptosis. Cancer Res. 2003, 63, 1936–1942.
- Zhao, D.; Stafford, J.H.; Zhou, H.; Thorpe, P.E. Near-infrared Optical Imaging of Exposed Phosphatidylserine in a Mouse Glioma Model. Transl. Oncol. 2011, 4, 355–364.
- Jennewein, M.; Lewis, M.A.; Zhao, D.; Tsyganov, E.; Slavine, N.; He, J.; Watkins, L.; Kodibagkar, V.D.; O’Kelly, S.; Kulkarni, P.; et al. Vascular imaging of solid tumors in rats with a radioactive arsenic-labeled antibody that binds exposed phosphatidylserine. Clin. Cancer Res. 2008, 14, 1377–1385.
- Ungethüm, L.; Chatrou, M.; Kusters, D.; Schurgers, L.; Reutelingsperger, C.P. Molecular Imaging of Cell Death in Tumors. Increasing Annexin A5 Size Reduces Contribution of Phosphatidylserine-Targeting Function to Tumor Uptake. PLoS ONE 2014, 9, e96749.
- Belhocine, T.Z.; Blankenberg, F.G.; Kartachova, M.S.; Stitt, L.W.; Vanderheyden, J.-L.; Hoebers, F.J.P.; Van de Wiele, C. 99mTc-Annexin A5 quantification of apoptotic tumor response: A systematic review and meta-analysis of clinical imaging trials. Eur. J. Nucl. Med. Mol. Imaging 2015, 42, 2083–2097.
- Loose, D.; Vermeersch, H.; De Vos, F.; Deron, P.; Slegers, G.; Van de Wiele, C. Prognostic value of 99mTc-HYNIC annexin-V imaging in squamous cell carcinoma of the head and neck. Eur. J. Nucl. Med. Mol. Imaging 2008, 35, 47–52.
- Haeckel, A.; Ascher, L.; Beindorff, N.; Prasad, S.; Garczyńska, K.; Guo, J.; Schellenberger, E. Long-circulating XTEN864-annexin A5 fusion protein for phosphatidylserine-related therapeutic applications. Apoptosis 2021, 26, 534–547.
- Gong, J.; Archer, R.; Brown, M.; Fisher, S.; Chang, C.; Peacock, M.; Hughes, C.; Freimark, B. Measuring response to therapy by near-infrared imaging of tumors using a phosphatidylserine-targeting antibody fragment. Mol. Imaging 2013, 12, 244–256.
- Qi, X.; Chu, Z.; Mahller, Y.Y.; Stringer, K.F.; Witte, D.P.; Cripe, T.P. Cancer-selective targeting and cytotoxicity by liposomal-coupled lysosomal saposin C protein. Clin. Cancer Res. 2009, 15, 5840–5851.
- Qi, X.; Leonova, T.; Grabowski, G.A. Functional human saposins expressed in Escherichia coli. Evidence for binding and activation properties of saposins C with acid beta-glucosidase. J. Biol. Chem. 1994, 269, 16746–16753.
- Qi, X.; Grabowski, G.A. Differential membrane interactions of saposins A and C: Implications for the functional specificity. J. Biol. Chem. 2001, 276, 27010–27017.
- Wang, Y.; Grabowski, G.A.; Qi, X. Phospholipid vesicle fusion induced by saposin C. Arch. Biochem. Biophys. 2003, 415, 43–53.
- Qi, X.; Chu, Z. Fusogenic domain and lysines in saposin C. Arch. Biochem. Biophys. 2004, 424, 210–218.
- Liu, A.; Wenzel, N.; Qi, X. Role of lysine residues in membrane anchoring of saposin C. Arch. Biochem. Biophys. 2005, 443, 101–112.
- Davis, H.W.; Hussain, N.; Qi, X. Detection of cancer cells using SapC-DOPS nanovesicles. Mol. Cancer 2016, 15, 33.
- Liu, A.; Qi, X. Molecular Dynamics Simulation of Saposin C-Membrane Binding. Open Struct. Biol. J. 2008, 2, 21–30.
- Abu-Baker, S.; Qi, X.; Newstadt, J.; Lorigan, G.A. Structural changes in a binary mixed phospholipid bilayer of DOPG and DOPS upon saposin C interaction at acidic pH utilizing 31P and 2H solid-state NMR spectroscopy. Biochim. Et Biophys. Acta 2005, 1717, 58–66.
- Kato, Y.; Ozawa, S.; Miyamoto, C.; Maehata, Y.; Suzuki, A.; Maeda, T.; Baba, Y. Acidic extracellular microenvironment and cancer. Cancer Cell Int. 2013, 13, 89.
- Wojton, J.; Chu, Z.; Mathsyaraja, H.; Meisen, W.H.; Denton, N.; Kwon, C.H.; Chow, L.M.; Palascak, M.; Franco, R.; Bourdeau, T.; et al. Systemic delivery of SapC-DOPS has antiangiogenic and antitumor effects against glioblastoma. Mol. Ther. J. Am. Soc. Gene Ther. 2013, 21, 1517–1525.
- Chu, Z.; Abu-Baker, S.; Palascak, M.B.; Ahmad, S.A.; Franco, R.S.; Qi, X. Targeting and cytotoxicity of SapC-DOPS nanovesicles in pancreatic cancer. PLoS ONE 2013, 8, e75507.
- Blanco, V.M.; Chu, Z.; Vallabhapurapu, S.D.; Sulaiman, M.K.; Kendler, A.; Rixe, O.; Warnick, R.E.; Franco, R.S.; Qi, X. Phosphatidylserine-selective targeting and anticancer effects of SapC-DOPS nanovesicles on brain tumors. Oncotarget 2014, 5, 7105–7118.
- Unruh, D.; Ünlü, B.; Lewis, C.S.; Qi, X.; Chu, Z.; Sturm, R.; Keil, R.; Ahmad, S.A.; Sovershaev, T.; Adam, M.; et al. Antibody-based targeting of alternatively spliced tissue factor: A new approach to impede the primary growth and spread of pancreatic ductal adenocarcinoma. Oncotarget 2016, 7, 25264–25275.
- Blanco, V.M.; Chu, Z.; LaSance, K.; Gray, B.D.; Pak, K.Y.; Rider, T.; Greis, K.D.; Qi, X. Optical and nuclear imaging of glioblastoma with phosphatidylserine-targeted nanovesicles. Oncotarget 2016, 7, 32866–32875.
- Unruh, D.; Turner, K.; Srinivasan, R.; Kocatürk, B.; Qi, X.; Chu, Z.; Aronow, B.J.; Plas, D.R.; Gallo, C.A.; Kalthoff, H.; et al. Alternatively spliced tissue factor contributes to tumor spread and activation of coagulation in pancreatic ductal adenocarcinoma. Int. J. Cancer 2014, 134, 9–20.
- Winter, P.M.; Pearce, J.; Chu, Z.; McPherson, C.M.; Takigiku, R.; Lee, J.H.; Qi, X. Imaging of brain tumors with paramagnetic vesicles targeted to phosphatidylserine. J. Magn. Reson. Imaging 2015, 41, 1079–1087.
- Kaimal, V.; Chu, Z.; Mahller, Y.Y.; Papahadjopoulos-Sternberg, B.; Cripe, T.P.; Holland, S.K.; Qi, X. Saposin C coupled lipid nanovesicles enable cancer-selective optical and magnetic resonance imaging. Mol. Imaging Biol. 2011, 13, 886–897.
- Blanco, V.M.; Curry, R.; Qi, X. SapC-DOPS nanovesicles: A novel targeted agent for the imaging and treatment of glioblastoma. Oncoscience 2015, 2, 102–110.
- Filonov, G.S.; Piatkevich, K.D.; Ting, L.M.; Zhang, J.; Kim, K.; Verkhusha, V.V. Bright and stable near-infrared fluorescent protein for in vivo imaging. Nat. Biotechnol. 2011, 29, 757–761.
- Urano, Y.; Asanuma, D.; Hama, Y.; Koyama, Y.; Barrett, T.; Kamiya, M.; Nagano, T.; Watanabe, T.; Hasegawa, A.; Choyke, P.L.; et al. Selective molecular imaging of viable cancer cells with pH-activatable fluorescence probes. Nat. Med. 2009, 15, 104–109.
- Thurber, G.M.; Yang, K.S.; Reiner, T.; Kohler, R.H.; Sorger, P.; Mitchison, T.; Weissleder, R. Single-cell and subcellular pharmacokinetic imaging allows insight into drug action in vivo. Nat. Commun. 2013, 4, 1504.
- Chu, Z.; LaSance, K.; Blanco, V.; Kwon, C.H.; Kaur, B.; Frederick, M.; Thornton, S.; Lemen, L.; Qi, X. In vivo optical imaging of brain tumors and arthritis using fluorescent SapC-DOPS nanovesicles. J. Vis. Exp. 2014, 87, e51187.
- Wang, L.; Habib, A.A.; Mintz, A.; Li, K.C.; Zhao, D. Phosphatidylserine-Targeted Nanotheranostics for Brain Tumor Imaging and Therapeutic Potential. Mol. Imaging 2017, 16, 1536012117708722.

