 +1 credit
Video Upload Options
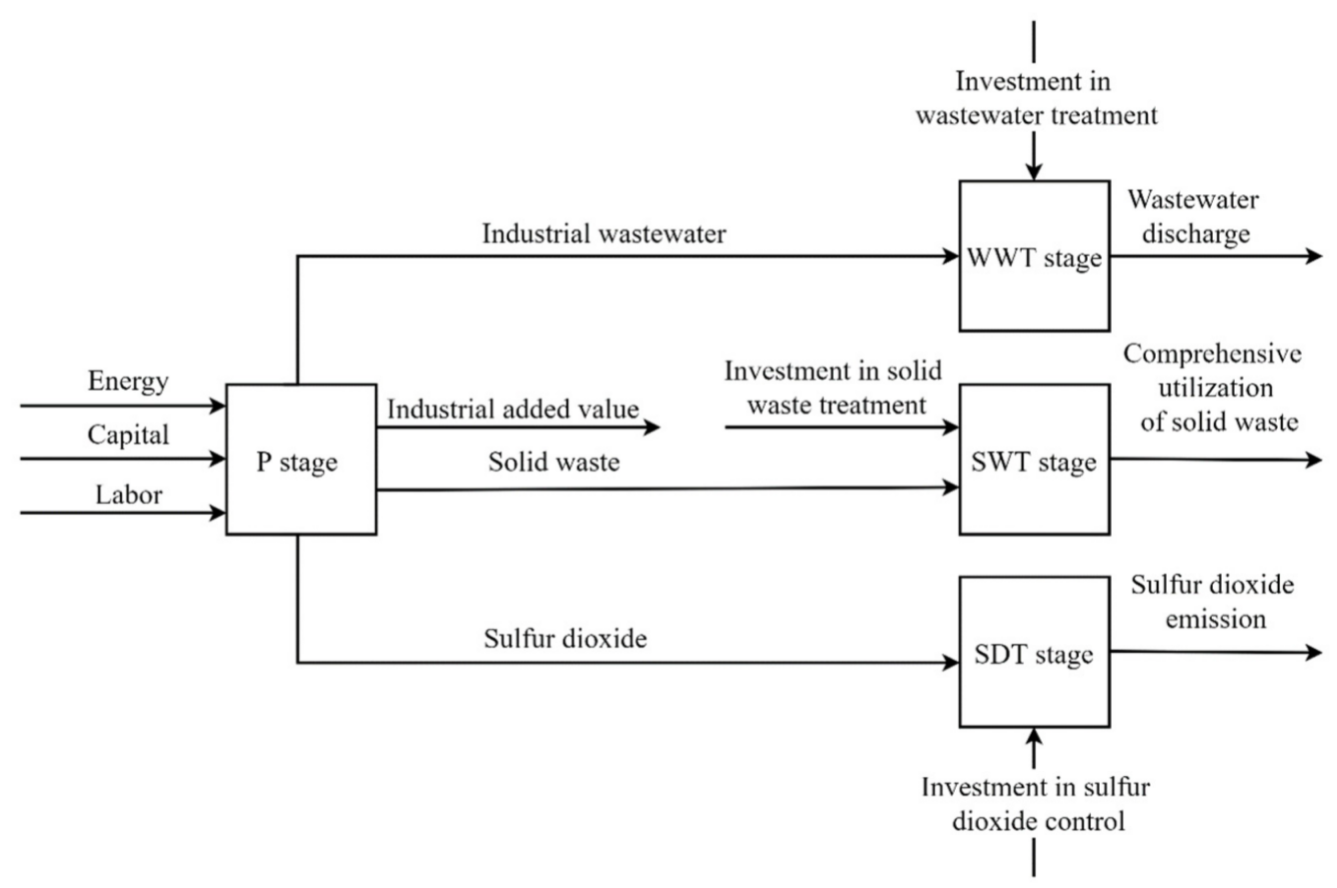
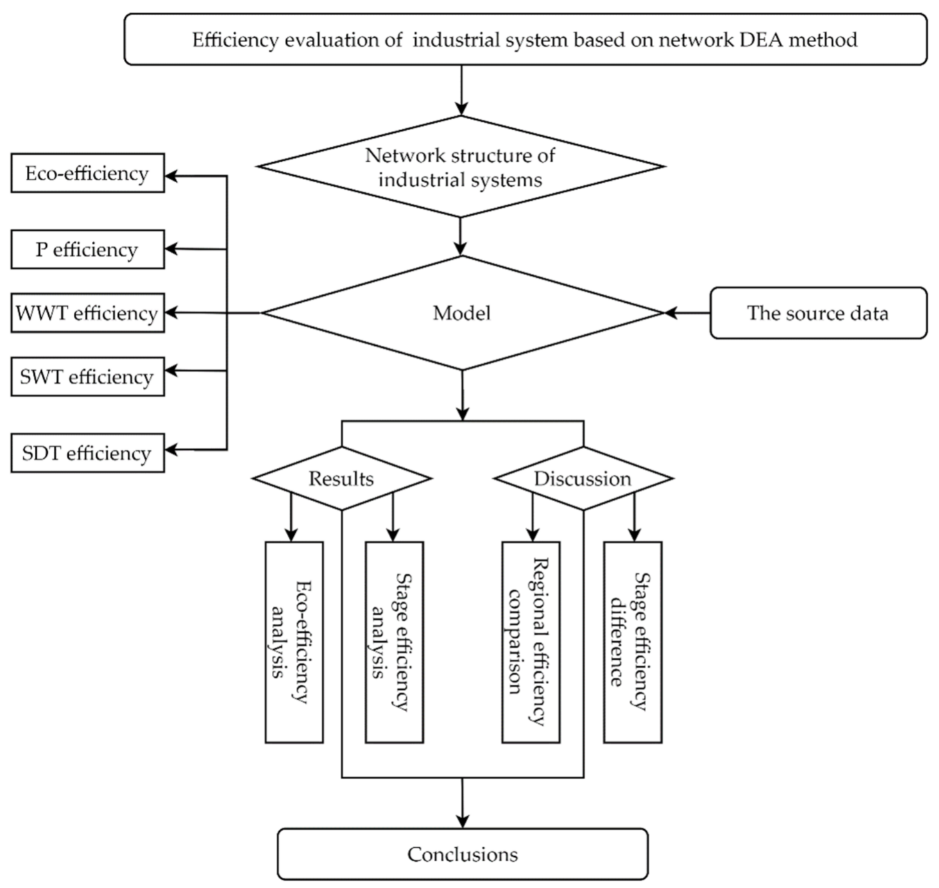
There are two main methods to study the efficiency of industrial sectors. The first is parametric method represented by stochastic frontier method (SFA). The other is the more widely used non-parametric method represented by data envelopment analysis (DEA), which makes up for the shortcomings of the SFA method. It does not need to specify a certain functional relationship between input and output. The operation process of the Chinese provincial industrial system consists of four stages, namely the production (P) stage, wastewater treatment (WWT) stage, solid waste treatment (SWT) stage, and sulfur dioxide treatment (SDT) stage. Based on this structure, a four-stage data envelopment analysis (DEA) model is developed to evaluate the eco-efficiency, production efficiency, wastewater treatment efficiency, solid waste treatment efficiency, and sulfur dioxide treatment efficiency of provincial industrial systems in China, considering the undesirable output and variable returns to scale (VRS).
1. Introduction
2. Evaluating Efficiency of Industrial Based on Network DEA Method
References
- Zhang, L.; Zhao, L.L.; Zha, Y. Efficiency evaluation of Chinese regional industrial systems using a dynamic two-stage DEA approach. Socio-Econ. Plan. Sci 2021, 77, 101031.
- Díaz-Villavicencio, G.; Didonet, S.R.; Dodd, A. Influencing factors of eco-efficient urban waste management: Evidence from Spanish municipalities. J. Clean. Prod. 2017, 164, 1486–1496.
- Delgado-Antequera, L.; Gémar, G.; Molinos-Senante, M.; Gómez, T.; Caballero, R.; Sala-Garrido, R. Eco-efficiency assessment of municipal solid waste services: Influence of exogenous variables. Waste Manag. 2021, 130, 136–146.
- Lo Storto, C. Eco-Productivity Analysis of the Municipal Solid Waste Service in the Apulia Region from 2010 to 2017. Sustainability 2021, 13, 12008.
- Li, R.; Sun, T. Research on Impact of Different Environmental Regulation Tools on Energy Efficiency in China. Pol. J. Environ. Stud. 2020, 29, 4151–4160.
- Wu, J.; Zhu, Q.; Liang, L. CO2 emissions and energy intensity reduction allocation over provincial industrial sectors in China. Appl. Energy 2016, 166, 282–291.
- Zhou, D.Q.; Wang, Q.; Su, B.; Zhou, P.; Yao, L.X. Industrial energy conservation and emission reduction performance in China: A city-level nonparametric analysis. Appl. Energy 2016, 166, 201–209.
- Song, M.L.; Peng, J.; Wang, J.L.; Zhao, J.J. Environmental efficiency and economic growth of China: A Ray slack-based model analysis. Eur. J. Oper. Res. 2018, 269, 51–63.
- Zhang, Y.-J.; Hao, J.-F. Carbon emission quota allocation among China’s industrial sectors based on the equity and efficiency principles. Ann. Oper. Res. 2016, 255, 117–140.
- Sun, J.; Du, T.; Sun, W.; Na, H.; He, J.; Qiu, Z.; Yuan, Y.; Li, Y. An evaluation of greenhouse gas emission efficiency in China’s industry based on SFA. Sci. Total Environ. 2019, 690, 1190–1202.
- Fetanat, A.; Shafipour, G. A hybrid method of LMDI, symmetrical components, and SFA to estimate the distribution of energy-saving potential with consideration of unbalanced components in decomposition analysis. Energ Effic. 2017, 10, 1041–1059.
- Wang, C.; Zhan, J.; Bai, Y.; Chu, X.; Zhang, F. Measuring carbon emission performance of industrial sectors in the Beijing-Tianjin-Hebei region, China: A stochastic frontier approach. Sci. Total Environ. 2019, 685, 786–794.
- Charnes, A.; Cooper, W.W.; Rhodes, E. Measuring the efficiency of decision making units. Eur. J. Oper. Res. 1978, 2, 429–444.
- Chen, L.; Jia, G. Environmental efficiency analysis of China’s regional industry: A data envelopment analysis (DEA) based approach. J. Clean. Prod. 2017, 142, 846–853.
- Zhou, H.; Yang, Y.; Chen, Y.; Zhu, J. Data envelopment analysis application in sustainability: The origins, development and future directions. Eur. J. Oper. Res. 2018, 264, 1–16.
- Sueyoshi, T.; Yuan, Y.; Goto, M. A literature study for DEA applied to energy and environment. Energy Econ. 2017, 62, 104–124.
- Song, C.; Yin, G.; Lu, Z.; Chen, Y. Industrial ecological efficiency of cities in the Yellow River Basin in the background of China’s economic transformation: Spatial-temporal characteristics and influencing factors. Environ. Sci. Pollut. Res. Int. 2022, 29, 4334–4349.
- Fang, T.; Fang, D.; Yu, B. Carbon emission efficiency of thermal power generation in China: Empirical evidence from the micro-perspective of power plants. Energ Policy 2022, 165, 112955.
- Moutinho, V.; Madaleno, M. A Two-Stage DEA Model to Evaluate the Technical Eco-Efficiency Indicator in the EU Countries. Int. J. Environ. Res. Public Health 2021, 18, 3038.
- Ramli, N.A.; Munisamy, S.; Arabi, B. Scale directional distance function and its application to the measurement of eco-efficiency in the manufacturing sector. Ann. Oper. Res. 2013, 211, 381–398.
- Hermoso-Orzáez, M.J.; García-Alguacil, M.; Terrados-Cepeda, J.; Brito, P. Measurement of Environmental Efficiency in the Countries of the European Union with the Enhanced Data Envelopment Analysis Method (DEA) during the Period 2005–2012. In Proceedings of the 5th Ibero-American Congress on Entrepreneurship, Energy, Environment and Technology—CIEEMAT, Portalegre, Portugal, 11–13 September 2019.
- Wang, K.; Wei, Y.-M. China’s regional industrial energy efficiency and carbon emissions abatement costs. Appl. Energy 2014, 130, 617–631.
- Nguyen, N.T. Integrating two stages of Malmquist index and Grey forecasting to access industrial performance: A case of Vietnamese steel industry. J. Grey Syst. 2021, 33, 43–58.
- Bi, G.-B.; Song, W.; Zhou, P.; Liang, L. Does environmental regulation affect energy efficiency in China’s thermal power generation? Empirical evidence from a slacks-based DEA model. Energ Policy 2014, 66, 537–546.
- Guo, X.; Zhu, Q.; Lv, L.; Chu, J.; Wu, J. Efficiency evaluation of regional energy saving and emission reduction in China: A modified slacks-based measure approach. J. Clean. Prod. 2017, 140, 1313–1321.
- Sueyoshi, T.; Goto, M. Undesirable congestion under natural disposability and desirable congestion under managerial disposability in U.S. electric power industry measured by DEA environmental assessment. Energy Econ. 2016, 55, 173–188.
- Zhu, N.; He, K. The efficiency of major industrial enterprises in Sichuan province of China: A super slacks-based measure analysis. J. Ind. Manag. Optim. 2022.
- Wu, J.; Li, M.J.; Zhu, Q.Y.; Zhou, Z.X.; Liang, L. Energy and environmental efficiency measurement of China’s industrial sectors: A DEA model with non-homogeneous inputs and outputs. Energy Econ. 2019, 78, 468–480.
- Färe, R.; Grosskopf, S. Network DEA. Socio-Econ. Plan. Sci. 2000, 34, 35–49.
- Tone, K.; Tsutsui, M. Network DEA: A slacks-based measure approach. Eur. J. Oper. Res. 2009, 197, 243–252.
- Tone, K.; Tsutsui, M. Dynamic DEA with network structure: A slacks-based measure approach. Omega-Int. J. Manag. Sci. 2014, 42, 124–131.
- Cook, W.D.; Zhu, J.; Bi, G.B.; Yang, F. Network DEA: Additive efficiency decomposition. Eur. J. Oper. Res. 2010, 207, 1122–1129.
- Kao, C. Decomposition of slacks-based efficiency measures in network data envelopment analysis. Eur. J. Oper. Res. 2020, 283, 588–600.
- Jiang, B.; Chen, H.; Li, J.; Lio, W.C. The uncertain two-stage network DEA models. Soft Comput. 2020, 25, 421–429.
- Hatami-Marbini, A.; Saati, S. Measuring performance with common weights: Network DEA. Neural Comput. Appl. 2020, 32, 3599–3617.
- Zuo, Z.; Guo, H.; Li, Y.; Cheng, J. A two-stage DEA evaluation of Chinese mining industry technological innovation efficiency and eco-efficiency. Environ. Impact Assess. Rev. 2022, 94, 106762.
- Meng, M.; Pang, T. Operational efficiency analysis of China’s electric power industry using a dynamic network slack-based measure model. Energy 2022, 251, 123898.
- Bian, Y.; Liang, N.; Xu, H. Efficiency evaluation of Chinese regional industrial systems with undesirable factors using a two-stage slacks-based measure approach. J. Clean. Prod. 2015, 87, 348–356.
- Liu, Y.; Wang, K. Energy efficiency of China’s industry sector: An adjusted network DEA (data envelopment analysis)-based decomposition analysis. Energy 2015, 93, 1328–1337.
- Li, Y.J.; Shi, X.; Emrouznejad, A.; Liang, L. Environmental performance evaluation of Chinese industrial systems: A network SBM approach. J. Oper. Res. Soc. 2018, 69, 825–839.
- Mousavizadeh, R.; Navabakhsh, M.; Hafezalkotob, A. Cost-efficiency measurement for two-stage DEA network using game approach: An application to electrical network in Iran. Sadhana-Acad. Proc. Eng. Sci. 2020, 45, 1–16.
- Moon, H.; Min, D. A DEA approach for evaluating the relationship between energy efficiency and financial performance for energy-intensive firms in Korea. J. Clean. Prod. 2020, 255, 120283.
- Lu, C.C.; Dan, W.; Chen, X.; Tseng, C.K.; Chou, K.W. Evaluation of the operating performance of Taiwanese machine tool industry with the dynamic network DEA model. Enterp. Inf. Syst. 2020, 15, 87–104.
- Lo Storto, C. Measuring the efficiency of the urban integrated water service by parallel network DEA: The case of Italy. J. Clean. Prod. 2020, 276.

