At present, the concepts of energy conservation and emission reduction, clear water and green mountains have become more and more common across society. As one of the representative sectors of high energy consumption and high emissions, how to improve the energy and environmental efficiency of industrial enterprises has attracted more and more attention from the industry and academia. Generally speaking, the efficiency evaluation of industrial sectors is mainly carried out at the regional and industry levels. For example, reference [
6] used a DEA based method to evaluate the energy and environmental efficiency of 30 regions in China and found that the energy and environmental efficiency of Chinese industry was poor. Reference [
7] applied the Malmquist index (MI) method to evaluate the performance of industrial energy conservation and emission reduction in more than 200 Cities in China. Reference [
8] used DEA to evaluate provincial environmental efficiency in China from 2004 to 2012. Reference [
9] used the input-oriented ZSG-DEA model to explore the carbon emission quota efficiency of 39 industries in China in 2020.
There are two main methods to study the efficiency of industrial sectors. The first is parametric method represented by stochastic frontier method (SFA). For example, reference [
10] used SFA to evaluate the GHG efficiency of 26 industries in China at the industry level and analyzed its influencing factors. Reference [
11] proposed a hybrid method using logarithmic average divided by index, symmetric component, and SFA to estimate the energy saving potential of industrial sectors. Reference [
12] quantitatively measured the total factor carbon emission performance and carbon emission reduction potential of 39 industrial sectors in the Beijing–Tianjin–Hebei region from 2010 to 2016 by using SFA method. However, a great limitation of these studies lies in the fact that the functional form of industrial production technology must be given compulsorily in advance, that is, a certain functional relationship between input and output, and different functional forms may lead to different evaluation results, which is a deficiency of SFA method for industrial system efficiency evaluation. The other is the more widely used non-parametric method represented by DEA, which makes up for the shortcomings of the SFA method. It does not need to specify a certain functional relationship between input and output. This method was first proposed by [
13] in 1978. Since then, more and more research on methods, model innovation, and different application scenarios based on this method have been carried out, including [
14,
15]. For the research on energy and environment using DEA method, please refer to the review of [
16].
Research on efficiency evaluation of industrial systems using traditional DEA or its extended model mostly regard the evaluated system as a “black box” structure without considering its internal situation. Reference [
17] used the super-efficiency DEA model to evaluate the eco-environmental benefits of cities in the Yellow River Basin from 2008 to 2017, and discussed the temporal and spatial evolution characteristics of regional economic benefits and the factors affecting regional economic benefits. Reference [
18] used the data of 42 thermal power plants in China in 2020 to construct a multi-dimensional index evaluation system of carbon emission efficiency from three aspects: energy, economy, and environment. The super-efficiency slacks-based measure (SBM) model with undesirable output is used to identify and distinguish several efficient decision units and the efficiency improvement path of inefficient thermal power plant is discussed. Reference [
19] used non-parametric DEA and fractional regression model to analyze the evolution of eco-efficiency in 27 countries of the European Union (EU) from 2008 to 2018, providing a high level of attention to the relationship between economic growth and environmental performance in the EU. Reference [
20] extends the previous framework for efficiency analysis, introducing a new slacks-based measure of efficiency called the scale directional distance function (SDDF) approach, used to measure the eco-efficiency of Malaysia’s manufacturing industry. Reference [
21] uses DEA methodology to calculate environmental efficiency across the 28 member states of the European Union (EU). For more studies in this field, please refer to [
22,
23,
24,
25,
26,
27,
28]. To determine the causes of inefficiency in industrial systems, it is necessary to consider the internal structure of industrial systems. Therefore, reference [
29] developed a network DEA model for evaluating organizational performance and its component performance. The proposed network DEA model has aroused the research interest of many scholars, and many new network DEA expansion models have been developed successively, such as network SBM model and dynamic network SBM model of [
30,
31], additive network DEA efficiency decomposition model of [
32], and network DEA efficiency decomposition method of [
33]. Reference [
34] extended the traditional two-stage network DEA model to the uncertain two-stage network DEA model. Reference [
35] proposed a common weight network DEA model when the production system contains multiple interrelated processes. The two-stage DEA model is a kind of network model. Reference [
36] used two-stage DEA model to construct an index system to measure the mining technology innovation efficiency, mining eco-efficiency, and mining comprehensive efficiency of 30 provinces in China. Reference [
37] simulated the operation process of the electric power industry through the network structure, introduced the dynamic slacks-based measure method, and evaluated the operation efficiency of the whole industry and each stage in each period. Reference [
38] proposed a two-stage efficiency evaluation model of Chinese regional industrial system based on SBM-DEA. The model decomposed efficiency into production efficiency and emission reduction efficiency, which can simultaneously estimate the efficiency of the entire regional industrial system, production stage, and emission reduction stage. However, this study did not consider the differences in the treatment processes of different industrial pollutants in the treatment stage, and could not further find out the cause of low efficiency in the internal stage of the system. Reference [
39] separated the energy production sector from the energy consumption sector and proposed an adjusted energy efficiency evaluation network DEA model, which was then applied to the energy efficiency evaluation of provincial industrial sectors in China. Reference [
40] established a network SBM model to evaluate the environmental performance of the Chinese industrial system. Reference [
41] proposed a two-stage game DEA method, using centralized and Stackelberg game models to measure the cost efficiency (CE) of Iran’s power grid. Reference [
42] extended the existing two-stage network DEA model that distinguishes pure energy efficiency from economic efficiency to investigate whether energy efficiency has a positive relationship with corporate financial performance in South Korea. Reference [
43] used a dynamic network DEA (DNDEA) model to evaluate the performance of Taiwan’s machine tool industry from 2010 to 2014. Using data from fiscal 2011 and 2017, reference [
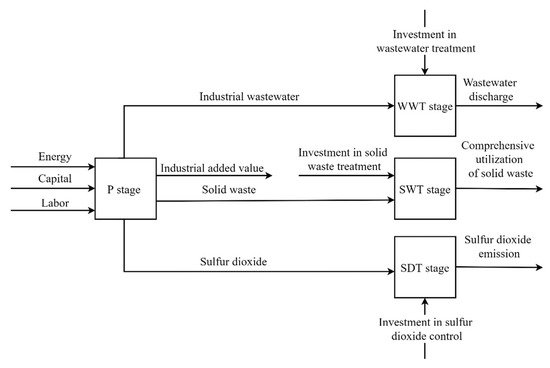
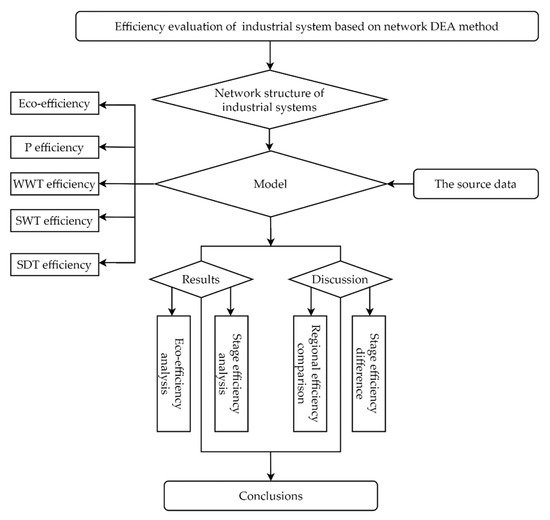
44] analyzed the efficiency of the Italian urban water sector using an extended parallel network DEA model. These studies considered the internal structure of the industrial system, but did not carry out a further analysis of the sub-stage, so they could not further find out the deeper reasons for the inefficiency of the system. In view of this, this paper reexamines the internal structure of the industrial system on the basis of these scholars’ research, proposes a new network SBM model according to the characteristics of the system structure, and evaluates the efficiency of the Chinese provincial industrial system. The research route is shown in
Figure 2.