Your browser does not fully support modern features. Please upgrade for a smoother experience.
Submitted Successfully!
 +1 credit
Thank you for your contribution! You can also upload a video entry or images related to this topic.
For video creation, please contact our Academic Video Service.
| Version | Summary | Created by | Modification | Content Size | Created at | Operation |
|---|---|---|---|---|---|---|
| 1 | Carmelo Corsaro | -- | 3603 | 2022-05-08 17:41:37 | | | |
| 2 | Jason Zhu | -37 word(s) | 3566 | 2022-05-09 03:44:10 | | | | |
| 3 | Jason Zhu | Meta information modification | 3566 | 2022-05-09 03:46:49 | | |
Video Upload Options
We provide professional Academic Video Service to translate complex research into visually appealing presentations. Would you like to try it?
Cite
If you have any further questions, please contact Encyclopedia Editorial Office.
Corsaro, C.; Vasi, S.; Neri, F.; Mezzasalma, A.; Neri, G.; Fazio, E. Conventional Approaches of Nuclear Magnetic Resonance Statistics. Encyclopedia. Available online: https://encyclopedia.pub/entry/22694 (accessed on 23 July 2026).
Corsaro C, Vasi S, Neri F, Mezzasalma A, Neri G, Fazio E. Conventional Approaches of Nuclear Magnetic Resonance Statistics. Encyclopedia. Available at: https://encyclopedia.pub/entry/22694. Accessed July 23, 2026.
Corsaro, Carmelo, Sebastiano Vasi, Fortunato Neri, Angela Mezzasalma, Giulia Neri, Enza Fazio. "Conventional Approaches of Nuclear Magnetic Resonance Statistics" Encyclopedia, https://encyclopedia.pub/entry/22694 (accessed July 23, 2026).
Corsaro, C., Vasi, S., Neri, F., Mezzasalma, A., Neri, G., & Fazio, E. (2022, May 08). Conventional Approaches of Nuclear Magnetic Resonance Statistics. In Encyclopedia. https://encyclopedia.pub/entry/22694
Corsaro, Carmelo, et al. "Conventional Approaches of Nuclear Magnetic Resonance Statistics." Encyclopedia. Web. 08 May, 2022.
Copy Citation
Nuclear magnetic resonance (NMR) measurements combined with chemometrics allow achieving a great amount of information for the identification of potential biomarkers responsible for a precise metabolic pathway. These kinds of data are useful in different fields, ranging from food to biomedical fields, including health science. The investigation of the whole set of metabolites in a sample, representing its fingerprint in the considered condition, is known as metabolomics and may take advantage of different statistical tools. The new frontier is to adopt self-learning techniques to enhance clustering or classification actions that can improve the predictive power over large amounts of data.
nuclear magnetic resonance
Conventional Approaches
Unsupervised
Pathway
1. Introduction
Metabolomics corresponds to the part of omics sciences that investigates the whole set of small molecule metabolites in an organism, representing a large number of compounds, such as a portion of organic acids, amino acids, carbohydrates, lipids, etc. [1][2]. The investigation and the recording of metabolites by target analysis, metabolic profiling and metabolic fingerprinting (i.e., extracellular metabolites) are fundamental steps for the discovery of biomarkers, helping in diagnoses and designing appropriate approaches for drug treatment of diseases [3][4]. There are many databases available with metabolomics data, including spectra acquired by nuclear magnetic resonance (NMR) and mass spectrometry (MS), but also metabolic pathways. Among them, the Human Metabolome Database (HMDB) [5] and Biological Magnetic Resonance Bank (BMRB) [6] were mentioned that contain information on a large number of metabolites gathered from different sources. By means of the corresponding web platform, it is possible, for instance, to search for mono- and bi-dimensional spectra of metabolites, starting from their peak position [2]. However, metabolomics databases still lack homogeneity mainly due to the different acquisition conditions, including employed instruments. Thus, the definition of uniform and minimum reporting standards and data formats would allow an easier comparison and a more accurate investigation of metabolomics data [7].
In recent years, NMR has become one of the most employed analytical non-destructive techniques for clinical metabolomics studies. In fact, it allows to detect and quantify metabolic components of a biological matrix whose concentration is comparable or bigger than 1 μM. Such sensitivity, relatively low if compared with other MS techniques, allows to assign up to 20 metabolites in vivo, and up to 100 metabolites in vitro [8][9][10]. Numerous strategies are being designed to overcome actual limitations, including a lower selectivity compared to the MS technique coupled with gas or liquid chromatography (GC-MS and LC-MS, respectively) and a low resolution for complex biological matrices. These include the development of new pulse sequences mainly involving field gradients for observing multidimensional hetero- or homo-nuclear correlations [11]. Within metabolomics investigations, NMR analyses are usually coupled with statistical approaches: sample randomization allows to reduce the correlation between confounding variables, sample investigation order and experimental procedures. In the last ten years, nested stratified proportional randomization and matched case-control design were adopted in the case of imbalanced results.
2. Unsupervised Methods
In the analysis of large metabolomic NMR datasets, unsupervised techniques are applied with the aim to identify any significant pattern within unlabeled databases without any human action.
2.1. Principal Component Analysis (PCA)
Principal component analysis (PCA) is employed for lowering the dimensionality of high-dimensional datasets, preserving as much information as possible by means of a “linear” multivariate analysis [12][13]. This approach employs a linear transformation to define a new smaller set of “summary indices”—or “principal components” (PCs)—that are more easily visualized and analyzed [14]. In this frame, principal components correspond to new variables obtained by the linear combination of the initial variables by solving an eigenvalue/eigenvector problem. The first principal component (PC1) represents the “path” along which the variance of the data is maximized. As happens for the first principal component, the second one (PC2) also defines the maximum variance in the database. Nevertheless, it is completely uncorrelated to the PC1 following a direction that is orthogonal to the first component path. This step reiterates based on the dimensionality of the system, where a next principal component is the direction orthogonal to the prior components with the most variance. If there are significant distinctions between the ranges of initial variables (those variables with smaller ranges will be dominated by those with larger ones), distorted results may occur. To avoid this kind of problem, it is required to perform a standardization operation before executing PCA that corresponds to a transformation of the data into comparable scales. This can be done by using different scaling transformations, such as autoscaling, the generalized logarithm transform or the Pareto scaling with the aim to enhance the importance of small NMR signals, whose variation is more affected by the noise [15]. One of the most used transformation is the mean centered autoscaling:

Furthermore, the computation of the covariance matrix is required to discard redundant information mainly due to the presence of any relationship between the initial variables of the data. The covariance matrix is symmetric being composed by the covariances of all pairs of the considered n variables:

In this frame, PCs can be obtained by finding the eigenvectors and eigenvalues from this covariance matrix. Figure 1 shows a graph with only three variables axes of the n-dimensional variables space. The red point in this figure represents the average point used to move the origin of the coordinate system by means of the mean-centering procedure in the standardization process. Once it was defined PC1 and PC2, as shown in Figure 1, they define a plane that allows inspecting the organization of the studied database. Further, the projection of the data with respect to the new variables (PCs) is called the score plot, and if the data are statistically different/similar, they can be regrouped and classified.
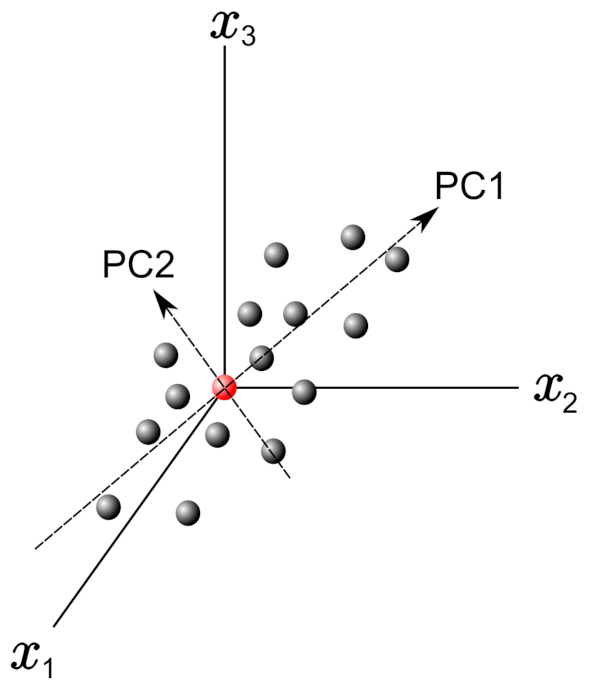
Figure 1. Example plot with 3 variable axes in a n-dimensional variable space. The principal components PC1 and PC2 are reported.
PCA is usually applied in NMR-metabolomic studies because it simplifies the investigation of hundreds of thousands of chemical components in metabolomic database composed of several collected NMR spectra. In this way, each NMR spectrum is confined to a single point in the score plot in which similar spectra are regrouped, and differences on the PC axes shed light on experimental variations between the measurements [16][17][18][19]. However, it is noteworthy that PCA, like the other latent structure techniques, must be applied to matrices where the number of cases is greater than the number of variables [20].
The PCA technique can also be combined with other statistical approaches, including the analysis of variance (ANOVA) as reported by Smilde et al. [21] in their ANOVA-simultaneous component analysis (ASCA). This method is able to associate observed data changes to the different experimental designs. It is applied to metabolomics data, for example, to study variations of the metabolites level in human saliva due to oral rinsing [22], or the metabolic responses of yeast at different starving conditions [23].
2.2. Clustering
Clustering is a data analysis technique used to regroup unlabeled data on the basis of their similarities or differences. Examples of clustering algorithms are essentially the following: exclusive, overlapping, hierarchical, and probabilistic clustering [24][25]. Exclusive and overlapping clustering can be described together because they differ for the existence of one or multiple data points in one or more clustered sets. In fact, while exclusive clustering establishes that a data point can occur only in one cluster, overlapping clustering enables data points to be part of multiple clusters with different degrees of membership. Exclusive and overlapping clustering are hard or k-means clustering and soft or fuzzy k-means clustering, respectively [26][27][28]. In hard clustering, every element in a database might be a part of a single and precise cluster, whereas in soft clustering, there is a probability of having each data point into a different cluster [28]. Generally speaking, k-means clustering is a “distance-based” method in which each “clustered set” is linked with a centroid that is considered to minimize the sum of the distances between data points in the cluster.
Hierarchical clustering analysis (HCA) is used to recognize non-linear evolution in the data—contrary to what was done by the PCA which shows a linear trend—by means of a regrouping of features sample by sample without having any previous information [29]. This clustering method could be divided in two groups: (i) agglomerative clustering, and (ii) divisive clustering [30][31]. The first one allows to keep data points separate at first, unifying them iteratively later until it one cluster with a precise similarity between the data points is obtained. In the opposite way, divisive clustering creates a separation of data points in a data cluster on the basis of their differences. The clustering analysis leads to dendrograms that are diagrams in which the horizontal row represents the linked residues, whereas the vertical axis describes the correlation between a residue and previous groups
HCA analysis, performed on 1H NMR data recording the plasma metabolome of 50 patients with early breast cancer [32], allowed to discriminate among three different groups characterized by significantly different levels of some metabolites, such as lactate, pyruvate and glutamin [32]. In this case, the Ward algorithm is adopted for measuring the distance. Furthermore, covariance analysis of NMR chemical shift changes allows defining functional clusters of coupled residues [33].
Clustering has been largely applied for metabolomic studies covering fields from medicine to food science and is essentially adopted for samples’ classification by grouping metabolites without any external bias. This allows entering into the details of the precise metabolic pathways that may provide a connection between metabolomics and molecular biology. In such a way, many biomedical applications, including diagnostics and drug synthesis, would reach important improvements.
2.3. Self-Organizing Maps (SOMs)
Self-organizing maps (SOMs) were introduced by Kohonen [34] and are widely employed to cluster a database, reduce its dimension and detect its properties by projecting the original data in a new discrete organization of smaller dimensions. This is performed by weighting the data throughout proper vectors in order to achieve the best representation of the sample. Starting from a randomly selected vector, the algorithm constructs the map of weight vectors for defining the optimal weights, providing the best similarity to the chosen random vector. Vectors with weights close to the optimum are linked with each unit of the map allowing to categorize objects in map units. Then, the relative weight and the total amount of neighbors reduce over time. Therefore, SOMs have the great power of reducing the dimensionality of the system while preserving its topology. For that reason, they are commonly adopted for data clustering and as a visualization tool. Another great asset of SOMs concerns the shapes of the clusters that do not require being chosen before applying the algorithm, whereas other clustering techniques usually work well on specific cluster shapes [35]. However, some limitations are evidenced using SOMs. In fact, they are normally of low quality, and the algorithm must be run many times before a satisfactory outcome is reached. Further, it is not easy to furnish information about the whole data distribution by only observing the raw map.
The results achieved in the study of renal cell carcinoma (RCC) by (NMR)-based serum metabolomics using SOM are able to separate healthy subjects (left region) and RCC patients (right region) within the SOM. Moreover, the weighted maps of the individual metabolites allow to identify a biomarker cluster including the following seven metabolites: alanine, creatine, choline, isoleucine, lactate, leucine, and valine. These may be considered for an early diagnosis of renal cell carcinoma [36].
3. Supervised Methods
Problems or datasets having response variables (discrete or continuous) are generally treated with supervised methods. It was distinguished between classification or regression problems, depending on whether the variables are discrete or continuous, respectively. The supervised technique is based on the association between the response variable (used to drive the model training) and the predictors (namely covariates) with the aim to perform precise predictions [37][38][39]. In fact, first, a training dataset is used as fitting model, while, in a second step, a testing dataset is used to estimate the predictive power. The relevant predictors are chosen by three types of feature selection methods [40] whose merits and demerits are listed in the scheme drawn in Figure 2 [41]:
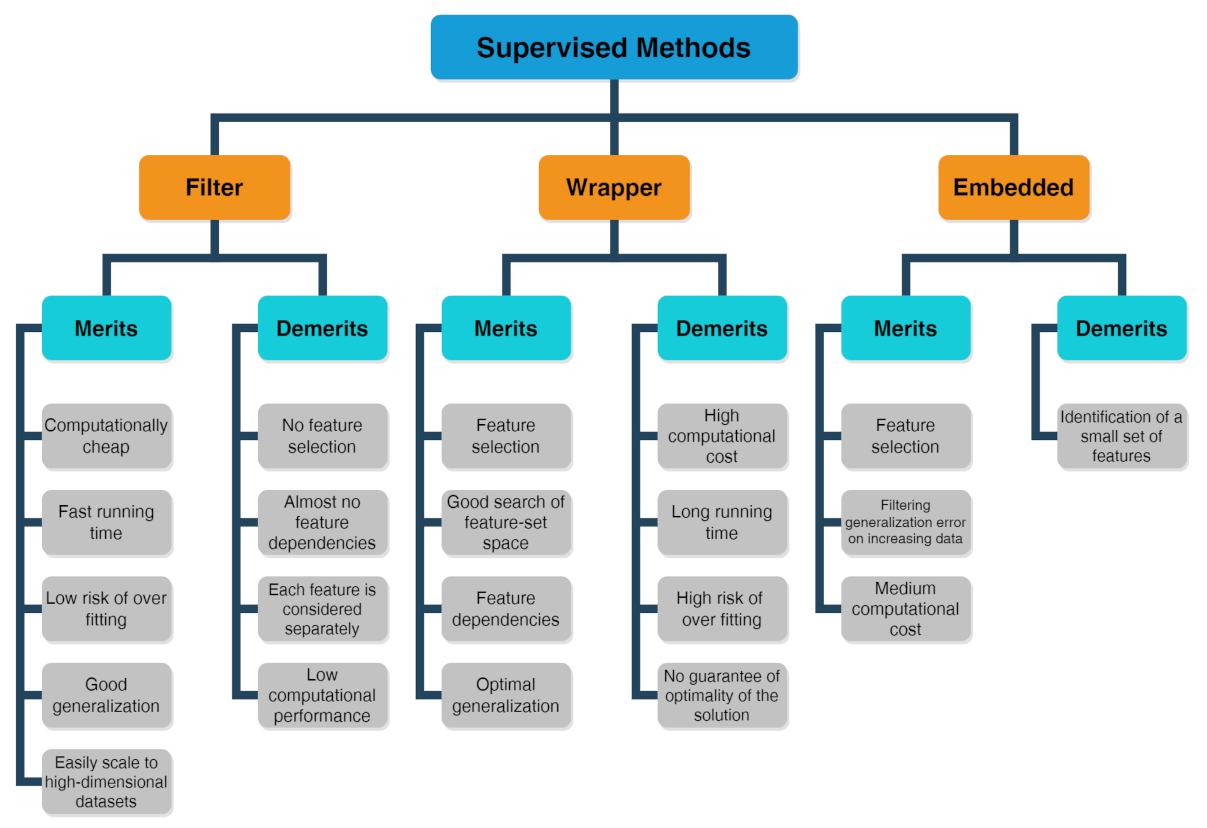
Figure 2. Scheme about merits and demerits of supervised methods, including filter, wrapper and embedded feature selection approaches.
-
The filter method marks subgroups of variables by calculate “easy to compute” quantities ahead of the model training.
-
The wrapper method marks subgroups of variables by applying the chosen trained models on the testing dataset with the aim to determine the achieving the optimal performance.
-
The embedded method is able to ascertain simultaneously the feature selection and model structure.
Then, to measure the robustness of the fitting model and the predictive power, statistical approaches are adopted. Among them, the root mean square error was mention for calculating regression, sensitivity and specificity and the area under the curve for achieving classification.
For simplicity, in binary classification, the test prediction can provide the following four results: true positive (TP), false positive (FP), true negative (TN), and false negative (FN). The model sensitivity, which coincides with the TP rate (TPR, i.e., the probability of classifying a real positive case as positive), is defined as TP/(TP + FN). On the contrary, the specificity is defined as TN/(FP + TN) and is linked to the ability of the test to correctly rule out the FP (FP rate, FPR = 1 − specificity). In order to evaluate the performance of binary classification algorithms, the most used approach is that of the receiver operating characteristic (ROC) curve, which consists of plotting TPR vs. FPR for the considered classifier at different threshold values. The performance of the classifier is usually indicated by the value of the corresponding area under the ROC curve (AUC).
Furthermore, several resampling methods, including bootstrapping and cross validation, can be adopted to achieve more reliable outcomes. This is a general description of the supervised methods.
4. Pathway Analysis Methods
A powerful method to describe peculiar features of the cell metabolism is pathway analysis (PA), which provides a graphical representation of the relationships among the actors (mainly enzymes and metabolites) of precise catalyzed reactions. Therefore, PA is highly employed for the interpretation of high-dimensional molecular data [42]. In fact, taking advantage of the already acquired knowledge of biological pathways, proteins, metabolites and also genes can be mapped onto newly developed pathways with the objective to draw their collective functions and interactions in that specific biological environment [43]. Although PA was initially developed for the interpretation of transcriptomic data, in the last decades, it has become a common method in metabolomics, being particularly suited to find associations between molecules involved in the same biological function for a given phenotype [44][45][46].
PA methods include several tools allowing deep statistical analyses in metabolomics known as enrichment analysis. They grant the functional interpretation of the achieved results mainly in terms of statistically significant pathways [47]. These tools can handle heterogeneous and hierarchical vocabularies and may be classified into two distinct collections. The first encompasses “non-topology-based” (non-TB) approaches, which do not consider the acquired knowledge concerning the character of each metabolite in the considered pathways [48]. Non-TB approaches include the over-representation analysis (ORA) as the first generation technique and the functional class scoring (FCS) as the second generation. Finally, the second collection includes topology-based methods that are adopted to determine those pathways that are significantly impacted in a given phenotype.
This latter approach can be classified depending on the considered pathways (e.g., signaling or metabolic), inputs (e.g., subset or all metabolites and metabolites p-values), chosen mathematical models, outputs (e.g., pathway scores and p-values) and the wanted implementation (e.g., web-based or standalone) [49][50]. Note that PA methods were originally developed for genes, but they can be successfully applied for every biomolecule/metabolite [51].
4.1. Over-Representation Analysis (ORA)
Over-representation analysis (ORA) is among the most used pathway analysis approaches for the interpretation of metabolomics data needed as input, once the type of annotations to examine is chosen. One obtains a collection of annotations and their associated p-value as outputs since a statistical test is applied to determine whether a set of metabolites is enriched by a specific annotation (e.g., a pathway) in comparison to a background set. Different statistics can be applied to obtain information about the studied biological mechanisms and on the specific functionality of a given metabolite set. Among the most used statistics, researchers would like to mention the well-known binomial probability, Fisher’s exact test and the hypergeometric distribution [52][53].
Three are the necessary inputs in ORA analysis: (i) a set of pathways (or metabolite collections); (ii) a catalog of investigating metabolites and, (iii) a background collection of compounds. The list of investigating metabolites usually comes from experimental data after applying a statistical test to determine those metabolites whose signals can be associated with a precise result by choosing a threshold value usually associated to the p-values [42]. The background collection includes all metabolites that can be revealed in the considered measurement. If the p-value corresponding to each pathway is obtained by means of the right-tailed Fisher’s exact test based on the hypergeometric distribution, the probability to find k metabolites or more in a pathway can be written as [42]:

where N corresponds to the number of background compounds, n is the number of the measured metabolites, M is the number of background metabolites mapping the ith pathway, and k represents the overlap between M and n. A scheme of the ORA principle is displayed in Figure 3 as a 3D Venn diagram. Finally, multiple corrections are usually applied, as calculations are made for many pathways, thus obtaining a collection of significantly enriched pathways (SEP).
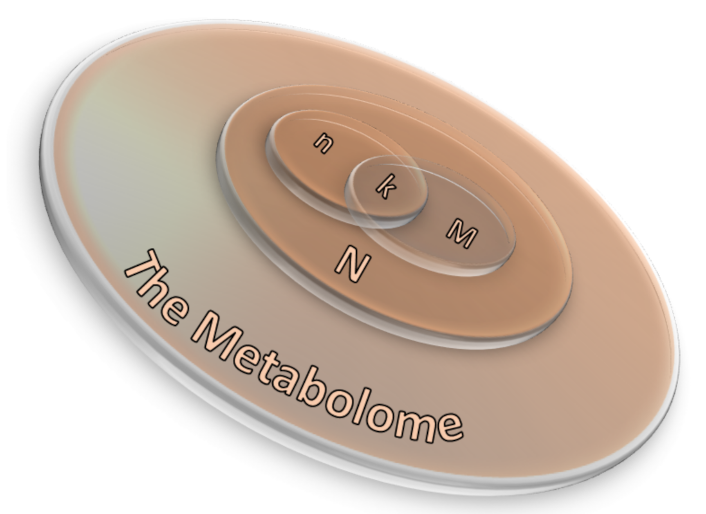
Figure 3. A 3D Venn diagram illustrating the relation between ORA parameters in which N corresponds to the number of background compounds, n is the number of the measured metabolites, M is the number of background metabolites mapping the ith pathway, and k represents the overlap between M and n.
Before applying ORA, one has to verify if the metabolomics dataset is sufficiently big to furnish proper statistical significance. For instance, usually MS-based techniques can observe more metabolites than NMR-based methods, such as the mono-dimensional NMR ones commonly used for profiling [54]. Indeed, the choice of the most suitable background collection is the real challenge and still remains an open subject because it strictly depends on the situation [42].
4.2. Functional Class Scoring (FCS)
Functional class scoring (FCS) methods look for coordinated variations in the metabolites belonging to a specific pathway. In fact, FCS methods take into account those coordinated changes within the individual set of metabolites that, although weak, can have a significant effect of specific pathways [43][46]. Essentially, all FCS methods comprise three steps:
-
A statistical approach is applied to compute differential expression of individual metabolites (metabolite-level statistics), looking for correlations of molecular measurements with phenotype [55]. Those mostly used consider the analysis of variance (ANOVA) [56], Q-statistic [57], signal-to-noise ratio [58], t-test [59], and Z-score [60]. The choice of the most suitable statistical approach may depend on the number of biological replicates and on the effect of the metabolites set on a specific pathway [61].
-
Initial statistics for all metabolites of a given pathway are combined into statistics on different pathways (pathway-level statistics) that can consider interdependencies among metabolites (multivariate) [62] or not (univariate) [59]. The pathway-level statistics usually is performed in terms of the Kolmogorov–Smirnov statistics [58], mean or median of metabolite-level statistics [61], the Wilcoxon rank sum [63], and the maxmean statistics [64]. Note that, although multivariate statistics should have more statistical significance, univariate statistics provide the best results if applied to the data of biologic systems (p≤ 0.001) [65].
-
The last FCS step corresponds to estimating the significance of the so-called pathway-level statistics. In detail, the null hypothesis can be tested into two different ways: (i) by permuting metabolite labels for every pathways, so comparing the set of metabolites in that pathway with a set of metabolites not included in that pathway (competitive null hypothesis) [43] and (ii) by permuting class labels for every sample, so comparing the collection of metabolites in a considered pathway with itself, whereas the metabolites excluded by that pathway are not considered (self-contained null hypothesis) [59].
4.3. Metabolic Pathway Reconstruction and Simulation
The identification of metabolomic biomarkers and their mapping into a neural network is fundamental to further study the cellular mechanisms and its physiology. The goal is to identify the effects of the metabolites (as a function of their concentration) on the cellular changes, providing a relationship with the most likely biologically meaningful sub-networks. Thus, basing on genome annotation and protein homology, reference pathways could be mapped into a specific organism. However, this mapping method often produces incomplete pathways that need the employment of ab initio metabolomic network construction approaches (such as Bayesian networks), where differential equations describe the changes in a metabolomic network in terms of chemical amounts [66][67]. Qi et al. [68] further improved this approach allowing to optimize accuracy in defining metabolomics features or better the correlation between the substrates whose nature is well known as well as the species of each individual reactions, so defining the classification of the mapped metabolic products in a pathway and their modifications under selected perturbations. Recently, Hu et al. [69] performed a pathway analysis on serum spectra recorded by 1H NMR with the aim to identify eventual biomarkers characterizing the treatment of human lung cancer. After a first statistical analysis in terms of PLS-DA, they were able to identify four metabolic pathways associated with the metabolic perturbation induced by non-small-cell lung cancer by means of the MetaboAnalyst package [70]. In detail, the highest pathway impact was shown by the metabolisms of (i) taurine and hypotaurine, (ii) d-glutamine and d-glutamate, (iii) glycine, serine and threonine, and (iv) alanine, aspartate and glutamate, thus shedding light on the responsible processes in this kind of cancer.
References
- Muthubharathi, B.C.; Gowripriya, T.; Balamurugan, K. Metabolomics: Small molecules that matter more. Mol. Omics 2021, 17, 210–229.
- Emwas, A.H.; Roy, R.; McKay, R.T.; Tenori, L.; Saccenti, E.; Gowda, G.A.N.; Raftery, D.; Alahmari, F.; Jaremko, L.; Jaremko, M.; et al. NMR Spectroscopy for Metabolomics Research. Metabolites 2019, 9, 123.
- Onuh, J.O.; Qiu, H. Metabolic Profiling and Metabolites Fingerprints in Human Hypertension: Discovery and Potential. Metabolites 2021, 11, 687.
- Caspani, G.; Sebők, V.; Sultana, N.; Swann, J.R.; Bailey, A. Metabolic phenotyping of opioid and psychostimulant addiction: A novel approach for biomarker discovery and biochemical understanding of the disorder. Br. J. Pharmacol. 2021, 1–29.
- Wishart, D.S.; Guo, A.; Oler, E.; Wang, F.; Anjum, A.; Peters, H.; Dizon, R.; Sayeeda, Z.; Tian, S.; Lee, B.L.; et al. HMDB 5.0: The Human Metabolome Database for 2022. Nucleic Acids Res. 2022, 50, D622–D631.
- Ulrich, E.L.; Akutsu, H.; Doreleijers, J.F.; Harano, Y.; Ioannidis, Y.E.; Lin, J.; Livny, M.; Mading, S.; Maziuk, D.; Miller, Z.; et al. BioMagResBank. Nucleic Acids Res. 2007, 36, D402–D408.
- Goodacre, R.; Broadhurst, D.; Smilde, A.K.; Kristal, B.S.; Baker, J.D.; Beger, R.; Bessant, C.; Connor, S.; Capuani, G.; Craig, A.; et al. Proposed minimum reporting standards for data analysis in metabolomics. Metabolomics 2007, 3, 231–241.
- Claridge, T.D. High-Resolution NMR Techniques in Organic Chemistry; Elsevier: Amsterdam, The Netherlands, 2016.
- Oyedeji, A.B.; Green, E.; Adebiyi, J.A.; Ogundele, O.M.; Gbashi, S.; Adefisoye, M.A.; Oyeyinka, S.A.; Adebo, O.A. Metabolomic approaches for the determination of metabolites from pathogenic microorganisms: A review. Food Res. Int. 2021, 140, 110042.
- Letertre, M.P.M.; Giraudeau, P.; de Tullio, P. Nuclear Magnetic Resonance Spectroscopy in Clinical Metabolomics and Personalized Medicine: Current Challenges and Perspectives. Front. Mol. Biosci. 2021, 8, 698337.
- Emwas, A.H.; Alghrably, M.; Al-Harthi, S.; Poulson, B.G.; Szczepski, K.; Chandra, K.; Jaremko, M. New Advances in Fast Methods of 2D NMR Experiments. In Nuclear Magnetic Resonance; IntechOpen: London, UK, 2020.
- Jaadi, Z. A Step-by-Step Explanation of Principal Component Analysis (PCA). Available online: https://builtin.com/data-science/step-step-explanation-principal-component-analysis (accessed on 8 January 2022).
- AG, S. What Is Principal Component Analysis (PCA) and How It Is Used? Available online: https://www.sartorius.com/en/knowledge/science-snippets/what-is-principal-component-analysis-pca-and-how-it-is-used-507186 (accessed on 8 January 2022).
- Jolliffe, I.T.; Cadima, J. Principal component analysis: A review and recent developments. Philos. Trans. R. Soc. A Math. Phys. Eng. Sci. 2016, 374, 20150202.
- Parsons, H.M.; Ludwig, C.; Günther, U.L.; Viant, M.R. Improved classification accuracy in 1- and 2-dimensional NMR metabolomics data using the variance stabilising generalised logarithm transformation. BMC Bioinform. 2007, 8, 234.
- Khalili, B.; Tomasoni, M.; Mattei, M.; Mallol Parera, R.; Sonmez, R.; Krefl, D.; Rueedi, R.; Bergmann, S. Automated Analysis of Large-Scale NMR Data Generates Metabolomic Signatures and Links Them to Candidate Metabolites. J. Proteome Res. 2019, 18, 3360–3368.
- Izquierdo-Garcia, J.L.; del Barrio, P.C.; Campos-Olivas, R.; Villar-Hernández, R.; Prat-Aymerich, C.; Souza-Galvão, M.L.D.; Jiménez-Fuentes, M.A.; Ruiz-Manzano, J.; Stojanovic, Z.; González, A.; et al. Discovery and validation of an NMR-based metabolomic profile in urine as TB biomarker. Sci. Rep. 2020, 10, 22317.
- Shiokawa, Y.; Date, Y.; Kikuchi, J. Application of kernel principal component analysis and computational machine learning to exploration of metabolites strongly associated with diet. Sci. Rep. 2018, 8, 3426.
- Halouska, S.; Powers, R. Negative impact of noise on the principal component analysis of NMR data. J. Magn. Reson. 2006, 178, 88–95.
- Rutledge, D.N.; Roger, J.M.; Lesnoff, M. Different Methods for Determining the Dimensionality of Multivariate Models. Front. Anal. Sci. 2021, 1, 754447.
- Smilde, A.K.; Jansen, J.J.; Hoefsloot, H.C.J.; Lamers, R.J.A.N.; van der Greef, J.; Timmerman, M.E. ANOVA-simultaneous component analysis (ASCA): A new tool for analyzing designed metabolomics data. Bioinformatics 2005, 21, 3043–3048.
- Lemanska, A.; Grootveld, M.; Silwood, C.J.L.; Brereton, R.G. Chemometric variance analysis of NMR metabolomics data on the effects of oral rinse on saliva. Metabolomics 2012, 8, 64–80.
- Puig-Castellví, F.; Alfonso, I.; Piña, B.; Tauler, R. 1H NMR metabolomic study of auxotrophic starvation in yeast using Multivariate Curve Resolution-Alternating Least Squares for Pathway Analysis. Sci. Rep. 2016, 6, 30982.
- Trepalin, S.V.; Yarkov, A.V. Hierarchical Clustering of Large Databases and Classification of Antibiotics at High Noise Levels. Algorithms 2008, 1, 183–200.
- Tiwari, P.; Madabhushi, A.; Rosen, M. A Hierarchical Unsupervised Spectral Clustering Scheme for Detection of Prostate Cancer from Magnetic Resonance Spectroscopy (MRS). In Medical Image Computing and Computer-Assisted Intervention—MICCAI 2007; Ayache, N., Ourselin, S., Maeder, A., Eds.; Springer: Berlin/Heidelberg, Germany, 2007; pp. 278–286.
- Čuperlović Culf, M.; Belacel, N.; Culf, A.S.; Chute, I.C.; Ouellette, R.J.; Burton, I.W.; Karakach, T.K.; Walter, J.A. NMR metabolic analysis of samples using fuzzy K-means clustering. Magn. Reson. Chem. 2009, 47, S96–S104.
- Zou, X.; Holmes, E.; Nicholson, J.K.; Loo, R.L. Statistical HOmogeneous Cluster SpectroscopY (SHOCSY): An Optimized Statistical Approach for Clustering of 1H NMR Spectral Data to Reduce Interference and Enhance Robust Biomarkers Selection. Anal. Chem. 2014, 86, 5308–5315.
- Gülseçen, S.; Sharma, S.; Akadal, E. Who Runs the World: Data; Istanbul University Press: Istanbul, Turkey, 2020.
- Schonlau, M. Visualizing non-hierarchical and hierarchical cluster analyses with clustergrams. Comput. Stat. 2004, 19, 95–111.
- Yim, O.; Ramdeen, K.T. Hierarchical Cluster Analysis: Comparison of Three Linkage Measures and Application to Psychological Data. Quant. Methods Psychol. 2015, 11, 8–21.
- Zhang, Z.; Murtagh, F.; Poucke, S.V.V.; Lin, S.; Lan, P. Hierarchical cluster analysis in clinical research with heterogeneous study population: Highlighting its visualization with R. Ann. Transl. Med. 2017, 5, 75.
- Richard, V.; Conotte, R.; Mayne, D.; Colet, J.M. Does the 1H-NMR plasma metabolome reflect the host-tumor interactions in human breast cancer? Oncotarget 2017, 8, 49915–49930.
- Selvaratnam, R.; Chowdhury, S.; VanSchouwen, B.; Melacini, G. Mapping allostery through the covariance analysis of NMR chemical shifts. Proc. Natl. Acad. Sci. USA 2011, 108, 6133–6138.
- Kohonen, T. Self-Organizing Maps, 3rd ed.; Springer: Berlin/Heidelberg, Germany, 2001.
- Kaski, S. Data exploration using self-organizing maps. In Acta Polytechnica Scandinavica: Mathematics, Computing and Management in Engineering Series no. 82; Finnish Academy of Technology: Espoo, Finland, 1997.
- Zheng, H.; Ji, J.; Zhao, L.; Chen, M.; Shi, A.; Pan, L.; Huang, Y.; Zhang, H.; Dong, B.; Gao, H. Prediction and diagnosis of renal cell carcinoma using nuclear magnetic resonance-based serum metabolomics and self-organizing maps. Oncotarget 2016, 7, 59189–59198.
- Akdemir, D.; Rio, S.; Isidro y Sánchez, J. TrainSel: An R Package for Selection of Training Populations. Front. Genet. 2021, 12, 607.
- Migdadi, L.; Lambert, J.; Telfah, A.; Hergenröder, R.; Wöhler, C. Automated metabolic assignment: Semi-supervised learning in metabolic analysis employing two dimensional Nuclear Magnetic Resonance (NMR). Comput. Struct. Biotechnol. J. 2021, 19, 5047–5058.
- Alonso-Salces, R.M.; Gallo, B.; Collado, M.I.; Sasía-Arriba, A.; Viacava, G.E.; García-González, D.L.; Gallina Toschi, T.; Servili, M.; Ángel Berrueta, L. 1H–NMR fingerprinting and supervised pattern recognition to evaluate the stability of virgin olive oil during storage. Food Control 2021, 123, 107831.
- Suppers, A.; Gool, A.J.v.; Wessels, H.J.C.T. Integrated Chemometrics and Statistics to Drive Successful Proteomics Biomarker Discovery. Proteomes 2018, 6, 20.
- Biswas, S.; Bordoloi, M.; Purkayastha, B. Review on Feature Selection and Classification using Neuro-Fuzzy Approaches. Int. J. Appl. Evol. Comput. 2016, 7, 28–44.
- Wieder, C.; Frainay, C.; Poupin, N.; Rodríguez-Mier, P.; Vinson, F.; Cooke, J.; Lai, R.P.; Bundy, J.G.; Jourdan, F.; Ebbels, T. Pathway analysis in metabolomics: Recommendations for the use of over-representation analysis. PLoS Comput. Biol. 2021, 17, e1009105.
- Khatri, P.; Sirota, M.; Butte, A.J. Ten Years of Pathway Analysis: Current Approaches and Outstanding Challenges. PLoS Comput. Biol. 2012, 8, e1002375.
- Marco-Ramell, A.; Palau, M.; Alay, A.; Tulipani, S.; Urpi-Sarda, M.; Sánchez-Pla, A.; Andres-Lacueva, C. Evaluation and comparison of bioinformatic tools for the enrichment analysis of metabolomics data. BMC Bioinform. 2018, 19, 1.
- Karnovsky, A.; Li, S. Pathway Analysis for Targeted and Untargeted Metabolomics. Methods Mol. Biol. 2020, 2104, 387–400.
- Nguyen, T.M.; Shafi, A.; Nguyen, T.; Draghici, S. Identifying significantly impacted pathways: A comprehensive review and assessment. Genome Biol. 2019, 20, 203.
- García-Campos, M.A.; Espinal-Enríquez, J.; Hernández-Lemus, E. Pathway Analysis: State of the Art. Front. Physiol. 2015, 6, 383.
- Liu, Y.; Xu, X.; Deng, L.; Cheng, K.K.; Xu, J.; Raftery, D.; Dong, J. A Novel Network Modelling for Metabolite Set Analysis: A Case Study on CRC Metabolomics. IEEE Access 2020, 8, 106425–106436.
- Mitrea, C.; Taghavi, Z.; Bokanizad, B.; Hanoudi, S.; Tagett, R.; Donato, M.; Voichita, C.; Draghici, S. Methods and approaches in the topology-based analysis of biological pathways. Front. Physiol. 2013, 4, 278.
- Ihnatova, I.; Popovici, V.; Budinska, E. A critical comparison of topology-based pathway analysis methods. PLoS ONE 2018, 13, e0191154.
- Ma, J.; Shojaie, A.; Michailidis, G. A comparative study of topology-based pathway enrichment analysis methods. BMC Bioinform. 2019, 20, 546.
- Chagoyen, M.; Pazos, F. Tools for the functional interpretation of metabolomic experiments. Brief. Bioinform. 2012, 14, 737–744.
- Huang, D.W.; Sherman, B.T.; Lempicki, R.A. Bioinformatics enrichment tools: Paths toward the comprehensive functional analysis of large gene lists. Nucleic Acids Res. 2008, 37, 1–13.
- Emwas, A.H.M. The Strengths and Weaknesses of NMR Spectroscopy and Mass Spectrometry with Particular Focus on Metabolomics Research. In Methods in Molecular Biology; Springer: New York, NY, USA, 2015; pp. 161–193.
- Pavlidis, P.; Qin, J.; Arango, V.; Mann, J.J.; Sibille, E. Using the Gene Ontology for Microarray Data Mining: A Comparison of Methods and Application to Age Effects in Human Prefrontal Cortex. Neurochem. Res. 2004, 29, 1213–1222.
- Al-Shahrour, F.; Díaz-Uriarte, R.; Dopazo, J. Discovering molecular functions significantly related to phenotypes by combining gene expression data and biological information. Bioinformatics 2005, 21, 2988–2993.
- Goeman, J.J.; van de Geer, S.A.; de Kort, F.; van Houwelingen, H.C. A global test for groups of genes: Testing association with a clinical outcome. Bioinformatics 2004, 20, 93–99.
- Subramanian, A.; Tamayo, P.; Mootha, V.K.; Mukherjee, S.; Ebert, B.L.; Gillette, M.A.; Paulovich, A.; Pomeroy, S.L.; Golub, T.R.; Lander, E.S.; et al. Gene set enrichment analysis: A knowledge-based approach for interpreting genome-wide expression profiles. Proc. Natl. Acad. Sci. USA 2005, 102, 15545–15550.
- Tian, L.; Greenberg, S.A.; Kong, S.W.; Altschuler, J.; Kohane, I.S.; Park, P.J. Discovering statistically significant pathways in expression profiling studies. Proc. Natl. Acad. Sci. USA 2005, 102, 13544–13549.
- Kim, S.Y.; Volsky, D.J. PAGE: Parametric Analysis of Gene Set Enrichment. BMC Bioinform. 2005, 6, 144.
- Jiang, Z.; Gentleman, R. Extensions to gene set enrichment. Bioinformatics 2006, 23, 306–313.
- Kong, S.W.; Pu, W.T.; Park, P.J. A multivariate approach for integrating genome-wide expression data and biological knowledge. Bioinformatics 2006, 22, 2373–2380.
- Barry, W.T.; Nobel, A.B.; Wright, F.A. Significance analysis of functional categories in gene expression studies: A structured permutation approach. Bioinformatics 2005, 21, 1943–1949.
- Efron, B.; Tibshirani, R. On testing the significance of sets of genes. Ann. Appl. Stat. 2007, 1, 107–129.
- Glazko, G.V.; Emmert-Streib, F. Unite and conquer: Univariate and multivariate approaches for finding differentially expressed gene sets. Bioinformatics 2009, 25, 2348–2354.
- Koza, J.R.; Mydlowec, W.; Lanza, G.; Yu, J.; Keane, M.A. Reverse Engineering of Metabolic Pathways From Observed Data Using Genetic Programming. Pac. Symp. Biocomput. 2001, 434–445.
- Schmidt, M.D.; Vallabhajosyula, R.R.; Jenkins, J.W.; Hood, J.E.; Soni, A.S.; Wikswo, J.P.; Lipson, H. Automated refinement and inference of analytical models for metabolic networks. Phys. Biol. 2011, 8, 055011.
- Qi, Q.; Li, J.; Cheng, J. Reconstruction of metabolic pathways by combining probabilistic graphical model-based and knowledge-based methods. BMC Proc. 2014, 8, S5.
- Hu, J.M.; Sun, H.T. Serum proton NMR metabolomics analysis of human lung cancer following microwave ablation. Radiat. Oncol. 2018, 13, 40.
- Xia, J.; Wishart, D.S. Web-based inference of biological patterns, functions and pathways from metabolomic data using MetaboAnalyst. Nat. Protoc. 2011, 6, 743–760.
More
Information
Subjects:
Physics, Applied
Contributors
MDPI registered users' name will be linked to their SciProfiles pages. To register with us, please refer to https://encyclopedia.pub/register
:
View Times:
1.4K
Entry Collection:
Nuclear Magnetic Resonance
Revisions:
3 times
(View History)
Update Date:
09 May 2022
Table of Contents


Notice
You are not a member of the advisory board for this topic. If you want to update advisory board member profile, please contact office@encyclopedia.pub.
OK
Confirm
Only members of the Encyclopedia advisory board for this topic are allowed to note entries. Would you like to become an advisory board member of the Encyclopedia?
Yes
No
${ textCharacter }/${ maxCharacter }
Submit
Cancel
Back
Comments
${ item }
|
${ item.createdUser.fullName }
${ item.createdAt }
${ item.vote }
${ item.reply }
Delete
${ reply.createdUser.fullName }
${ reply.createdAt }
${ reply.vote }
Delete
There is no reply to this comment~
${ item.replyTextCharacter }/${ item.replyMaxCharacter }
Submit
Cancel
More
No more~
There is no comment~
${ textCharacter }/${ maxCharacter }
Submit
Cancel
${ selectedItem.replyTextCharacter }/${ selectedItem.replyMaxCharacter }
Submit
Cancel
Confirm
Are you sure to Delete?
Yes
No