 +1 credit
| Version | Summary | Created by | Modification | Content Size | Created at | Operation |
|---|---|---|---|---|---|---|
| 1 | Myriam Hernandez-Alvarez | + 2690 word(s) | 2690 | 2020-09-16 10:12:39 | | | |
| 2 | Vivi Li | -65 word(s) | 2625 | 2020-10-10 05:50:32 | | |
Video Upload Options
This entry gives an overview of available datasets, emotion elicitation methods, feature extraction and selection, classification algorithms, and performance evaluation for emotion recognition using EEG-based BCI systems.
1. Introduction
Affective computing is a branch of artificial intelligence. It is computing that relates to, arises from, or influences emotions [1]. Automatic emotion recognition is an area of study that forms part of affective computing. Research in this area is rapidly evolving thanks to the availability of affordable devices for capturing brain signals, which serve as inputs for systems that decode the relationship between emotions and electroencephalographic (EEG) variations. These devices are called EEG-based brain-computer interfaces (BCIs).
Affective states play an essential role in decision-making. Such states can facilitate or hinder problem-solving. Emotion recognition takes advantage of positive affective states, enhances emotional intelligence, and consequently improves professional and personal success [2]. Moreover, emotion self-awareness can help people manage their mental health and optimize their work performance. Automatic systems can increase our understanding of emotions, and therefore promote effective communication among individuals and human-to-machine information exchanges. Automatic EEG-based emotion recognition could also help enrich people’s relationships with their environment. Besides, automatic emotion recognition will play an essential role in artificial intelligence entities designed for human interaction [3].
2. EEG-Based BCI Systems for Emotion Recognition
Figure 1 presents the structure of an EEG-based BCI system for emotion recognition.
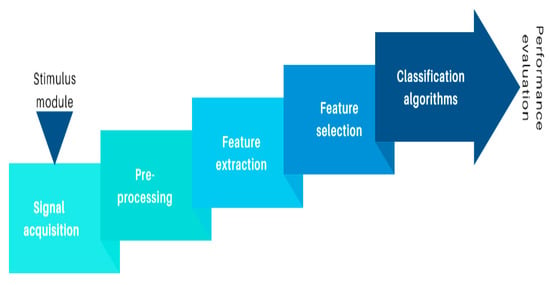
Figure 1. Components of an EEG-based BCI for emotion recognition.
2.1. Signal Acquisition
Inexpensive wearable EEG helmets and headsets that position noninvasive electrodes along the scalp can efficiently acquire EEG signals. The clinical definition of EEG is an electrical signal recording of brain activity over time. Thus, electrodes capture signals, amplify them and send them to a computer (or mobile device) for storage and processing. Currently, there are various low-cost EEG-based BCI devices available on the market [4]. However, many current models of EEG-based BCI become incommodious after continued use. Therefore, it is still necessary to improve their usability.
Public Databases
Alternatively, there are also public databases with EEG data for affective information. Table 1 presents a list of available datasets related to emotion recognition. Such datasets are convenient for research, and several emotion recognition studies use them.
Table 1. Publicly available datasets.
|
Source |
Dataset |
Number of Channels |
Emotion Elicitation |
Number of Participants |
Target Emotions |
|
[5] |
DEAP |
32 EEG channels |
Music videos |
32 |
Valence, arousal, dominance, liking |
|
[6] |
eNTERFACE’06 |
54 EEG channels |
Selected images from IAPS. |
5 |
Calm, positive, exciting, negative exciting |
|
[7] |
headIT |
- |
Recall past emotions |
31 |
Positive valence (joy, happiness) or of negative valence (sadness, anger) |
|
[8] |
SEED |
62 channels |
Film clips |
15 |
Positive, negative, neutral |
|
[9] |
SEED-IV |
62 channels |
72 film clips |
15 |
Happy, sad, neutral, fear |
|
[10] |
Mahnob-HCI-tagging |
32 channels |
Fragments of movies and pictures. |
30 |
Valence and arousal rated with the self-assessment manikin |
|
[11] |
EEG Alpha Waves dataset |
16 channels |
Resting-state eyes open/closed experimental protocol |
20 |
Relaxation |
|
[12] |
DREAMER |
14 channels |
Film clips |
23 |
Rating 1 to 5 to valence, arousal, and dominance |
|
[13] |
RCLS |
64 channels |
Native Chinese Affective Video System
|
14 |
Happy, sad, and neutral |
2.1.2. Emotion Elicitation
The International Affective Picture System (IAPS) [14] and the International Affective Digitized Sound System (IADS) [15] are the most popular resources for emotion elicitation. These datasets provide emotional stimuli in a standardized way. Hence, it is useful for experimental investigations.
IAPS consists of 1200 images divided into 20 sets of 60 photos. Valence and arousal values are tagged for each photograph. IADS’ latest version provides 167 digitally recorded natural sounds familiar in daily life, with sounds labeled for valence, arousal, and dominance. Participants labeled the dataset using the Self-Assessment Manikin system [16]. IAPS and IADS stimuli are accessible with labeled information, which is convenient for the construction of a ground-truth for emotion assessment [17].
Other researchers used movie clips, which have also been shown capable of provoking emotions. In [18], the authors state that emotions using visual or auditory stimuli are similar. However, results obtained through affective labeling of multimedia may not be generalizable to more interactive situations or everyday circumstances. Thus, new studies using interactive emotional stimuli to ensure the generalizability of results for BCI would be welcomed.
Numerous experiments stimulated emotions in different settings, but they do not use EEG devices. However, they collected other physiological indicators like heart rate, skin galvanic changes, and respiration rate, among others. Conceptually, such paradigms could be useful if they are replicated for EEG signal acquisition. Possible experiments include stress during interviews for the detection of anger, anxiety, rejection, and depression. Exposure to odorants triggers emotions, such as anger, disgust, fear, happiness, sadness, and surprise. Harassment provokes fear. A threat of short-circuit or a sudden backward-tilting chair elicits fear. A thread of shock provokes anxiety. Naturally, these EEG-based BCIs experiments should take into account ethical considerations.
To our knowledge, only a few studies have used more interactive conditions where participants played games or used flight simulators to induce emotions [19][20]. Alternatively, some authors have successfully used auto-induced emotions through memory recall [21].
2.2. Preprocessing
EEG signals’ preprocessing relates to signal cleaning and enhancement. EEG signals are weak and easily contaminated with noise from internal and external sources. Thus, these processes are essential to avoid noise contamination that could affect posterior classification. The body itself may produce electrical impulses through blinking, eye or muscular movement, or even heartbeats that blend with EEG signals. It should be carefully considered whether these artifacts should be removed because they may have relevant emotional state information and could improve emotion recognition algorithms’ performance. If filters are used, it is necessary to use caution to apply them to avoid signal distortions.
The three commonly used filter types in EEG are (1) low-frequency filters, (2) high-frequency filters (commonly known by electrical engineers as low-pass and high-pass filters), and (3) notch filters. The first two filters are used to filter frequencies between 1 and 50–60 Hz.
For EEG signal processing, filters, such as Butterworth, Chebyshev, or inverse Chebyshev, are preferred [22]. Each of them has specific features that need to be analyzed. A Butterworth filter has a flat response in the passband and the stopband but also has a wide transition zone. The Chebyshev filter has a ripple on the passband, and a steeper transition, so it is monotonic on the stopband. The inverse Chevishev has a flat response in the passband, is narrow in the transition, and has a ripple in the stopband. A Butterworth phase zero filter should be used to prevent a phase shift because this filter goes forward and backward over the signal to avoid this problem.
According to [23], emotions emerge as the synchronization of various subsystems. Several authors use synchronized activity indexes in different parts of the brain. The efficiency of these indexes has been demonstrated in [24], calculating the correlation dimension of a group of EEG signals. In [24], other methods were used to calculate the synchronization of different areas of the brain. Synchronized indexes are a promising method for emotion recognition that deserves further research.
2.4. Feature Selection
The feature selection process is vital because it obtains the signal’s properties that best describe the EEG characteristics to be classified. In BCI systems, the feature vector generally has high dimensionality [25]. Feature selection reduces the number of input variables for the classifier (not to be confused with dimensionality reduction). While both processes decrease the data’s attributes, dimensionality reduction combines features to reduce their quantity.
A feature selection method does not change characteristics but excludes some according to specific usefulness criteria. Feature selection methods aim to achieve the best results by processing the least amount of data. It serves to remove attributes that do not contribute to the classification because they are irrelevant (or redundant) for simpler classification models (which are faster and have better performance). Additionally, feature selection methods reduce the overfitting likelihood in regular datasets, flexible models, or when the dataset has too many features but not enough observations.
2.5. Classification Algorithms
Model frameworks can categorize classification algorithms [26][27]. The model’s categories may be (1) generative-discriminative, (2) static-dynamic, (3) stable-unstable, and (4) regularized [28][29][30].
There are two different selection approaches for the classifier that works best under certain conditions in emotion recognition [26]. The first identifies the best classifier for a given BCI device. The second specifies the best classifier for a given set of features.
For synchronous BCIs, dynamic classifiers and ensemble combinations have shown better performances than SVMs. For asynchronous BCIs, the authors in this field have not determined an optimal classifier. However, it seems that dynamic classifiers perform better than static classifiers [26] because they handle better the identification of the onset of mental processes.
From the second approach, discriminative classifiers have been found to perform better than generative classifiers, principally in the presence of noise or outliers. Dynamic classifiers like SVM generally handle high dimensionality in the features better. If there is a small training set, simple techniques like LDA classifiers may yield satisfactory results [31].
2.6. Performance Evaluation
Results must be reported consistently so that different research groups can understand and compare them. Hence, evaluation procedures need to be chosen and described accurately [32]. The evaluation of the classifier’s execution involves addressing performance measures, error estimation, and statistical significance testing [33]. Performance measures and error estimation configure the fulfillment rate of the classifier’s function. The most recommended performance evaluation measures are shown in Table 2. They are confusion matrix, accuracy, error rating, and other measures obtained from the confusion matrix, such as the recall, specificity, precision, Area Under the Curve (AUC), and F-measure. Other performance evaluation coefficients are Cohen’s kappa (k) [34], information transfer rate (ITR) [35], and written symbol rate (WSR) [34].
Table 2. Conventional performance evaluation methods for BCI.
| Performance Evaluation | Main characteristics | Advantages | Limitations |
|---|---|---|---|
| Confusion matrix | The confusion matrix presents the number of correct and erroneous classifications specifying the erroneously categorized class. | The confusion matrix gives insights into the classifier’s error types (correct and incorrect predictions for each class). It is a good option for reporting results in M-class classification. |
Results are difficult to compare and discuss. Instead, some authors use some parameters extracted from the confusion matrix. |
| Accuracy and error rate | The accuracy p is the probability of correct classification in a certain number of repeated measures. The error rate is e = 1 − p and corresponds to the probability that an incorrect classification has been made. |
It works well if the classes are balanced, i.e., there are an equal number of samples belonging to each class. | Accuracy and error rate do not take into account whether the dataset is balanced or not. If one class occurs more than another, the evaluation may appear with a high value for accuracy even though the classification is not performing well. These parameters depend on the number of classes and the number of cases. In a 2-class problem the chance level is 50%, but with a confidence level depending on the number of cases. |
| Cohen’s kappa (k) | k is agreement evaluation between nominal scales. This index measures the agreement between a true class compared to a classifier output. 1 is a perfect agreement, and 0 is pure chance agreement. | Cohen’s kappa returns the theoretical chance level of a classifier. This index evaluates the classifier realistically. If k has a low value, the confusion matrix would not have a meaningful classification even with high accuracy values. This coefficient presents more information than simple percentages because it uses the entire confusion matrix. |
This coefficient has to be interpreted appropriately. It is necessary to report the bias and prevalence of the k value and test the significance for a minimum acceptable level of agreement. |
| Sensitivity or Recall | Sensitivity, also called Recall, identifies the true positive rate for describing the accuracy of classification results. It evaluates the proportion of correctly identified true positives related to the sum of true positives plus false negatives. | Sensitivity measures how often a classifier correctly categorizes a positive result. | The Recall should not be used when the positive class is larger (imbalanced dataset), and correct detection of positives samples is less critical to the problem. |
| Specificity | Specificity is the ability to identify a true negative rate. It measures the proportion of correctly identified true negatives over the sum of the true negatives plus false positives. The False Positive Rate (FPR) is then equal to 1 – Specificity. |
Specificity measures how often a classifier correctly categorizes a negative result. | Specificity focuses on one class only, and the majority class biases it. |
| Precision | Precision also referred to as Positive Predicted Value, is calculated as 1 – False Detection Rate (F). False detection rate is the ratio between false positives over the sum of true positives plus false positives. |
Precision measures the fraction of correct classifications. | Precision should not be used when the positive class is larger (imbalanced dataset), and correct detection of positives samples is less critical to the problem. |
| ROC | The ROC curve is a Sensitivity plot as a function of the False Positive Rate. The area under the ROC curve is a measure of how well a parameter can distinguish between a true positive and a true negative. | ROC curve provides a measure of the classifier performance across different significance levels. | ROC is not recommended when the negative class is smaller but more important. The Precision and Recall will mostly reflect the ability to predict the positive class if it is larger in an imbalanced dataset. |
| F-Measure | F-Measure is the harmonic mean of Precision and Recall. It is useful because as the Precision increases, Recall decreases, and vice versa. | F-measure can handle imbalanced data. F-measure (like ROC and kappa) provides a measure of the classifier performance across different significance levels. | F-measure does not generally take into account true negatives. True negatives can change without affecting the F-measure. |
| Pearson correlation coefficient | Pearson’s correlation coefficient (r), quantifies the degree of a ratio between the true and predicted values by a value ranking from −1 to +1. | Pearson’s correlation is a valid way to measure the performance of a regression algorithm. | Pearson’s correlation ignores any bias which might exist between the true and the predicted values. |
| Information transfer rate (ITR) | As BCI is a channel from the brain to a device, it is possible to estimate the bits transmitted from the brain. ITR is a standard metric for measuring the information sent within a given time in bits per second. | ITR is a metric that contributes to criteria to evaluate a BCI System. | ITR is often misreported due to inadequate understanding of many considerations as delays are necessary to process data, to present feedback, and clear the screen. TR is best suited for synchronous BCIs over user-paced BCI. |
Performance evaluation and error estimation may need to be complemented with a significance evaluation. This is because high accuracies can be of little impact if the sample size is too small, or classes are imbalanced (labeled EEG signals typically are). Therefore, significance classification is essential. There are general approaches that can handle arbitrary class distributions to verify accuracy values that lie significantly above certain levels. Used methods are the theoretical level of random classification and adjusted Wald confidence interval for classification accuracy.
The theoretical level of random classification test classification results for randomness is the sum of the products between the experimental results’ classification probability and the probability calculated if all the categorization randomly occurs (p0 = classification accuracy of a random classifier). This approach can only be used after the classification has been performed [36].
Adjusted Wald confidence interval gives the lower and upper confidence limits for the probability of the correct classification, which specifies the intervals for the classifier performance evaluation index [37].
3. Conclusions
EEG signals are reliable information that cannot be simulated or faked. To decode EEG and relate these signals to specific emotion is a complex problem. Affective states do not have a simple mapping with specific brain structures because different emotions activate the same brain locations, or conversely, a single emotion can activate several structures.
In recent years, EEG-based BCI emotion recognition has been a field affecting computing that has generated much interest. Significant advances in the development of low-cost BCI devices with increasingly better usability have encouraged numerous research studies.
References
- Picard, R.W. Affective Computing for HCI. In Proceedings of the HCI International 1999-Proceedings of the 8th International Conference on Human-Computer Interaction, Munich, Germany, 22–26 August 1999.
- Elfenbein, H.A.; Ambady, N. Predicting workplace outcomes from the ability to eavesdrop on feelings. J. Appl. Psychol. 2002, 87, 963–971.
- Goenaga, S.; Navarro, L.; Quintero, C.G.M.; Pardo, M. Imitating human emotions with a nao robot as interviewer playing the role of vocational tutor. Electronics 2020, 9, 971.
- Peterson, V.; Galván, C.; Hernández, H.; Spies, R. A feasibility study of a complete low-cost consumer-grade brain-computer interface system. Heliyon 2020, 6.
- Hyvarinen, A. New Approximations of differential entropy for independent component analysis and projection pursuit. In Proceedings of the Advances in Neural Information Processing Systems, Denver, CO, USA; 1998; pp. 273–279.
- Savran, A.; Ciftci, K.; Chanel, G.; Mota, J.C.; Viet, L.H.; Sankur, B.; Akarun, L.; Caplier, A.; Rombaut, M. Emotion detection in the loop from brain signals and facial images. eNTERFACE 2006, 6, 69–80.
- Onton, J.; Makeig, S. High-frequency broadband modulations of electroencephalographic spectra. Front. Hum. Neurosci. 2009, 3, 1–18.
- Yadava, M.; Kumar, P.; Saini, R.; Roy, P.P.; Prosad Dogra, D. Analysis of EEG signals and its application to neuromarketing. Multimed. Tools Appl. 2017, 76, 19087–19111.
- Zheng, W.L.; Liu, W.; Lu, Y.; Lu, B.L.; Cichocki, A. EmotionMeter: A Multimodal framework for recognizing human emotions. IEEE Trans. Cybern. 2019, 49, 1110–1122.
- Soleymani, M.; Lichtenauer, J.; Pun, T.; Pantic, M. A multimodal database for affect recognition and implicit tagging. IEEE Trans. Affect. Comput. 2012, 3, 42–55.
- Grégoire, C.; Rodrigues, P.L.C.; Congedo, M. EEG Alpha Waves Dataset; Centre pour la Communication Scientifique Directe: Grenoble, France, 2019.
- Katsigiannis, S.; Ramzan, N. DREAMER: A database for emotion recognition through EEG and ECG signals from wireless low-cost off-the-shelf devices. IEEE J. Biomed. Heal. Informatics 2018, 22, 98–107.
- Li, Y.; Zheng, W.; Cui, Z.; Zong, Y.; Ge, S. EEG emotion recognition based on graph regularized sparse linear regression. Neural Process. Lett. 2019, 49, 555–571.
- Lang, P.J.; Bradley, M.M.; Cuthbert, B.N. International affective picture system (IAPS): Technical manual and affective ratings. NIMH Cent. Study Emot. Atten. 1997, 1, 39–58.
- Yang, W.; Makita, K.; Nakao, T.; Kanayama, N.; Machizawa, M.G.; Sasaoka, T.; Sugata, A.; Kobayashi, R.; Hiramoto, R.; Yamawaki, S.; et al. Affective auditory stimulus database: An expanded version of the International Affective Digitized Sounds (IADS-E). Behav. Res. Methods 2018, 50, 1415–1429.
- Bradley, M.M.; Lang, P.J. Measuring emotion: The self-assessment manikin and the semantic differential. J. Behav. Ther. Exp. Psychiatry 1994, 25, 49–59.
- Mühl, C.; Allison, B.; Nijholt, A.; Chanel, G. A survey of affective brain computer interfaces: Principles, state-of-the-art, and challenges. Brain Comput. Interfaces 2014, 1, 66–84.
- Zhou, F.; Qu, X.; Jiao, J.; Helander, M.G. Emotion prediction from physiological signals: A comparison study between visual and auditory elicitors. Interact. Comput. 2014, 26, 285–302.
- Pallavicini, F.; Ferrari, A.; Pepe, A.; Garcea, G. Effectiveness of virtual reality survival horror games for the emotional elicitation: Preliminary insights using Resident Evil 7: Biohazard. In International Conference on Universal Access in Human-Computer Interaction; Springer: Cham, Switzerland, 2018.
- Roza, V.C.C.; Postolache, O.A. Multimodal approach for emotion recognition based on simulated flight experiments. Sensors 2019, 19, 5516.
- Iacoviello, D.; Petracca, A.; Spezialetti, M.; Placidi, G. A real-time classification algorithm for EEG-based BCI driven by self-induced emotions. Comput. Methods Programs Biomed. 2015, 122, 293–303.
- Bustamante, P.A.; Lopez Celani, N.M.; Perez, M.E.; Quintero Montoya, O.L. Recognition and regionalization of emotions in the arousal-valence plane. In Proceedings of the 2015 Milano, Italy 37th Annual International Conference of the IEEE Engineering in Medicine and Biology Society (EMBC), Milano, Italy, 25–29 August 2015; Volume 2015, pp. 6042–6045.
- Sander, D.; Grandjean, D.; Scherer, K.R. A systems approach to appraisal mechanisms in emotion. Neural Netw. 2005, 18, 317–352.
- Chanel, G.; Kierkels, J.J.M.; Soleymani, M.; Pun, T. Short-term emotion assessment in a recall paradigm. Int. J. Hum. Comput. Stud. 2009, 67, 607–627.
- Lotte, F.; Congedo, M.; Lécuyer, A.; Lamarche, F.; Arnaldi, B.; Anatole, L.; Lotte, F.; Congedo, M.; Anatole, L.; Abdulhay, E.; et al. A review of classification algorithms for EEG-based brain–Computer interfaces To cite this version: A review of classification algorithms for EEG-based brain-computer interfaces. Hum. Brain Mapp. 2018, 38, 270–278.
- Li, X.; Fan, H.; Wang, H.; Wang, L. Common spatial patterns combined with phase synchronization information for classification of EEG signals. Biomed. Signal Process. Control 2019, 52, 248–256.
- Interfaces, B. A Tutorial on EEG signal processing techniques for mental state recognition in brain-computer interfaces. Guid. Brain Comput. Music Interfacing 2014.
- Zhang, L.; Xiong, G.; Liu, H.; Zou, H.; Guo, W. Time-frequency representation based on time-varying autoregressive model with applications to non-stationary rotor vibration analysis. Sadhana Acad. Proc. Eng. Sci. 2010, 35, 215–232.
- Hill, N.J.; Wolpaw, J.R. Brain–Computer Interface. In Reference Module in Biomedical Sciences; Elsevier: Amsterdam, The Netherlands, 2016.
- Rashid, M.; Sulaiman, N.P.P.; Abdul Majeed, A.; Musa, R.M.; Ab. Nasir, A.F.; Bari, B.S.; Khatun, S. Current Status, Challenges, and Possible Solutions of EEG-Based Brain-Computer Interface: A Comprehensive Review. Front. Neurorobot. 2020, 14.
- Jenke, R.; Peer, A.; Buss, M. Feature extraction and selection for emotion recognition from EEG. IEEE Trans. Affect. Comput. 2014, 5, 327–339.
- Ilyas, M.Z.; Saad, P.; Ahmad, M.I. A survey of analysis and classification of EEG signals for brain-computer interfaces. In Proceedings of the 2015 2nd International Conference on Biomedical Engineering (ICoBE), Penang, Malaysia, 30–31 March 2015; pp. 30–31.
- Japkowicz, N.; Shah, M. Evaluating Learning Algorithms; Cambridge University Press: Cambridge, UK, 2011; ISBN 9780511921803.
- Biological and medical physics, biomedical engineering. In Towards Practical Brain-Computer Interfaces; Allison, B.Z.; Dunne, S.; Leeb, R.; Del R. Millán, J.; Nijholt, A. (Eds.) Springer: Berlin/Heidelberg, Germany, 2013; ISBN 978-3-642-29745-8.
- Zhang, Y.; Zhou, G.; Zhao, Q.; Jin, J.; Wang, X.; Cichocki, A. Spatial-temporal discriminant analysis for ERP-based brain-computer interface. IEEE Trans. Neural Syst. Rehabil. Eng. 2013, 21, 233–243.
- Combrisson, E.; Jerbi, K. Exceeding chance level by chance: The caveat of theoretical chance levels in brain signal classification and statistical assessment of decoding accuracy. J. Neurosci. Methods 2015, 250, 126–136.
- Bonett, D.G.; Price, R.M. Adjusted Wald Confidence Interval for a Difference of Binomial Proportions Based on Paired Data. J. Educ. Behav. Stat. 2012, 37, 479–488.

