Your browser does not fully support modern features. Please upgrade for a smoother experience.
Submitted Successfully!
 +1 credit
Thank you for your contribution! You can also upload a video entry or images related to this topic.
For video creation, please contact our Academic Video Service.
| Version | Summary | Created by | Modification | Content Size | Created at | Operation |
|---|---|---|---|---|---|---|
| 1 | Yunfeng Wu | -- | 3054 | 2022-04-29 17:21:49 | | | |
| 2 | Conner Chen | -35 word(s) | 3019 | 2022-05-05 03:43:44 | | | | |
| 3 | Conner Chen | Meta information modification | 3019 | 2022-05-05 04:05:45 | | | | |
| 4 | Conner Chen | -49 word(s) | 2970 | 2022-05-07 07:39:07 | | |
Video Upload Options
We provide professional Academic Video Service to translate complex research into visually appealing presentations. Would you like to try it?
Cite
If you have any further questions, please contact Encyclopedia Editorial Office.
Wu, Y.; Lin, M.; Guidong Bao, G.B.; , . Deep Learning Applications for Optical Coherence Tomography. Encyclopedia. Available online: https://encyclopedia.pub/entry/22515 (accessed on 01 August 2026).
Wu Y, Lin M, Guidong Bao GB, . Deep Learning Applications for Optical Coherence Tomography. Encyclopedia. Available at: https://encyclopedia.pub/entry/22515. Accessed August 01, 2026.
Wu, Yunfeng, Mengchen Lin, Guidong Bao Guidong Bao, . "Deep Learning Applications for Optical Coherence Tomography" Encyclopedia, https://encyclopedia.pub/entry/22515 (accessed August 01, 2026).
Wu, Y., Lin, M., Guidong Bao, G.B., & , . (2022, April 29). Deep Learning Applications for Optical Coherence Tomography. In Encyclopedia. https://encyclopedia.pub/entry/22515
Wu, Yunfeng, et al. "Deep Learning Applications for Optical Coherence Tomography." Encyclopedia. Web. 29 April, 2022.
Copy Citation
With non-invasive and high-resolution properties, optical coherence tomography (OCT) has been widely used as a retinal imaging modality for the effective diagnosis of ophthalmic diseases. The retinal fluid is often segmented by medical experts as a pivotal biomarker to assist in the clinical diagnosis of age-related macular diseases, diabetic macular edema, and retinal vein occlusion. In recent years, the advanced machine learning methods, such as deep learning paradigms, have attracted more and more attention from academia in the retinal fluid segmentation applications. The automatic retinal fluid segmentation based on deep learning can improve the semantic segmentation accuracy and efficiency of macular change analysis, which has potential clinical implications for ophthalmic pathology detection.
optical coherence tomography
machine learning
neural networks
retinal fluid segmentation
ophthalmic diseases
1. Introduction
The human eyes are important organs that can sense light and provide a function of binocular color vision. With the growth of human age and the influence of external factors, the eyes are susceptible to a few retinal fluid disorders. Retinal fluid mainly contains intraretinal fluid (IRF), subretinal fluid (SRF), and pigment epithelial detachment (PED). These areas are vital biomarkers related to the diseases of age-related macular degeneration (AMD) and retinal vein occlusion (RVO). The retinal fluid occupation area can be detected and segmented from the medical images, which are considered to be useful for the distinguishing the retinal pathology.
Optical coherence tomography (OCT) is one of the most widely used medical imaging technologies, which has been rapidly developing in the past three decades. Such an imaging technique was first proposed by Huang et al. [1] in 1991. The OCT technique utilizes the basic principle of the low coherent light interferometer to detect the backscattered near-infrared light and reconstruct the depth profile of the biological tissue sample. Its penetration depth is hardly limited by the transparent refractive medium of the eye. Furthermore, the OCT technique can identify the anterior segment and display the morphological structure of the posterior segment. The OCT modality is a good choice for cross-sectional imaging of the retina because its high resolution facilitates a clear visualization of retinal structures. From the images of the retinal structure obtained by the OCT modality, the fluid area can be visualized with different reflectivity measures from the surrounding tissues. The OCT image processing and analysis may help distinguish various conditions of retinal fluids and evaluate the progression of retina pathology. It has a brilliant prospect in the applications of retinal pathology diagnosis, follow-up observation, and treatment effect evaluation of intraocular diseases. Some typical segmentations of OCT images are shown in Figure 1.
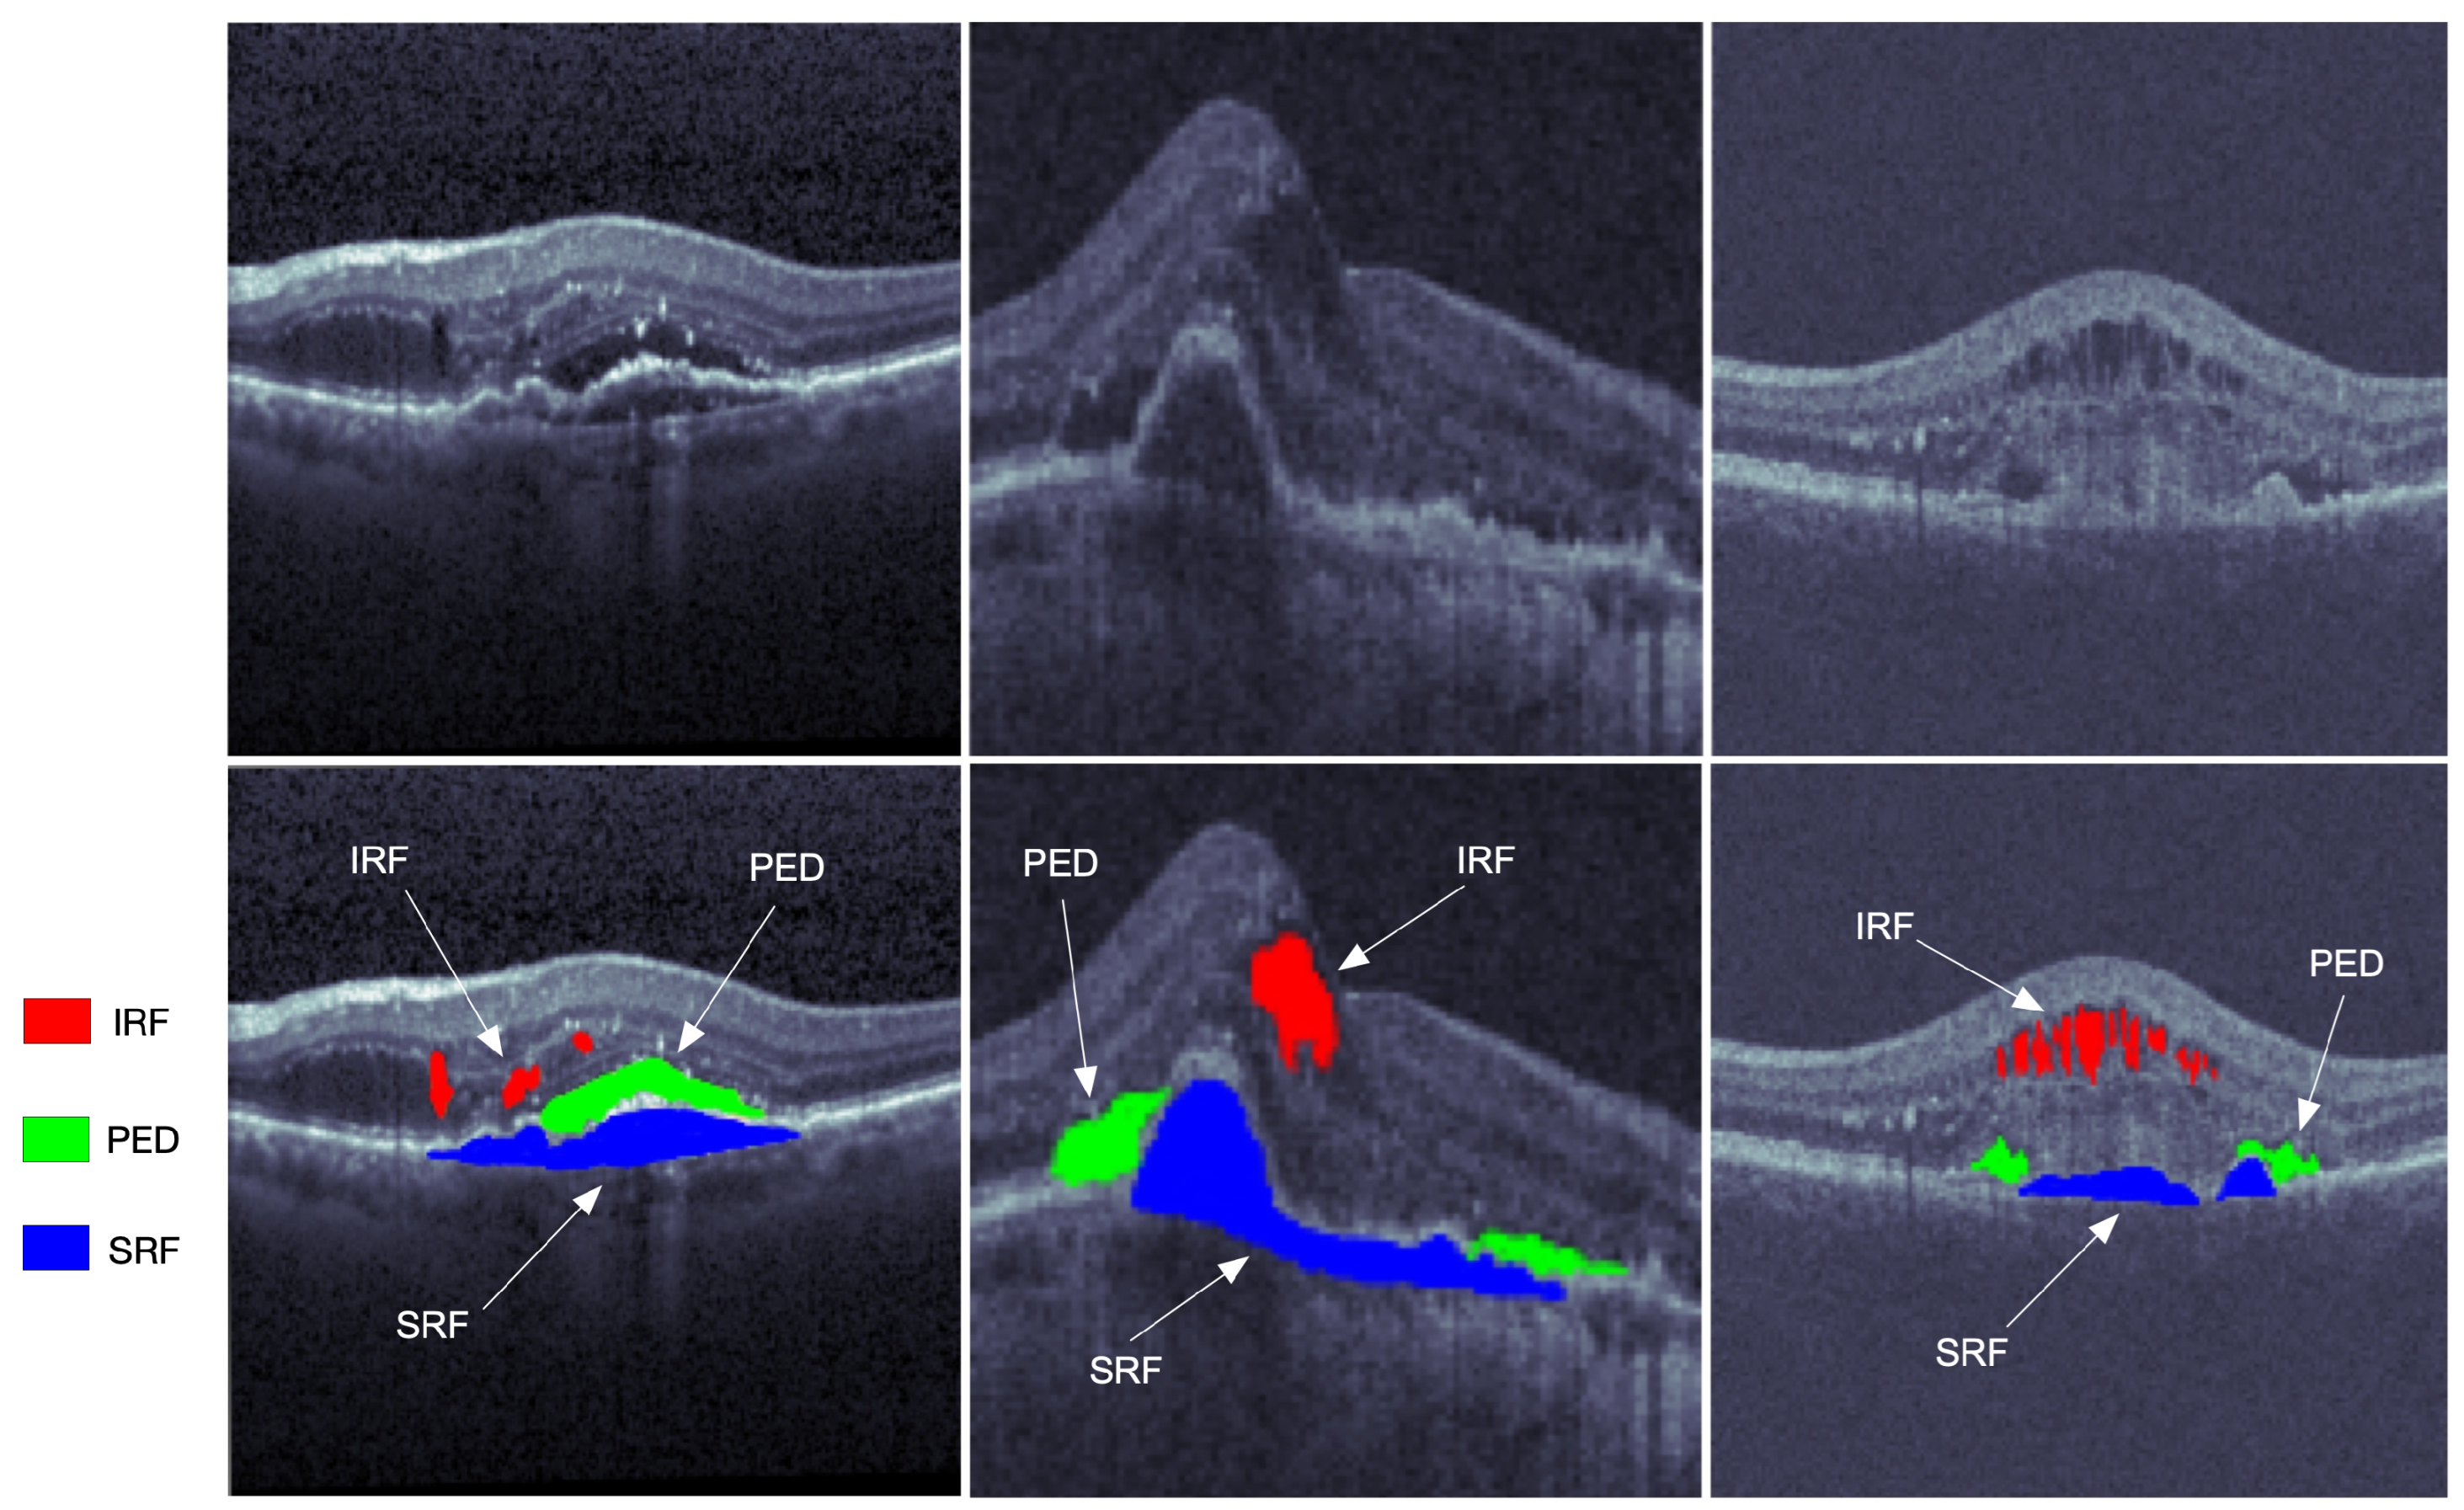
Figure 1. The OCT retinal images from left to right are from the three vendors of Cirrus, Spectralis, and Topcon in the RETOUCH dataset [2]. The images in the first row are not manually labeled, while the red, blue, and green segmentations on the second row represent the intraretinal fluid (IRF), subretinal fluid (SRF), and epithelial detachment (PED), respectively.
Primarily located in the inner and outer nuclear layers, the IRF is regarded as separated hyporeflective cystoid pockets that could increase the overall retinal thickness. The IRF is one of the important variables of vision loss. The SRF is a hyporeflective space that corresponds to the clear or lipid-rich exudate between the neurosensory retina and the retinal pigment epithelium (RPE). The SRF is related to the AMD, and would cause the retinal detachment. As one of the main indicators of progressive disease, the PED is the separation of RPE from the Bruch’s membrane (BM), which can be subdivided into the serous, fibrovascular, and drusenoid.
With the rapid development of high-performance computer hardware and sufficient large datasets, the computer vision and deep learning methods have been dramatically improved and evolved during recent years. In comparison with the traditional neural network methods, deep learning network architectures normally contain many more hidden layers that have powerful scalability and hierarchical feature learning capability to automatically extract the morphological features from raw image data. Since 2016, the deep learning algorithms have made significant impacts on the retinal fluid segmentation based on OCT images. The most popular deep learning frameworks for the segmentation of retinal fluids include the convolutional neural network (CNN), fully convolutional network (FCN), U-shape network (U-Net), and hybrid computational methods. The major strategy of the deep learning is to identify the contours of retinal fluids, and then commonly solve a classification problem with the semantic context extracted from the OCT images.
2. Deep Learning Applications for OCT Image Segmentation
Image segmentation is one of the research fields of computer vision. Segmentation is the process of combining the objects of interests in multiple groups in accordance with the join features in an image. Semantic segmentation and instance segmentation are the two main types of image segmentations. The semantic segmentation categorizes the objects with the same class label into a unique semantic entity, for example, grouping all humans into one class and all animals into another class. On the other hand, the instance segmentation distinguishes all instances of the same object into different classes, i.e., even some similar objects could also be marked with different labels. As illustrated in Figure 2, the semantic segmentation approach categorizes all of the retinal fluid into one class, meanwhile the instance segmentation method separates the retinal fluid as the SRF, IRF, and PED, respectively. Image segmentation can quickly locate a variety of abnormalities in medical images, such as locating pulse tumors [3] and melanoma detection [4]. It can also extract the content of interest in medical images, such as segmentations of retinal blood vessels [5] and the retinal fluids.
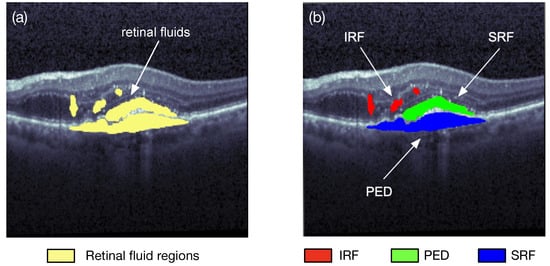
Figure 2. Two different types of retinal fluid segmentation on the same optical coherence tomography (OCT) image from the RETOUCH dataset [2]. (a) Semantic segmentation: all of the retinal fluids are segmented into yellow regions; (b) instance segmentation: the IRF (red), SRF (green), and PED (blue) are segmented separately.
The most frequently used traditional imaging processing methods for retinal fluid segmentation include edge-based detection, threshold-based segmentation, and histogram-based segmentation. The edge detection method typically uses the maximum value of the first derivative of the pixels or the zero-crossing information of the second derivative to separate the boundaries of different regions. Both of the threshold-based segmentation and histogram-based segmentation utilize the grayscale features of the image to distinguish the object content from the background. The major drawback of these traditional image segmentation methods is that the different segmentation tasks would require well-devised algorithm, and sometimes the spatial information of images cannot be effectively utilized. The emerging deep learning methods have the advantages of automatically combining the low-level features of images to form more abstract high-level features, and providing higher segmentation accuracy. The following subsections provide a brief description of the popular deep learning neural network architectures for the OCT image segmentation applications.
2.1. Fully Convolutional Networks (FCNs)
The FCN paradigm was proposed by Shelhamer et al. [6] in 2017. The ordinary CNN uses the last of a few fully connected layers to transform the two-dimensional image matrix into one dimension to produce the class labels, or to make object localizations via regression. The major difference between FCN and CNN is their output layers. The FCN uses a fully CNN with some transposed convolutional layers to transform the height and width of intermediate feature maps back to those of the input image. The FCN produces the classification outputs in correspondence with the input image at pixel level, i.e., the channel dimension at each output pixel holds the classification results for the input pixel at the same spatial position [6]. Therefore, FCN’s symmetrical encoder–decoder structure allows the network to process input images of arbitrary sizes.
As shown in Figure 3, the FCN is composed of the encoder and decoder structures. The encoder is responsible for mapping an input image to the high-dimensional feature representation. On the contrary, the decoder uses the transposed convolution to upsample the feature maps, and restores them to the size of the input image when preserving the spatial information.
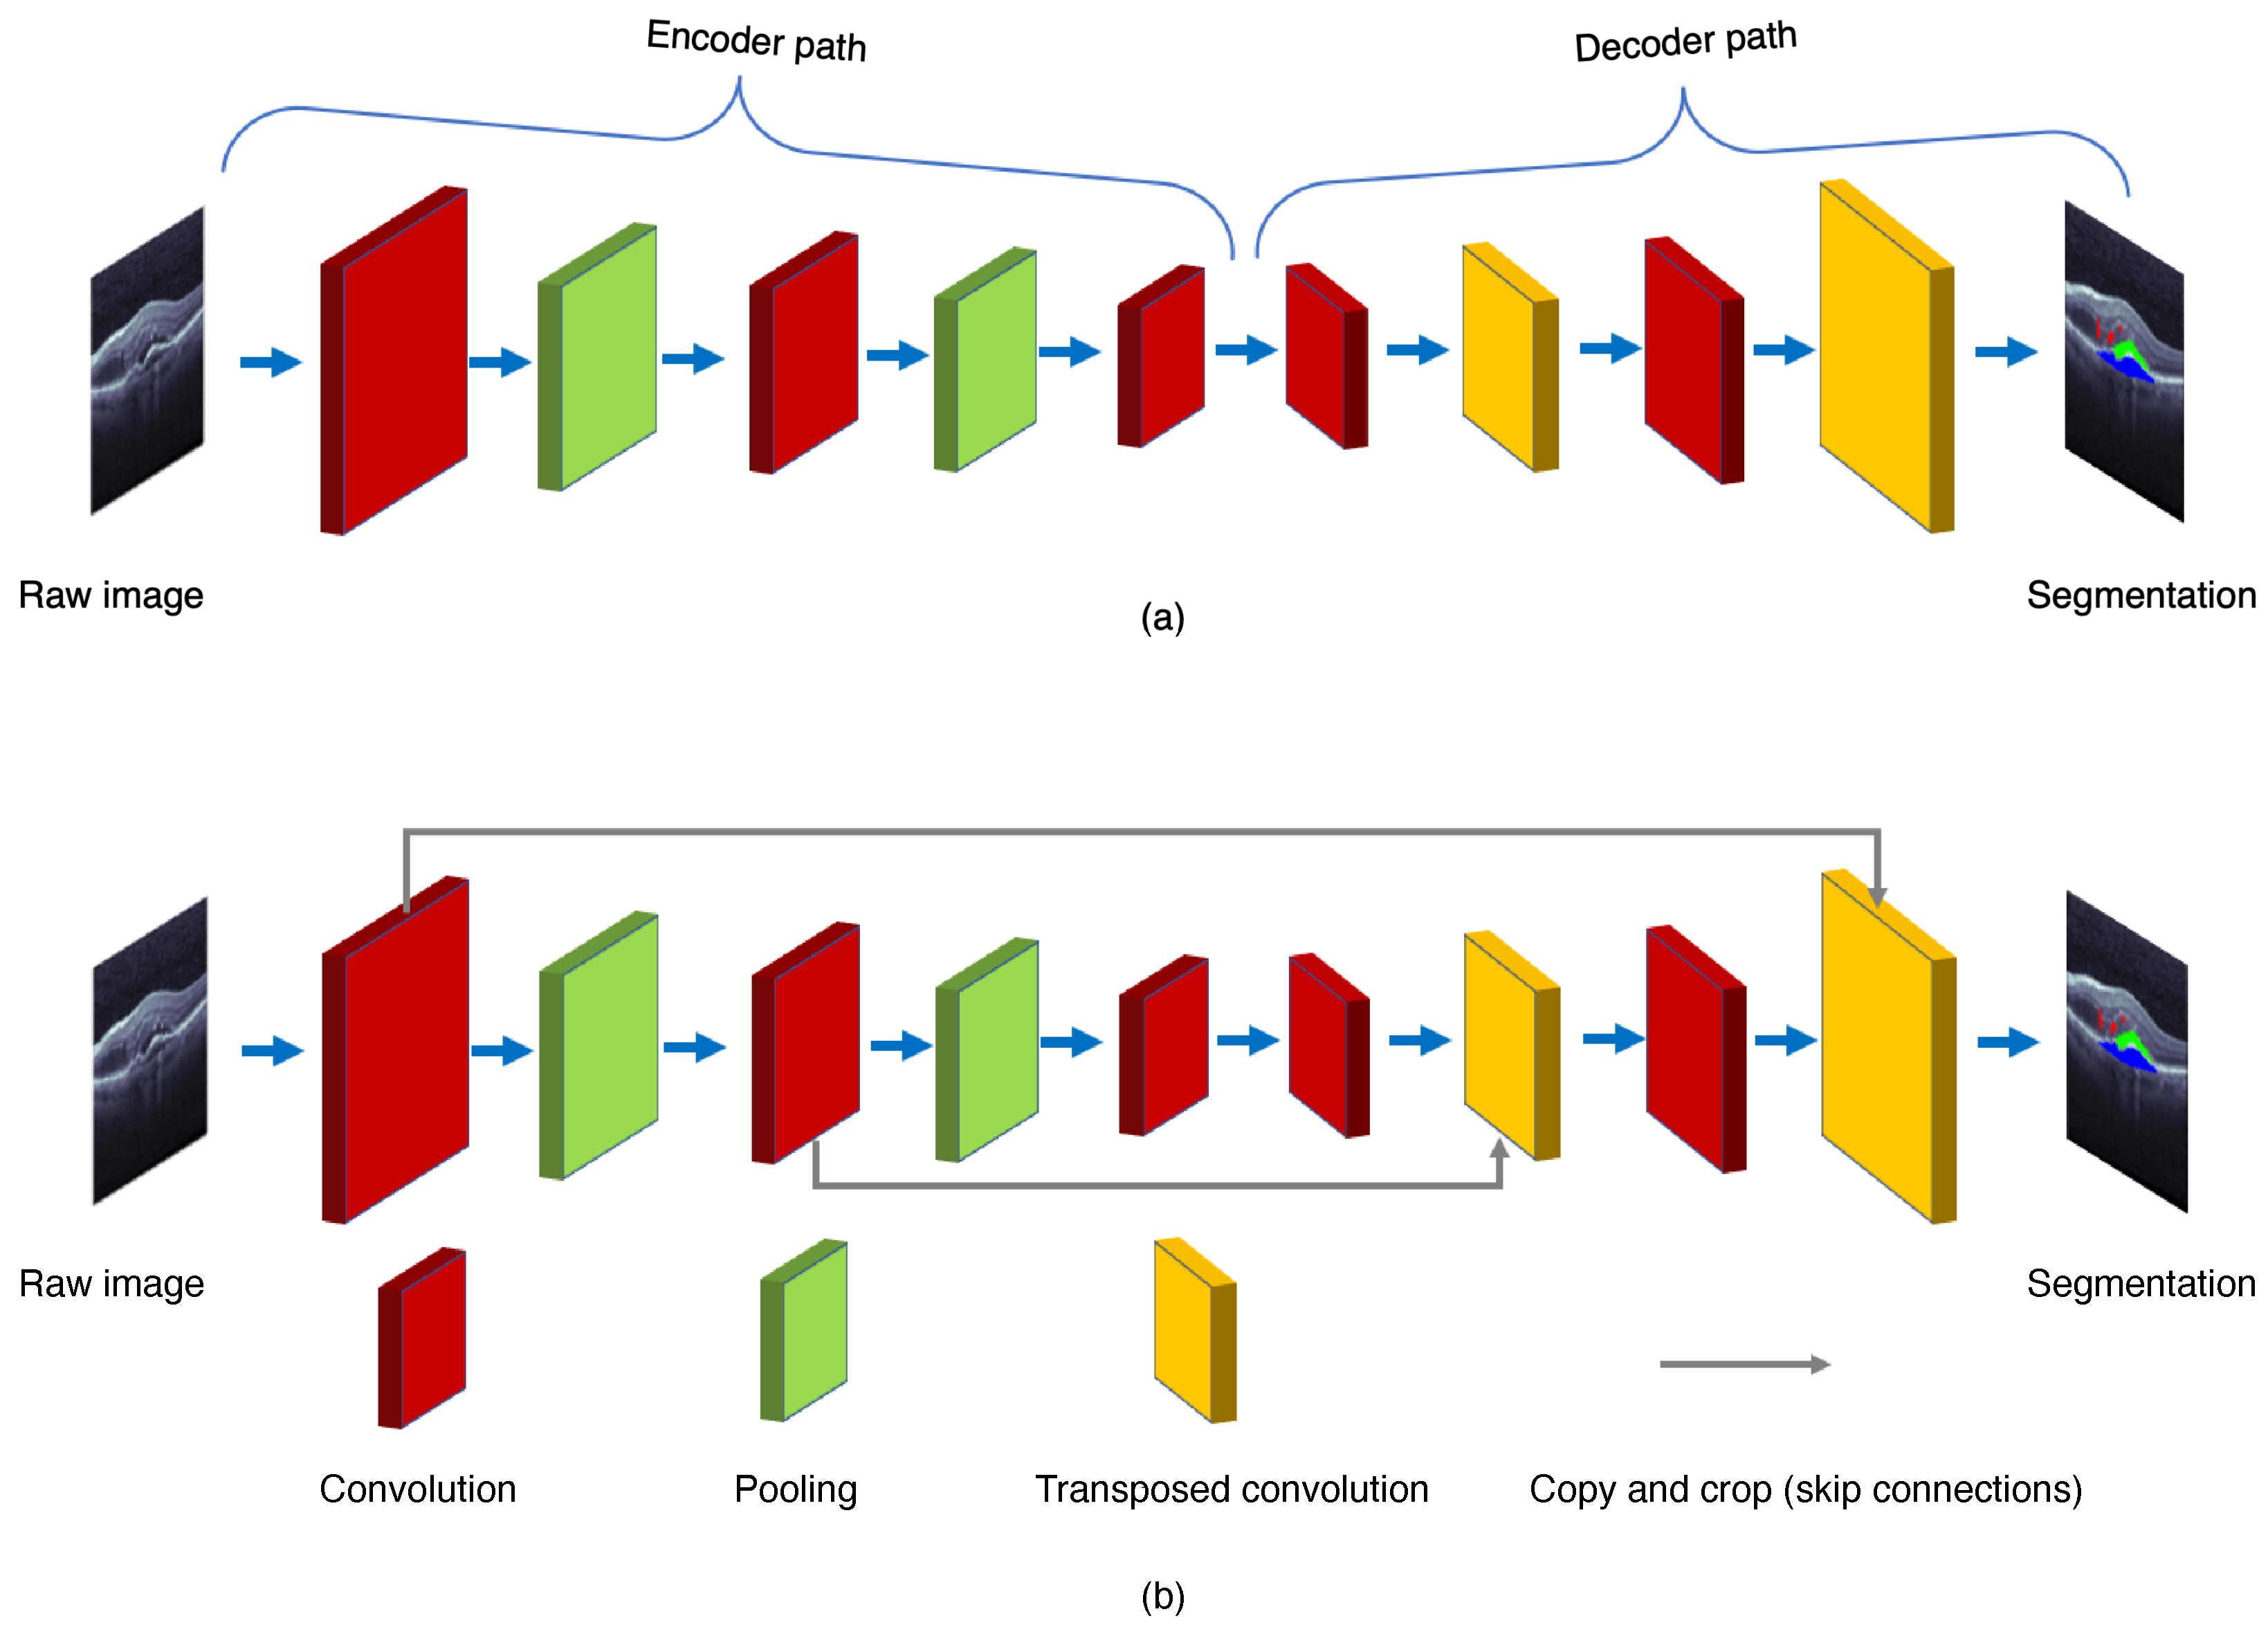
Figure 3. General structures of (a) the fully convolution network (FCN) and (b) the U-Net.
Either CNN or FCN has the major drawback of slow training process due to some operations, such as maxpool. Therefore, the training of either CNN or FCN usually takes a lot of time, and a high-performance graphics processing unit (GPU) is required to speed up the network computation. In addition, the FCN is an expensive architecture, because most of the cost is consumed by the fully convolutional layers in the end.
2.2. U-Net
To improve the segmentation performance, many other modified convolutional networks that propagate the mapped features from the encoder to the decoder have been developed. One of the most prevailing deep learning architectures for the image segmentation is the U-Net, proposed by Ronneberger et al. [7] in 2015. The U-Net adds the skip connections to propagate the downsampling feature map to the upsampling, and restore the semantic information through feature map splicing. The U-Net makes the image segmentation with an end-to-end setting, and has the advantages of requiring a smaller number images for training and also providing the desired localization. Recently, several effective retinal segmentation networks have utilized the U-Net or its 3D modification as their backbones. Hassan et al. [8] proposed the symptomatic exudate-associated derangement network (SEADNet), which employs two novel feature extractors based on the U-Net. Ye et al. [9] proposed the CAF-Net, which adds context shrinkage encode and context pyramid guide modules, without changing the depth of the U-Net, in order to improve the segmentation accuracy. The major drawback of the U-Net is the trade-off between localization accuracy and the context usage. Typically, larger patches of the U-Net require more max-pooling layers which may reduce the localization accuracy, whereas smaller patches lead to less context for visualization. On the other hand, the U-Net also runs slowly due to a large number of overlapping patches.
2.3. SegNet
With a symmetrical design of encoder and decoder, the SegNet [10] can perform the encoding and decoding with the same spatial size and same number of channels. The hierarchy decoders of the SegNet use the max-pooling indices received from the corresponding encoders to implement nonlinear upsampling of their input features. The SegNet architecture generates the sparse feature maps based on the location information, and then restores the dense feature maps through convolutions. In addition, the SegNet architecture usually adds a conditional random field (CRF) module to the ending layer in order to optimize the boundary segmentation outputs. The SegNet has the advantages of improving boundary delineation and reducing the number of end-to-end training parameters. The unsampling form the SegNet can also be effectively utilized in other encoder–decoder architectures without a significant modification.
2.4. DeepLab
The standard depth convolutional network would face two issues. First, the downsampling layers of a CNN may extend the sensory area; however, they would decrease the spatial resolution feature maps for the image segmentation tasks [11]. Second, the location information of the input image will decrease, and sometimes even disappear when the depth of the network changes. In order to keep both of the size and space invariance of the feature map, the DeepLab was proposed by Chen et al. [12] by incorporating the atrous convolutions, atrous spatial pyramid pooling (ASPP), and CRFs. The DeepLab has two major advantages: (1) The atrous convolution operations may speed up the GPU computing; (2) semantic segmentation accuracy can be improved with the multiscale image representations based on the ASPP.
3. Benchmark OCT Datasets
3.1. RETOUCH Dataset
The RETOUCH dataset [2] originates from the retinal OCT fluid challenge of MICCAI 2017, in which the OCT images were marked three labels of retinal fluid, namely, IRF, SRF, and PED, respectively. Half of the patients were diagnosed with the macular edema secondary to AMD, and the other half with the edema secondary to RVO.
Since the testing data in the competition are not public access, the OCT image data available for all researches actually remain as the training set. The training data consist of 70 OCT volumes in total. In particular, the numbers of volumes obtained by Cirrus (Model: 5000), Triton (Model: T-1000/T-2000), and Spectralis OCT systems are 24, 22, and 24, which have been labeled as IRF, SRF, PED, and normal, respectively. Within each volume, the numbers of B-scan images acquired with Cirrus (Carl Zeiss Meditec Inc., Jena, Germany), Triton (Topcon Corporation, Tokyo, Japan), and Spectralis (Heidelberg Engineering Inc., Heidelberg, Germany) are 128 (512×1024 pixels), 128 (T-2000: 512×885 pixels, T-1000: 512×650 pixels), and 49 (512×496 pixels), respectively. These B-scan images contain at least one liquid in a single volume.
It is worth mentioning that the annotations and volume of this dataset were obtained from the Medical University of Vienna (MUV) in Austria, Erasmus University Medical Center (ERASMUS) and Radboud University Medical Center (RUNMC) in The Netherlands. The annotations were manually made on the B-scan plane by the human graders from the MUV and RUNMC clinical centers. Four graders from MUV were supervised by an ophthalmology resident and trained by two retinal specialists. Two graders from RUNMC were supervised by a retinal specialist. Most of the relevant studies covered in here were carried out based on the RETOUCH dataset.
3.2. UMN Dataset
The UMN dataset was collected by the University of Minnesota (UMN) ophthalmology clinic. The dataset contains a total of 600 OCT B-scan images from 24 exudative AMD subjects [14]. During the acquisition process, each subject performed approximately 100 B-scan images, from which the 25 B-scan images with the largest liquid area were selected as samples to export. These scanned images were captured by Spectralis system, through an average of 12-19 frames with the resolution of 5.88 μm/pixel along the length and 3.87 μm/pixel along the width [14]. The UMN dataset includes the retinal fluid patterns of IRF, SRF, and PED. Each fluid region was manually annotated and checked by two ophthalmologists. Unfortunately, this dataset is difficult to implement segmentation algorithms, due to a large number of sub-RPE and sub-retinal fluid regions located in the eyes of exudative AMD patients. Rashno et al. [14] reported that the RPE errors in the UMN dataset would adversely affect the retinal pigment epithelium segmentation algorithm.
3.3. OPTIMA Dataset
The OPTIMA dataset [15] was publicly available from the cyst segmentation challenge of MICCAI 2015, and currently has been widely used for the IRF segmentation tasks. The dataset consists of 30 volumes from 4 OCT devices used in ophthalmology (i.e., Cirrus, Spectralis, Topcon, and Nidek). The dimension of each OCT volume is approximately 6×6×2 mm3, and the corresponding coordinate was centered on the macula. The dataset was split into two subsets of equal size: 15 volumes for training and the other 15 volumes for testing purpose. Only IRF labels for the training subset have been annotated by two different professional graders at the Christian Doppler Laboratory for Ophthalmic Image Analysis (OPTIMA), Medical University of Vienna. Either of the training or testing subset contains three volumes scanned from the Nidek (model: RS-3000 Advance) device (Nidek Inc., Tokyo, Japan), and the resting 12 volumes of each subset were equally obtained from Cirrus, Spectralis, Topcon (model: 3D OCT-2000) devices.
3.4. Duke Dataset
The Duke dataset [16] is a public dataset provided by Duke University. It contains 110 annotated B-scan images recorded from 10 patients with severe diabetic macular edema (DME) pathology and the annotations of eight-layer boundaries. Each patient performed 11 B-scan images, which were centered on the foveal, and 5 frames on each side of the foveal (foveal slice and scans laterally acquired at ±2, ±5, ±10, ±15, and ±20 μm from the foveal slice). The dataset also includes fluid and non-fluid regions with annotations of eight-layer boundaries. Researchers can send requests to the experts to segment the data, for the purpose of model training and algorithm testing. All of these samples were ethically licensed and special attention is paid to the anonymity of the images, which were manually labeled by two ophthalmologists for the retinal layer and fluid area.
3.5. HCMS Dataset
The HCMS dataset [17] is a public dataset provided by Johns Hopkins University. It includes the right-eye OCT scanning results of 35 subjects acquired with the Spectralis system. Each volume consists of 49 B-scan images (each B-scan including 1024 A-scans and each A-scan consisting of 496 pixels) and nine-layer boundary annotations of 14 healthy controls (HC) and 21 patients with multiple sclerosis (MS). Similar to the Duke dataset, the HCMS dataset only contains the manually labeled semantic fluid regions, and cannot be further subdivided. Therefore, researchers have to implement some necessary preprocessing procedures when using this dataset for validating the segmentation performance.
3.6. Kermany Dataset
In 2018, Kermany et al. [18] constructed the validated OCT and chest X-ray image datasets. The OCT images were scanned by the Spectralis system, and were categorized into choroidal neovascularization (CNV), DME, drusen, and normal. The Kermany dataset contains 207,130 OCT B-scan images in total. There are 108,312 OCT B-scan images recorded from 4686 patients with retinal fluid labels, including 37,206 images with CNV, 11,349 images with DME, 8617 images with drusen, and 51,140 images normal, respectively. The retinal fluid labels of the OCT images were manually annotated with a tiered grading system. The first tier of graders were undergraduate and medical students, who reviewed the diagnosis information and discarded the OCT images contaminated by severe artifacts. The second tier of graders were four ophthalmologists who independently graded the images by making records of the CNV, DME, and drusen information. The third tier of graders were two senior independent retinal specialists with over 20 years of clinical experience, who performed the final verification of image labels (Table 1).
Table 1. Public benchmark optical coherence tomography (OCT) datasets for retinal fluid segmentation. AMD: Age-related macular degeneration, CNV: choroidal neovascularization, DME: diabetic macular edema, IRF: intraretinal fluid, MS: multiple sclerosis, PED: pigment epithelial detachment, RVO: retinal vein occlusion, SRF: subretinal fluid.
| Dataset | Data Size | Manual Labeling | Disease | Web Page |
| RETOUCH | 70 volumes | IRF, SRF, PED | AMD, RVO | https://retouch.grand-challenge.org |
| UMN | 600 B-scan images | IRF, SRF, PED | AMD | http://people.ece.umn.edu/users/parhi/data-and-code/ |
| OPTIMA | 30 volumes | IRF | AMD, RVO, DME | https://optima.meduniwien.ac.at/optima-segmentation-challenge-1/ |
| Duke | 110 B-scan images | Fluid regions | DME | https://people.duke.edu/~sf59/Chiu_BOE_2014_dataset.htm |
| HCMS | 49 B-scan images | Fluid regions | MS | http://iacl.jhu.edu/Resources |
| Kermany | 108,312 B-scan images | Fluid regions | CNV, DME, drusen | https://data.mendeley.com/datasets/rscbjbr9sj/2 |
References
- Huang, D.; Swanson, E.A.; Lin, C.P.; Schuman, J.S.; Stinson, W.G.; Chang, W.; Hee, M.R.; Flotte, T.; Gregory, K.; Puliafito, C.A.; et al. Optical coherence tomography. Science 1991, 254, 1178–1181.
- Bogunovic, H.; Venhuizen, F.; Klimscha, S.; Apostolopoulos, S.; Bab-Hadiashar, A.; Bagci, U.; Beg, M.F.; Bekalo, L.; Chen, Q.; Ciller, C.; et al. RETOUCH: The retinal OCT fluid detection and segmentation benchmark and challenge. IEEE Trans. Med. Imaging 2019, 38, 1858–1874.
- de Bruijne, M.; van Ginneken, B.; Viergever, M.A.; Niessen, W.J. Interactive segmentation of abdominal aortic aneurysms in CTA images. Med. Image Anal. 2004, 8, 127–138.
- Silveira, M.; Nascimento, J.C.; Marques, J.S.; Marcal, A.; Mendonca, T.; Yamauchi, S.; Maeda, J.; Rozeira, J. Comparison of segmentation methods for melanoma diagnosis in dermoscopy images. IEEE J. Sel. Top. Signal Process. 2009, 3, 35–45.
- Fu, H.; Xu, Y.; Lin, S.; Wong, D.W.K.; Liu, J. DeepVessel: Retinal vessel segmentation via deep learning and conditional random field. In Proceedings of the 2016 International Conference on Medical Image Computing and Computer-Assisted Intervention (MICCAI 2016), Athens, Greece, 17–21 October 2016; pp. 132–139.
- Shelhamer, E.; Long, J.; Darrell, T. Fully convolutional networks for semantic segmentation. IEEE Trans. Pattern Anal. Mach. Intell. 2017, 39, 640–651.
- Ronneberger, O.; Fischer, P.; Brox, T. U-Net: Convolutional networks for biomedical image segmentation. In Proceedings of the International Conference on Medical Image Computing and Computer-Assisted Intervention (MICCAI 2015), Munich, Germany, 5–9 October 2015; pp. 234–241.
- Hassan, B.; Qin, S.; Ahmed, R. SEADNet: Deep learning driven segmentation and extraction of macular fluids in 3D retinal OCT scans. In Proceedings of the 2020 IEEE International Symposium on Signal Processing and Information Technology (ISSPIT 2020), Louisville, KY, USA, 9–11 December 2020; pp. 1–6.
- Ye, Y.; Chen, X.; Shi, F.; Xiang, D.; Pan, L.; Zhu, W. Context attention-and-fusion network for multiclass retinal fluid segmentation in OCT images. In Proceedings of the SPIE, Medical Imaging 2021: Image Processing, San Diego, CA, USA, 14–18 February 2021; Volume 11596, p. 1159622.
- Badrinarayanan, V.; Kendall, A.; Cipolla, R. Segnet: A deep convolutional encoder-decoder architecture for image segmentation. IEEE Trans. Pattern Anal. Mach. Intell. 2017, 39, 2481–2495.
- Lin, X.; Sanchez-Escobedo, D.; Casas, J.R.; Pardas, M. Depth estimation and semantic segmentation from a single RGB image using a hybrid convolutional neural network. Sensors 2019, 19, 1795.
- Chen, L.C.; Papandreou, G.; Kokkinos, I.; Murphy, K.; Yuille, A.L. DeepLab: Semantic image segmentation with deep convolutional nets, atrous convolution, and fully connected CRFs. IEEE Trans. Pattern Anal. Mach. Intell. 2018, 40, 834–848.
More
Information
Subjects:
Engineering, Biomedical
Contributors
MDPI registered users' name will be linked to their SciProfiles pages. To register with us, please refer to https://encyclopedia.pub/register
:
View Times:
2.4K
Revisions:
4 times
(View History)
Update Date:
07 May 2022
Table of Contents


Notice
You are not a member of the advisory board for this topic. If you want to update advisory board member profile, please contact office@encyclopedia.pub.
OK
Confirm
Only members of the Encyclopedia advisory board for this topic are allowed to note entries. Would you like to become an advisory board member of the Encyclopedia?
Yes
No
${ textCharacter }/${ maxCharacter }
Submit
Cancel
Back
Comments
${ item }
|
${ item.createdUser.fullName }
${ item.createdAt }
${ item.vote }
${ item.reply }
Delete
${ reply.createdUser.fullName }
${ reply.createdAt }
${ reply.vote }
Delete
There is no reply to this comment~
${ item.replyTextCharacter }/${ item.replyMaxCharacter }
Submit
Cancel
More
No more~
There is no comment~
${ textCharacter }/${ maxCharacter }
Submit
Cancel
${ selectedItem.replyTextCharacter }/${ selectedItem.replyMaxCharacter }
Submit
Cancel
Confirm
Are you sure to Delete?
Yes
No