Your browser does not fully support modern features. Please upgrade for a smoother experience.
Submitted Successfully!
 +1 credit
Thank you for your contribution! You can also upload a video entry or images related to this topic.
For video creation, please contact our Academic Video Service.
| Version | Summary | Created by | Modification | Content Size | Created at | Operation |
|---|---|---|---|---|---|---|
| 1 | Yeniu Wang | -- | 3343 | 2022-04-08 06:23:04 | | | |
| 2 | Rita Xu | Meta information modification | 3343 | 2022-04-08 08:06:16 | | |
Video Upload Options
We provide professional Academic Video Service to translate complex research into visually appealing presentations. Would you like to try it?
Cite
If you have any further questions, please contact Encyclopedia Editorial Office.
Wang, Y.; Pagay, V.; Ostendorf, B.; Gautam, D.; Habili, N. Plant Viral Disease Detection. Encyclopedia. Available online: https://encyclopedia.pub/entry/21490 (accessed on 22 July 2026).
Wang Y, Pagay V, Ostendorf B, Gautam D, Habili N. Plant Viral Disease Detection. Encyclopedia. Available at: https://encyclopedia.pub/entry/21490. Accessed July 22, 2026.
Wang, Yeniu, Vinay Pagay, Bertram Ostendorf, Deepak Gautam, Nuredin Habili. "Plant Viral Disease Detection" Encyclopedia, https://encyclopedia.pub/entry/21490 (accessed July 22, 2026).
Wang, Y., Pagay, V., Ostendorf, B., Gautam, D., & Habili, N. (2022, April 08). Plant Viral Disease Detection. In Encyclopedia. https://encyclopedia.pub/entry/21490
Wang, Yeniu, et al. "Plant Viral Disease Detection." Encyclopedia. Web. 08 April, 2022.
Copy Citation
Plant viral diseases result in productivity and economic losses to agriculture, necessitating accurate detection for effective control. Lab-based molecular testing is the gold standard for providing reliable and accurate diagnostics; however, these tests are expensive, time-consuming, and labour-intensive, especially at the field-scale with a large number of samples. Recent advances in optical remote sensing offer tremendous potential for non-destructive diagnostics of plant viral diseases at large spatial scales.
plant viruses
remote sensing
hyperspectral imaging
disease prediction modelling
1. Introduction
Plant diseases have plagued agricultural production since antiquity. It is estimated that 20–40% of crop yield losses worldwide are caused by plant diseases, of which plant viruses are the second most significant contributor [1][2]. Viral diseases affect crop growth, reduce yield, influence the survival of scions, and impact fruit quality, consequently causing significant economic losses [3].
Major crop viral disease incidents and economic consequences have been reported worldwide [4][5][6]. In 1993–1994, tomato yellow leaf curl virus decreased tomato production by 75% and cost more than USD 10 million in the Dominican Republic [7]. Cotton leaf curl virus caused nearly 30% cotton yield loss worth USD 5 billion in Pakistan between 1992 and 1997 [8]. Rice tungro disease is a devastating viral disease that affects rice production in many countries in southeast Asia; a USD 1.5 billion annually economic loss was estimated due to this disease [5]. For woody perennial crops like fruit trees and grapevines, yield losses are not confined to one season, but multiple seasons. A 14-year field study in New Zealand found that apple tree yield and fruit size decreased gradually over this period due to apple mosaic virus infection, and up to two-thirds of yield loss was observed in the severely infected trees [9]. Atallah et al. [10] reported that Grapevine leafroll disease (GLD) could have a negative long term economic impact if the viral infection is not managed. The same study estimated that losses of between USD 25,000 and USD 40,000 ha−1 could be incurred over 25 years in a vineyard in New York State (USA). In addition, indirect damages contributing to the economic loss include the cost of roguing vines, leaving the vineyard fallow for 3–5 years to remove vectors harbouring in the rhizosphere (e.g., nematodes), and the time between replanting to the recovery to full productivity also needs to be considered [11]. Plant viruses affect not only crop yield but also the quality of downstream products. A study showed that red wine colour intensity is reduced by GLD, which may lower the wine’s price and the financial return to the winery [12]. In addition, numerous unreported and undiscovered plant viral infections make the true extent of yield loss difficult to ascertain. Viruses may cause far more significant economic losses than what is usually recognised.
Managing viral disease in the field can be challenging due to its insidious and persistent nature. Unlike other pathogens, plant viruses are incorporated in the plant genome and therefore cannot be eliminated using chemicals [13]. Infected plants are unlikely to be cured; hence they must be removed and destroyed to minimise further spreading. Viruses can be rapidly transmitted between plants in the field by vectors like insects and nematodes or spread through human activities. Insecticides have some degree of control for vectors to limit the spread of viruses; however, it is not a preferred solution due to the cost associated with ecosystem damage and concerns regarding human health risks and the possibility of vectors developing resistance [14][15]. Thus, most viral disease management strategies are preventative, including using certified virus-free planting materials, breaking down the disease cycle by removing infected plants, vector control, and breeding virus-resistant plants [14].
As part of an effective disease control strategy, detection and diagnosis perform vital roles. Traditionally, direct and indirect plant viral disease detection methods have been distinguished. Direct methods are lab-based testing methods that are either based on detecting DNA, RNA, or virus proteins. While these methods are reliable and accurate, they are expensive, time-consuming, and destructive, mandating alternative options [16][17][18]. Indirect methods, including visual assessment and biological indexing methods, have been used to overcome cost and logistic limitations. However, visual assessment by human eyes is unreliable due to the different levels of experience of the surveyors, whereas biological indexing using indicator plants for viral disease diagnosis is excessively time-consuming [19].
2. Detection of Viruses
2.1. Background-Physiological and Phenotypic Changes of Plants Affected by Viruses
Unlike living organisms that possess a cellular structure, viruses only consist of a set of one or more nucleic acid template molecules (DNA or RNA) which are covered by a coat protein [20]. They lack the protein-coding capacity of living cells and thus need to parasitise a host to utilise the host cells’ transcription machinery to replicate [13]. Replication can occur in most cells—mesophyll, epidermis, parenchyma, phloem companion, and bundle sheath [21]. Infections result in various physiological and biochemical changes that can lead to disease. Viral disease has been observed to alter amino acids and phytohormone levels, cause cell structure distortion, degrade chloroplasts to lower leaf photosynthetic capacity, and decrease nutrient uptake to retard plant growth and development [22][23]. These physiological changes can be visualised and detected as disease symptoms. For example, Gutha et al. [24] showed that a typical symptom-reddish-purple colour in red grape cultivars was caused by grapevine leafroll associated virus 3 (GLRaV-3) mainly due to the accumulation of anthocyanin in grape leaves. They also found that chlorophyll and carotenoid content were 20% less in the infected leaves than in the healthy plants, which may enhance the symptoms. Other studies suggested that insect-borne plant viruses could modify the plant pigments level to attract the vectors to spread the viruses [25][26]. Moreover, other phytochemicals that can be influenced by plant viruses include carbohydrates, polyphenols, and oxidative enzymes such as peroxidase, catalase, ascorbate peroxidase, and superoxide dismutase [27]. These chemicals can be indirectly and non-destructively estimated by eyes or optical sensors as an indication of virus infection (Figure 1).
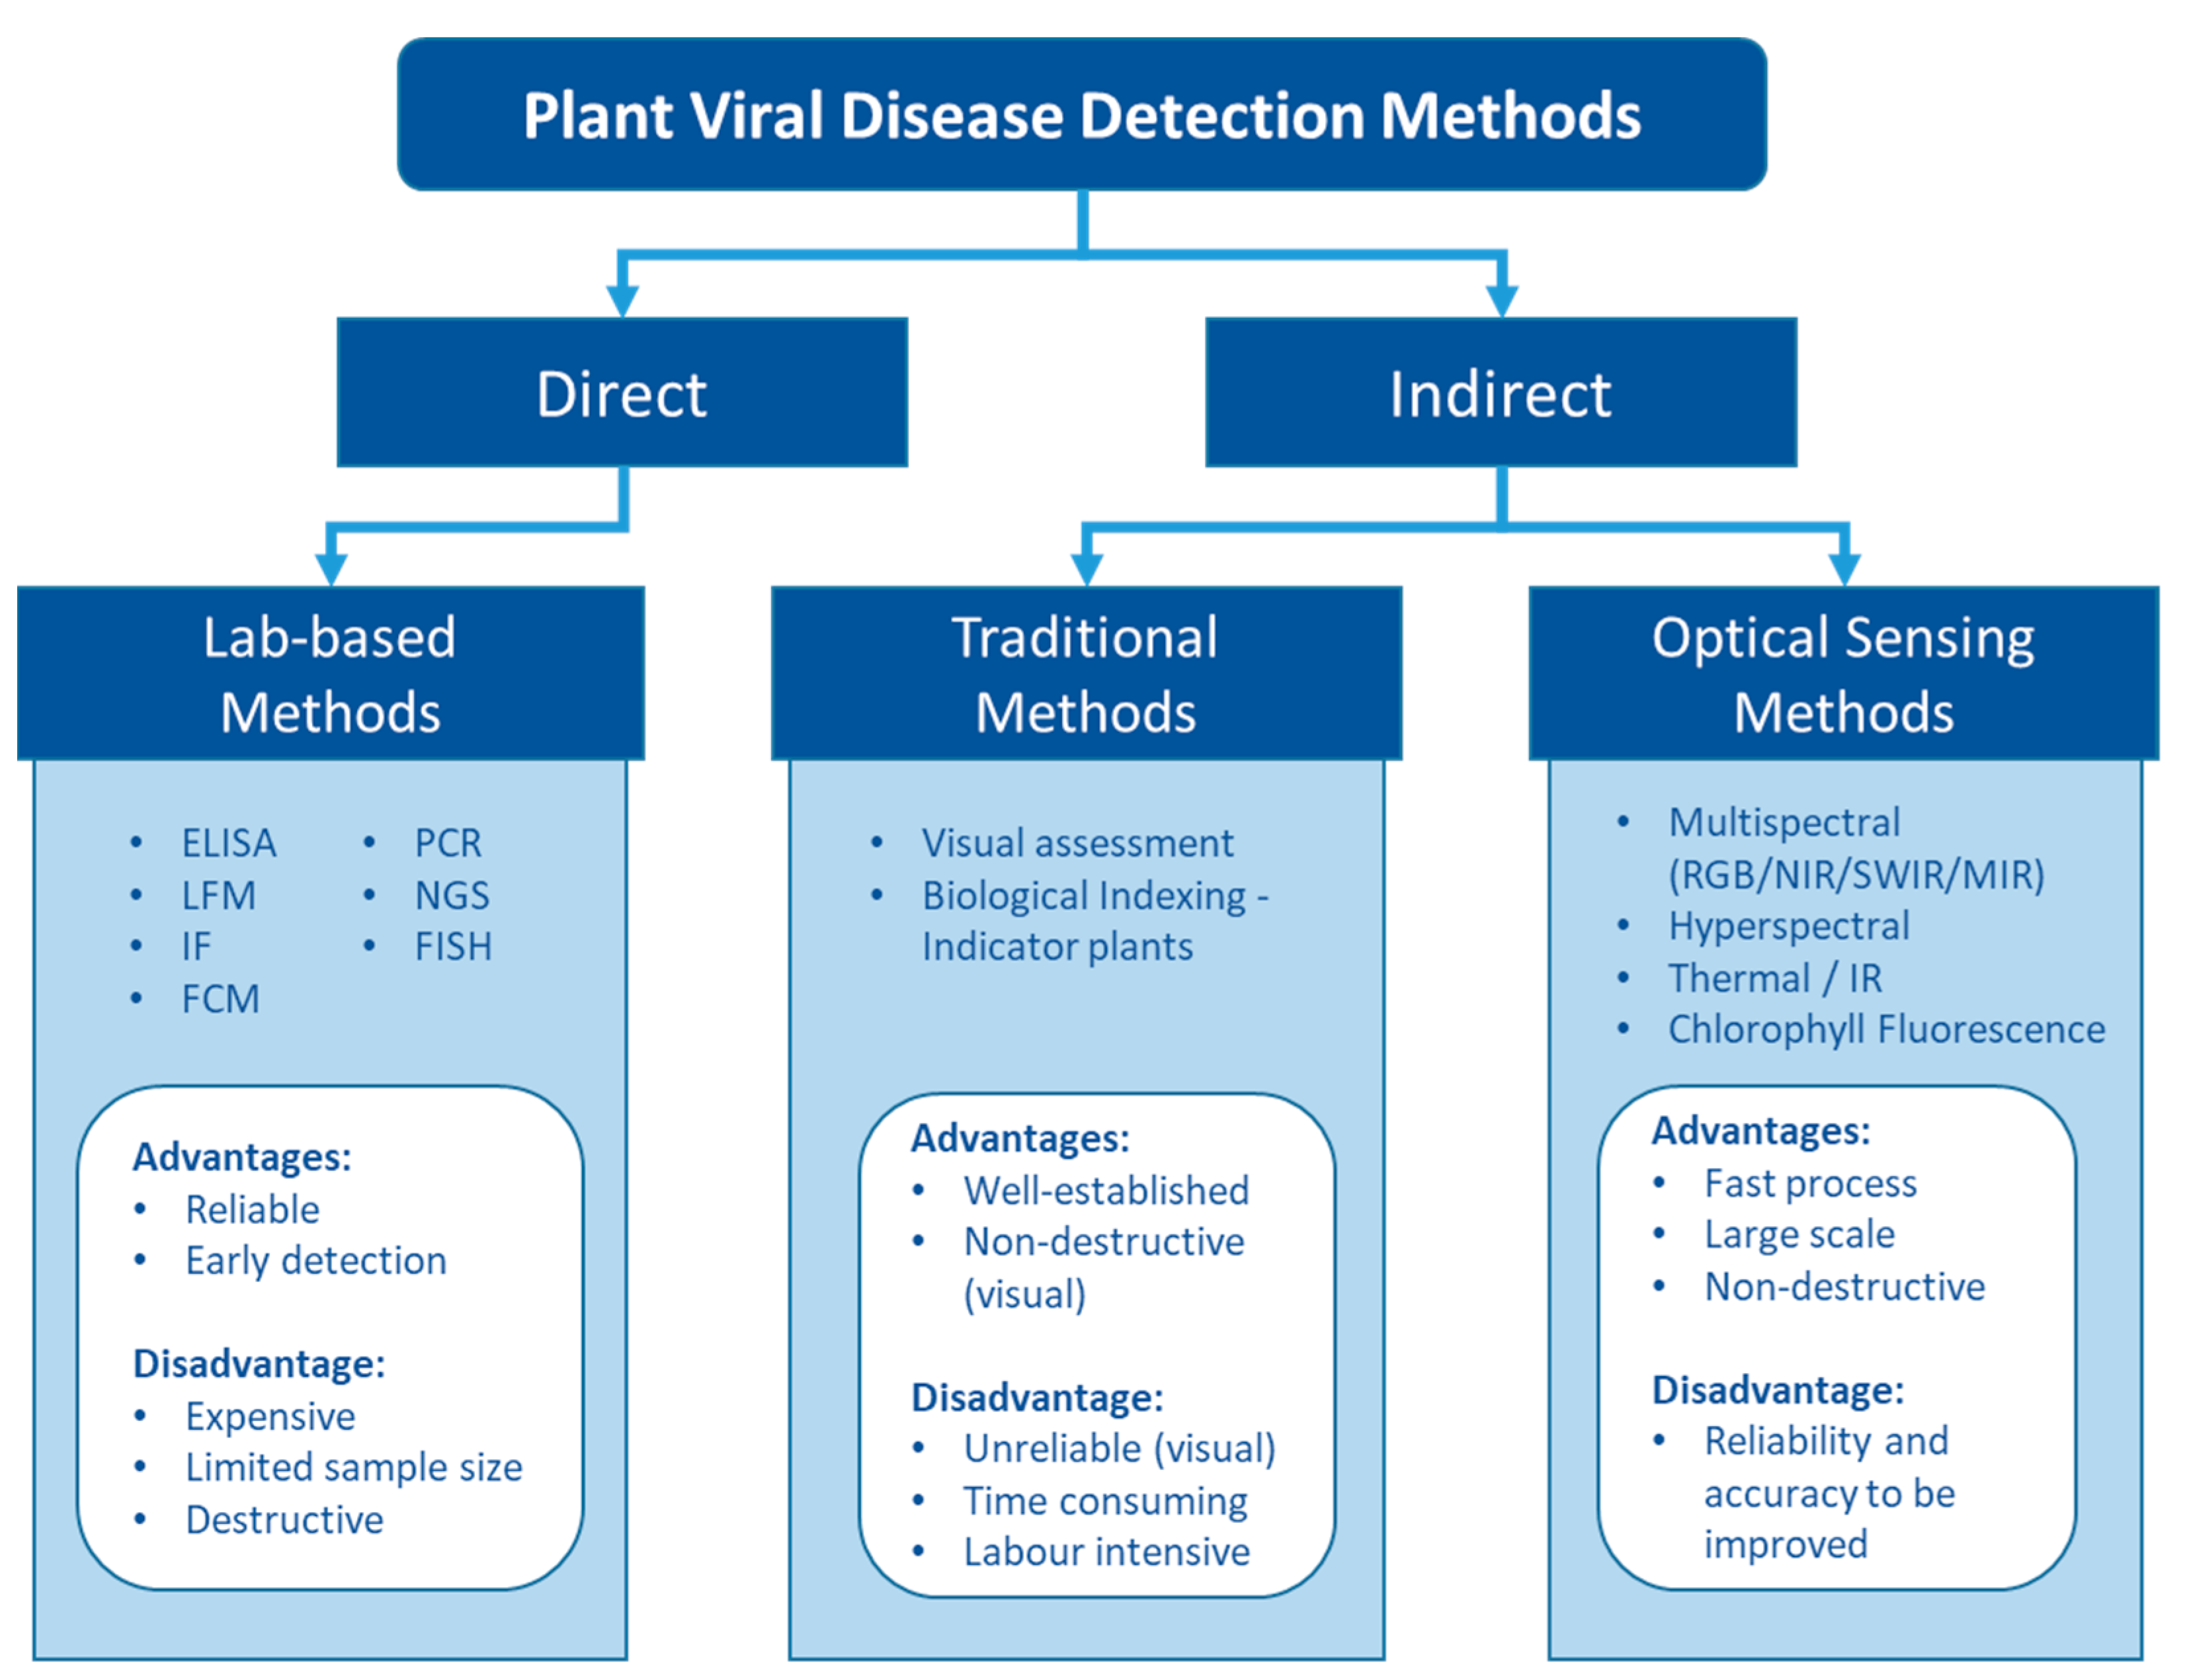
Figure 1. The pros and cons of different types of detection methods for plant viruses.
Fundamentally, plant viruses can be either directly detected by finding their genomic sequence and viral protein or indirectly assessed via the plant phenotypic response to the virus (Figure 1). Numerous plant virus detection methods have been developed to date. The rapid development of molecular and biochemical technologies has ushered in a new era of virus detection over the last few decades. Today, various lab-based diagnosis methods are available for plant virus detection [16][18][28][29]. These methods are generally sensitive and reliable and have been widely used for plant virus diagnostics.
Indirect methods that assess the plant response include traditional methods to detect virus symptoms visually in the field and novel approaches to assess the altered phenotype using optical sensors. The key advantages of these three major detection methods are related to reliability and the ability to provide efficient sampling (Figure 1).
2.2. Direct Methods
There are two major direct diagnostic methods: serological and nucleic acid. Serological methods developed in the mid-1960s use antibodies produced from an animal’s immune system to detect plant viruses [30][31]. The enzyme-labelled antibodies that bind to specific viral proteins (antigens) are readily observable and measurable through spectrophotometry [30][32]. In 1977, using the ‘double-antibody sandwich’ (DAS) form of enzyme-linked immunosorbent assay (ELISA), Clark and Adams [33] demonstrated the efficiency of the DAS-ELISA method to quantify virus concentration in plants. This method is economical and suitable for a quantity of testing compared to many other lab-based methods and continues to be widely used for plant viral disease detection. Another convenient serological diagnostic tool is the lateral flow device (LFD). It uses the virus antibodies attached to nitrocellulose membrane strip with coloured nanoparticles to produce results [34][35][36]; it has been used as a rapid, in-field detection method for plant viruses. Immunofluorescence (IF) is a technique commonly used in microbiology. Using fluorescent dye-labelled antibodies to bind the antigens, IF allows for the visualisation of plant viruses via microscopy that provides valuable information on the intracellular distribution of viruses [37][38].
Nucleic acid-based methods have been used for plant virus detection since 1979 and directly target viral DNA or RNA fragments [39]. In 1985, the revolutionary nucleic acid-based polymerase chain reaction (PCR) method was developed by Saiki et al. [40], which significantly improved plant virus diagnosis. After multiple amplification cycles in two hours, PCR can duplicate a single DNA strand up to 109-fold, which dramatically increases the sensitivity and effectiveness of the virus detection [41]. Based on PCR, many modifications and improvements were subsequently developed and extensively used in plant virus detection, including reverse transcription PCR (RT-PCR), quantitative PCR (qPCR), and loop-mediated isothermal amplification (LAMP). As most plant viruses are RNA viruses, and RNA degrades rapidly under ambient conditions, it is common to reverse-transcribe unstable RNA to more stable complementary DNA (cDNA), which are then amplified using PCR [42]. Today, RT-PCR is the most used method for plant virus diagnosis due to its capability to detect viruses at low concentrations or titer levels [43][44]. Several studies have shown that RT-PCR is more sensitive than ELISA for plant virus detection, with fewer false-negative results [44][45][46][47][48][49][50]. The qPCR, also referred to as real-time PCR, can quantify the virus titre level in the samples by measuring the DNA concentration after each amplification step during the PCR process [51][52]. The loop-mediated isothermal amplification (LAMP) technique is a promising method developed in 2000 by Notomi et al. [53]. Comparing conventional PCR, LAMP does not require a high precision thermocycler to amplify DNA. It is simpler, faster, lower-cost, and has increased popularity in plant virus detection.
Other nucleic acid-based methods have recently been developed to study and detect plant viruses. Next-generation sequencing (NGS), also known as high-throughput sequencing, is a powerful technology that can rapidly sequence the entire viral genome [28][54][55]. NGS provides a comprehensive methodology for detecting and studying plant viruses and has been instrumental in discovering previously unknown viruses and hosts for known viruses [56][57][58]. Fluorescence in situ hybridisation (FISH) uses fluorescent-labelled probes to detect the target virus nucleic acid [59]. FISH can detect and localise the viruses in plants and vectors tissues, which provides a better understanding of virus epidemiology within plant tissues, therefore potentially implicated for disease management [60][61]. Flow cytometry (FCM) can detect multiple plant viruses simultaneous in a sample [62]. It uses a laser beam to excite the fluorescence-labelled antibodies or nucleic acid probes in a fluid stream. By analysing the pass through fluorescence and scattered laser light, FCM can detect specific viruses and measure genome size and gene expression [63].
Lab-based methods remain the gold standard for the detection of plant viruses. They are highly sensitive, accurate, and reliable. They directly target the virus and do not require a plant response, and thus, they can be used for early warning of the disease. However, these methods require special attention to plant tissue sampling and sample processing to avoid cross-contamination, which is labour intensive and time-consuming. Several detection methods also require sophisticated equipment and expensive materials [64]. In light of these costs, it is economically unviable for large numbers of plants, and hence, it cannot be used to obtain representative samples of viruses at the scale of large industrial production farms. Instead, a small proportion of plants are sampled randomly, standard field patterns like X or W patterns, or strategically according to visual assessment to represent the overall disease status in a field [65][66]. However, an insufficient test rate could cause hit-and-miss situations; this is especially unacceptable for critical industries such as nurseries.
2.3. Traditional Indirect Methods
Identifying disease symptoms by eye is the simplest indirect method to detect viruses. Due to physiological changes, viruses-infected plants can show typical symptoms such as mosaic patterns on the leaf, yellowing, leaf rolling, ring spots, necrotic tissues, wilting, and nodulating [13]. Accordingly, most names of plant viruses are related to the typical symptom(s) caused to their major host. Visually identifying these typical symptoms is a quick and simple disease detection method. However, the ease of utilising this approach comes with the drawback of low accuracy for reasons that include individual variability of the surveyors, different infection rates, the developmental stage of disease, and complexity of symptoms [67]. Similar symptoms can manifest from various biotic and abiotic stresses such as nutrient deficiency, fungal or bacterial diseases, environmental factors, or mechanical damage to the plants, further reducing the accuracy.
Virus infections do not always produce apparent visual symptoms in the host plants, making accurate disease detection challenging. Biological indexing was a method developed to address this challenge; it relies on specific indicator plants that have been selected to help identify the disease symptoms. The indicator plants are susceptible species or varieties that usually develop typical symptoms once inoculated with the pathogenic viruses [68]. Biological indexing is able to confirm the potential virus that does not produce symptoms in certain plants, discover an unusual host plant for the virus, and quantify the virus [68]. Biological indexing continues to be used as a complementary method to lab-based testing methods [69]. However, the major disadvantage of using indicator plants is the long duration from inoculation to the development of disease symptoms; this process could take several weeks to months [19]. In addition, symptoms of indicator plants may also vary based on environmental conditions. Constable et al. [70] found that rugose wood symptoms on Rupestris St George indicator plants could not be observed in a cold climate, but could be detected in a hot climate. In contrast, the GLD symptoms appeared in Cabernet Franc in a cool climate, but no symptom was found in the hot climate site for the same treatments, limiting the suitability of this variety as an indicator.
Nowadays, various studies use optical sensors instead of traditional detection methods. Such sensing technology has the advantage of detecting a broader range of spectrums than the human eye, and recently, it was mimicked using computer vision to detect disease in the human brain.
2.4. Optical Sensing Technologies in Plant Viral Disease Detection
Optical sensors measure the frequency and intensity of light, both of which can be interpreted as meaningful information using multivariate statistical techniques. The sensing process is similar to that of human vision, but it has the ability to detect wavelengths of light beyond the visible spectrum detectable by the human eye [71]. The different sensors can measure specific regions of the electromagnetic spectrum, from ultraviolet (UV) to long-wave infrared (LWI). Using optical sensing technologies, subtle phenotype changes caused by the disease are detectable. The sensing technology presents rapid and non-destructive alternatives to the molecular techniques of plant disease detection [17][18] and increases the objectivity of field-based visual assessment. There is a wide variety of optical sensing methods that can be classified by their platforms and associated scale of imagery, as well as by their spectral characteristics [72][73][74][75][76]. Figure 2 illustrates various sensing technologies, their spectral ranges, and platforms that can be used for plant viral disease detection.
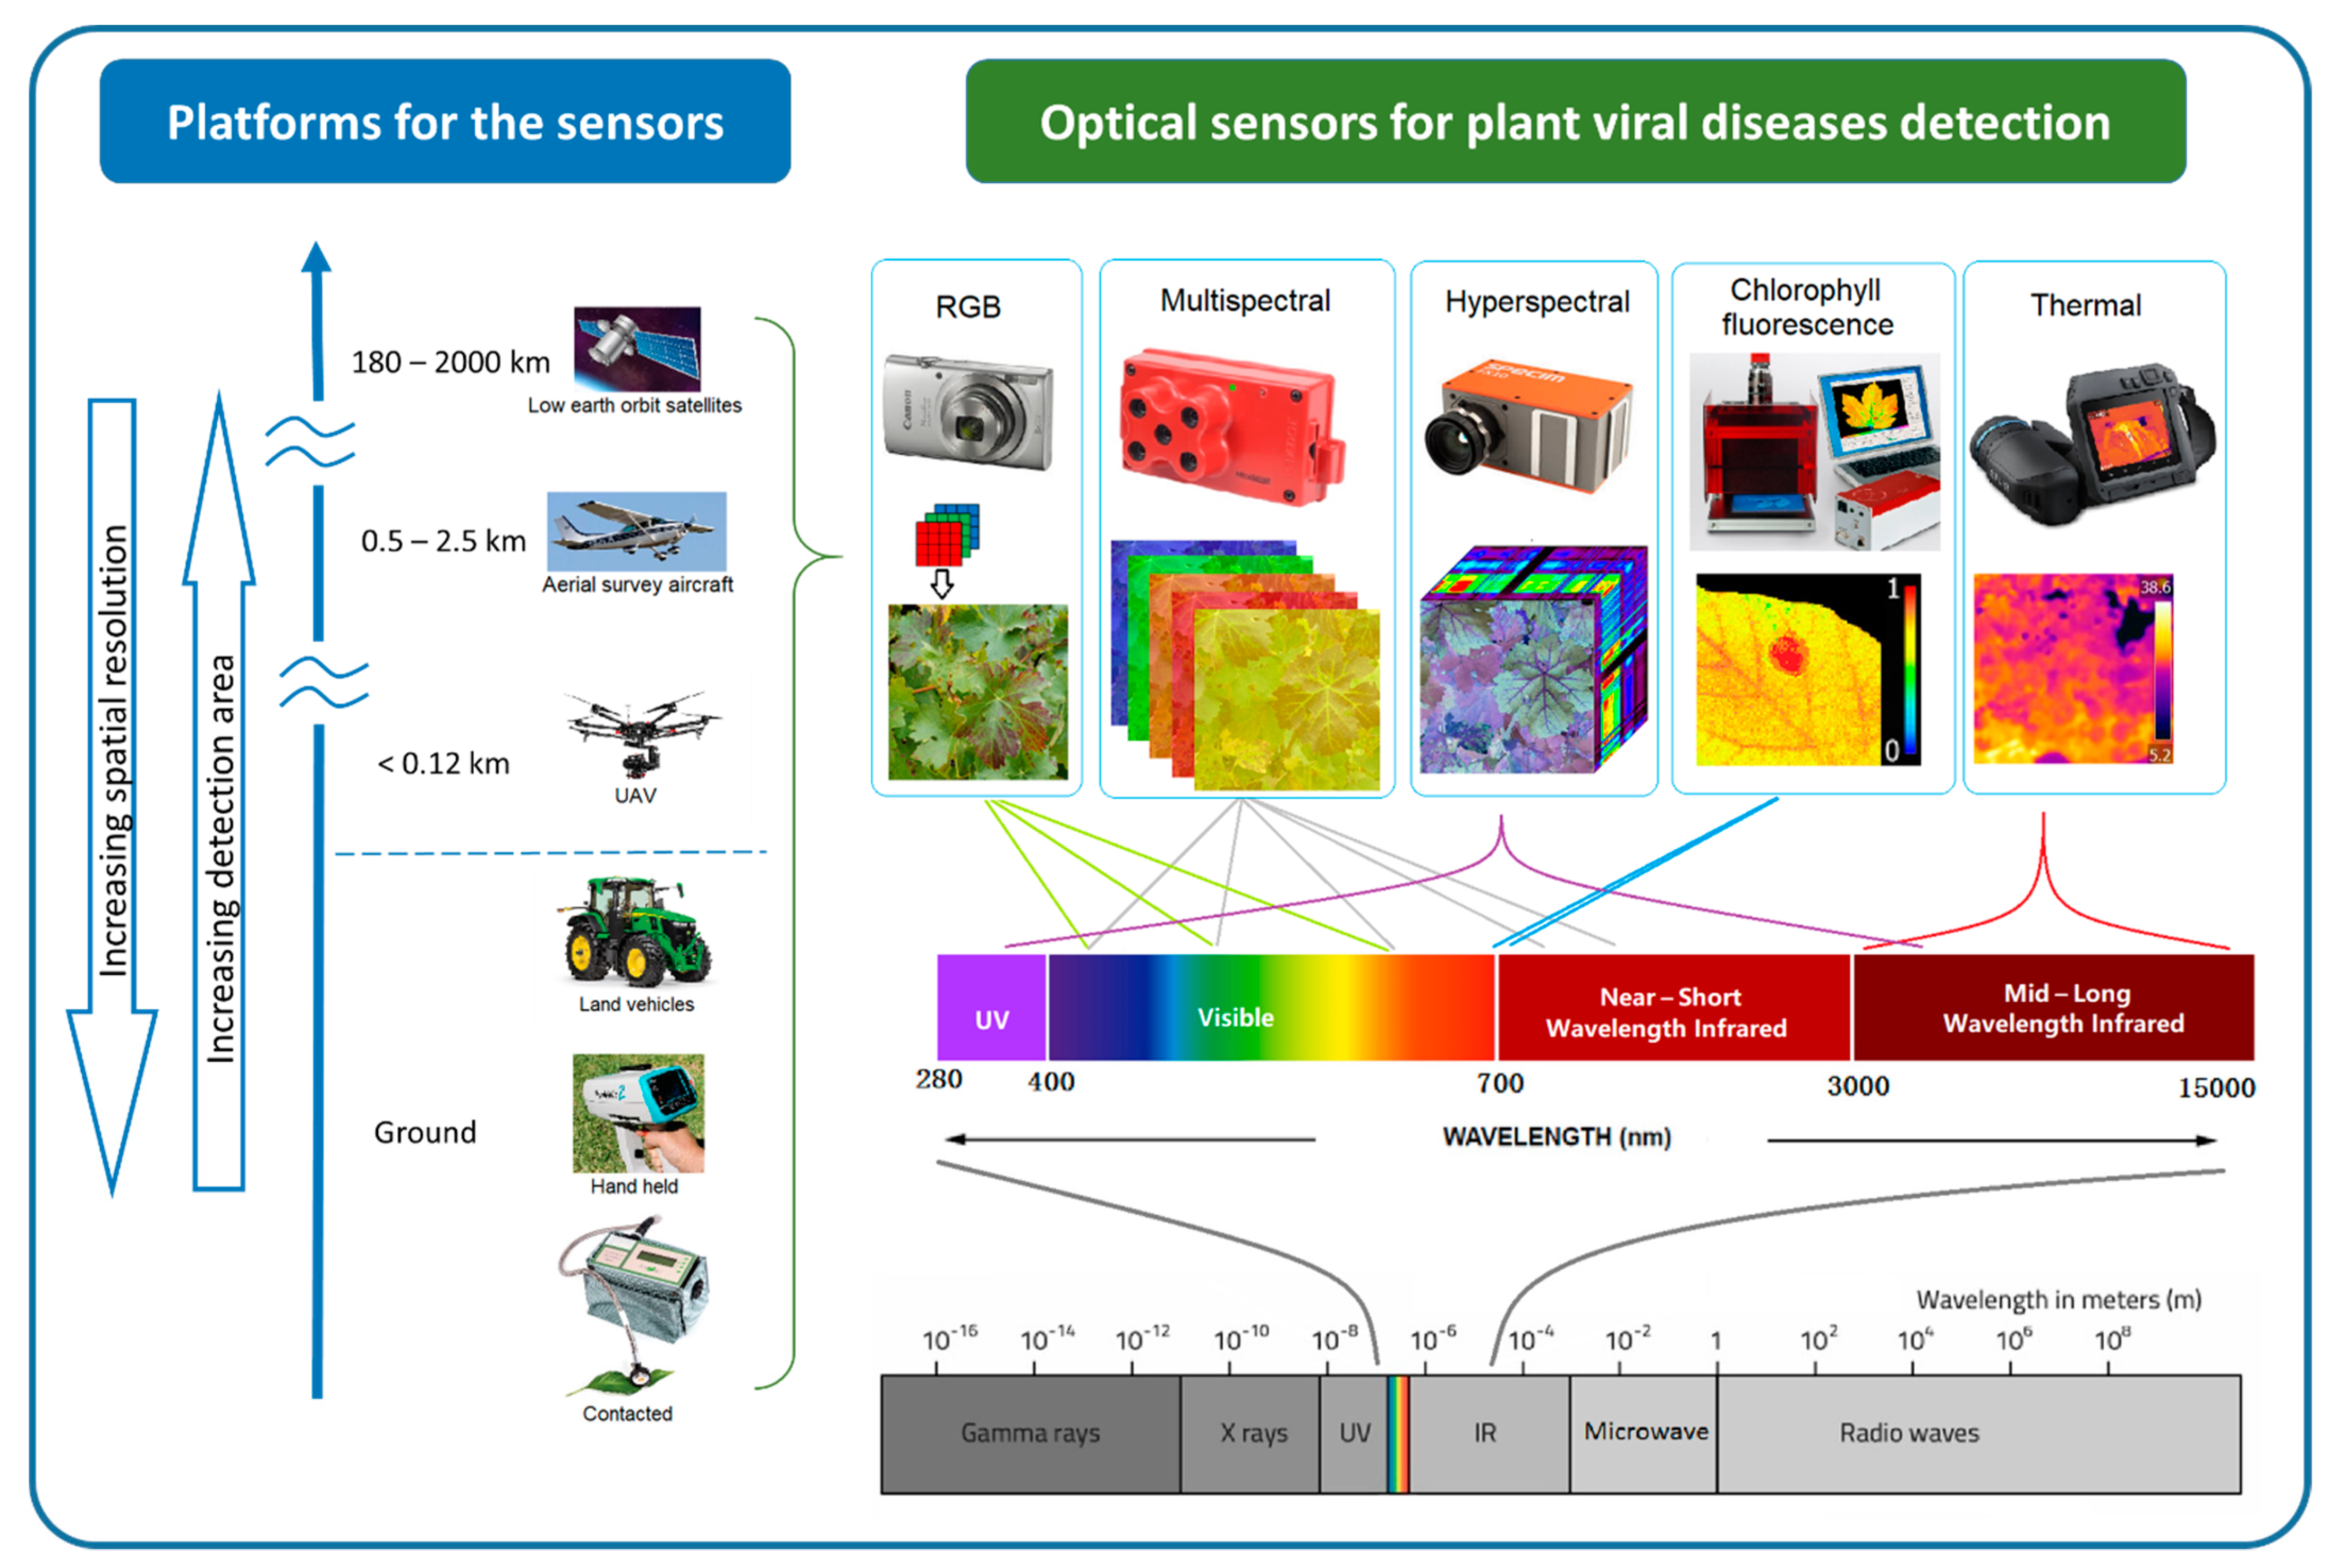
Figure 2. Optical sensing technologies for plant viral disease detection can be classified by their platform and associated spatial resolution and extent. Sensors also vary by band position, the spectral range within the whole electromagnetic spectrum.
At the finest scale, optical sensors can be used directly on contact on leaves, proximally on ground vehicles and hand-held. Some non-imaging sensors like chlorophyll fluorimeter, GreenSeeker, laser thermometer, and spectroradiometer are usually used proximally or directly in contract with the leaf [77]. By increasing the sensing distance, imaging sensors can be used proximally (e.g., mounted on tractors) or remotely (e.g., airborne platforms such as unmanned aerial vehicles (UAV), airplanes, and satellites) to support regional disease management [78]. Generally, increasing sensing distance results in decreasing spatial resolution. Satellite images provide the broadest land coverage but have the lowest spatial resolution. Manned airplanes can capture higher spatial resolution in a moderate area compared to satellite images. UAVs or drones can carry light-weight optical sensors flying as low as a few meters above ground [79][80][81], potentially providing millimetre spatial resolution images for plant viral disease detection.
In the order of increasing spectral detail, researchers find the RGB (red, green, and blue), multispectral, and hyperspectral systems. RGB systems have similar sensitivity as the human eye and thus produce images that can be readily interpreted [82]. Modern RGB cameras are user-friendly and readily available to the public, which means they can bring a large number of datasets available for plant disease identification. Community shared databases of plant disease infected images have been used for plant disease identification in recent studies using computer vision techniques [83][84]. In addition, low altitude, high-resolution aerial photos from UAV have produced a high-popularity in-field plant disease detection [18][85][86].
Multispectral sensors measure specific spectral wavelength regions across the electromagnetic spectrum; different regions or bands can be selected depending on the purpose of usage [87]. Multispectral cameras have been commonly used in remote sensing to explore land use, characterise vegetation, and monitor the environment and urban structures [88]. For agricultural purposes, the spectral bands in multispectral cameras are selected based on the vegetation characteristics of light absorption and reflection at different wavelengths. Typically, RGB, combined with the unique vegetative reflectance regions, red edge (690–740 nm) and near-infrared (NIR) (700–1300 nm) bands, are used in multispectral sensors [89][90]. This information enables the computation of specific vegetation indices (VIs) that can be used to evaluate different characteristics of the vegetation. For example, by contrasting the absorption and reflectance in red and NIR spectral regions, the well-known normalized difference vegetation index (NDVI) can be calculated [91][92].
Hyperspectral sensors capture hundreds of contiguous narrow bands (2–20 nm) across a range of spectra (UV, visible, near-infrared (VNIR) to short-wave infrared (SWIR)) instead of few discrete broad bands as do multispectral sensors [93]. The highest spectral detail is obtained by sensing single point spectroradiometers rather than imaging, for example, ASD FieldSpec 4 and Ocean Optics USB4000. These sensors are mostly used proximally or directly in contract with the plants. Various studies have shown that spectral reflection signals change with plant viral infections and have demonstrated the method’s potential for early or asymptomatic stage detection [94][95][96][97][98]. A hyperspectral imaging system provides both spatial and spectral information to produce a 3-dimensional (3D) data cube [99]. Hyperspectral imaging data present a potentially significant advantage in plant disease studies at broader scales. MacDonald et al. [100] were able to detect GLD in vineyards using an aircraft-mounted hyperspectral system. They achieved a prediction accuracy of 94.1% on average compared to visual survey results using specific leaf reflectance spectra using a spectroradiometer reported by Naidu et al. [95]. Wang et al. [101] used proximal sensing hyperspectral images to predict tomato spotted wilt virus infected region on the bell pepper plant. This entry achieved 96.2% accuracy on plant level detection by evaluating the healthy and diseased pixel ratio, which demonstrated the potential of the hyperspectral image to predict viral infections on asymptomatic leaves.
Chlorophyll fluorescence (Chl-Fl) and infrared (IR) thermal sensors have also been used for plant virus detection. Chl-Fl is an important parameter for plant health and stress expression [102][103]. Many studies have used Chl-Fl as the laboratory’s analysis tool for plant virus infection and demonstrated the likelihood of using Chl-Fl to detect plant virus infection at an early disease stage [104][105][106][107][108][109]. The passive method that uses solar radiation to measure fluorescence rate (known as solar-induced chlorophyll fluorescence) remotely for vegetation stress has also been attempted for plant stress detection [110][111][112][113][114][115][116]. The thermal sensor is predominantly used in precision agriculture to detect and monitor crop biotic and abiotic stress [80][117]. Spatial and temporal thermography patterns have shown potential for the early detection of viral disease. For example, Chaerle et al. [118] demonstrated that a resistant response (cell death) to tobacco mosaic virus (TMV) infection on the tobacco leaves could be detected by thermography rapidly after inoculation, eight hours before visible symptoms were apparent. Similarly, Zhu et al. [119] successfully distinguished the tomato mosaic disease plants five days before the visual symptom appeared using thermal imaging.
Besides those field applicable sensors, other technologies like Raman spectroscopy, Nuclear Magnetic Resonance (NMR) spectroscopy, and optical coherence tomography (OCT) have been used in the lab to detect plant virus diseases. Raman spectroscopy has been used for chemical analysis for decades. Various studies have demonstrated that Raman spectroscopy has the capability to detect plant virus infection at an early stage [120][121][122]. Some portable Raman spectroscopy is also available for in-field use [123]. NMR spectroscopy is used to determine the chemical and physical properties of matter. Some studies used NMR spectroscopy to detect plant metabolic changes caused by virus infection [124][125]. An OCT system can see through the material and detect the morphological structure of cells. Various studies have used OCT to detect plant virus infection in leaves and seeds [126][127][128].
References
- Savary, S.; Willocquet, L.; Pethybridge, S.J.; Esker, P.; McRoberts, N.; Nelson, A. The global burden of pathogens and pests on major food crops. Nat. Ecol. Evol. 2019, 3, 430–439.
- Reddy, D.V.R.; Sudarshana, M.R.; Fuchs, M.; Rao, N.C.; Thottappilly, G. Genetically engineered virus-resistant plants in developing countries: Current status and future prospects. In Advances in Virus Research; Loebenstein, G., Carr, J.P., Eds.; Academic Press: Burlington, USA, 2009; Volume 75, pp. 185–220.
- Savary, S.; Ficke, A.; Aubertot, J.-N.; Hollier, C. Crop losses due to diseases and their implications for global food production losses and food security. Food Secur. 2012, 4, 519–537.
- Jones, R.A.C. Disease Pandemics and Major Epidemics Arising from New Encounters between Indigenous Viruses and Introduced Crops. Viruses 2020, 12, 1388.
- Jones, R.A.C. Global Plant Virus Disease Pandemics and Epidemics. Plants 2021, 10, 233.
- Sastry, K.S. Impact of virus and viroid diseases on crop yields. In Plant Virus and Viroid Diseases in the Tropics; Volume 1: Introduction of Plant Viruses and Sub-Viral Agents, Classification, Assessment of Loss, Transmission and Diagnosis; Springer: Dordrecht, The Netherlands, 2013; pp. 99–159.
- Gilbertson, R.L.; Rojas, M.R.; Kon, T.; Jaquez, J. Introduction of Tomato Yellow Leaf Curl Virus into the Dominican Republic: The Development of a Successful Integrated Pest Management Strategy. Tomato Yellow Leaf Curl Virus Dis. 2007, 92, 487–496.
- Briddon, R.W.; Markham, P.G. Cotton leaf curl virus disease. Virus Res. 2000, 71, 151–159.
- Wood, G.A.; Chamberlain, E.E.; Atkinson, J.D.; Hunter, J.A. Field studies with apple mosaic virus. N. Z. J. Agric. Res. 1975, 18, 399–404.
- Atallah, S.S.; Gomez, M.I.; Fuchs, M.F.; Martinson, T.E. Economic Impact of Grapevine Leafroll Disease on Vitis vinifera cv. Cabernet franc in Finger Lakes Vineyards of New York. Am. J. Enol. Vitic. 2011, 63, 73–79.
- Maree, H.J.; Almeida, R.P.P.; Bester, R.; Chooi, K.M.; Cohen, D.; Dolja, V.V.; Fuchs, M.F.; Golino, D.A.; Jooste, A.E.C.; Martelli, G.P.; et al. Grapevine leafroll-associated virus 3. Front. Microbiol. 2013, 4, 82.
- Mannini, F.; Digiaro, M. The effects of viruses and viral diseases on grapes and wine. In Grapevine Viruses: Molecular Biology, Diagnostics and Management, 1st ed.; Meng, B., Martelli, G.P., Golino, D.A., Fuchs, M., Eds.; Springer International Publishing: Cham, Switzerland, 2017; pp. 453–482.
- Hull, R. Plant Virology, 5th ed.; Elsevier: London, UK; Academic Press: London, UK, 2013.
- Sastry, K.S.; Zitter, T.A. Management of Virus and Viroid Diseases of Crops in the Tropics. In Plant Virus and Viroid Diseases in the Tropics: Volume 2: Epidemiology and Management; Springer: Dordrecht, The Netherlands, 2014; pp. 149–480.
- Awasthi, L.P. Recent Advances in the Diagnosis and Management of Plant Diseases, 1st ed.; Springer: New Delhi, India, 2015; pp. 35–44.
- Fang, Y.; Ramasamy, R.P. Current and Prospective Methods for Plant Disease Detection. Biosensors 2015, 5, 537–561.
- Sankaran, S.; Mishra, A.; Ehsani, R.; Davis, C. A review of advanced techniques for detecting plant diseases. Comput. Electron. Agric. 2010, 72, 1–13.
- Martinelli, F.; Scalenghe, R.; Davino, S.; Panno, S.; Scuderi, G.; Ruisi, P.; Villa, P.; Stroppiana, D.; Boschetti, M.; Goulart, R.L.; et al. Advanced methods of plant disease detection: A review. Agron. Sustain. Dev. 2015, 35, 1–25.
- Legrand, P. Biological assays for plant viruses and other graft-transmissible pathogens diagnoses: A review. EPPO Bull. 2015, 45, 240–251.
- Smith, K.M. Introduction. In Plant Viruses; Smith, K.M., Ed.; Springer: Dordrecht, The Netherlands, 1977; pp. 1–5.
- Hipper, C.; Brault, V.; Ziegler-Graff, V.; Revers, F. Viral and Cellular Factors Involved in Phloem Transport of Plant Viruses. Front. Plant Sci. 2013, 4, 154.
- Mauck, K.E.; De Moraes, C.M.; Mescher, M.C. Biochemical and physiological mechanisms underlying effects ofCucumber mosaic viruson host-plant traits that mediate transmission by aphid vectors. Plant Cell Environ. 2014, 37, 1427–1439.
- Jaime, C.; Muchut, S.E.; Reutemann, A.G.; Gieco, J.O.; Dunger, G. Morphological changes, alteration of photosynthetic parameters and chlorophyll production induced by infection with alfalfa dwarf virus in Medicago sativa plants. Plant Pathol. 2019, 69, 393–402.
- Gutha, L.R.; Casassa, L.F.; Harbertson, J.F.; Naidu, R.A. Modulation of flavonoid biosynthetic pathway genes and anthocyanins due to virus infection in grapevine (Vitis vinifera L.) leaves. BMC Plant Biol. 2010, 10, 187.
- Maxwell, D.J.; Partridge, J.C.; Roberts, N.W.; Boonham, N.; Foster, G.D. The Effects of Plant Virus Infection on Polarization Reflection from Leaves. PLoS ONE 2016, 11, e0152836.
- Moeini, P.; Afsharifar, A.; Homayoonzadeh, M.; Hopkins, R.J. Plant virus infection modifies plant pigment and manipulates the host preference behavior of an insect vector. Èntomol. Exp. Appl. 2020, 168, 599–609.
- Bahar, T.; Qureshi, A.M.; Qurashi, F.; Abid, M.; Zahra, M.B.; Haider, M.S. Changes in Phyto-Chemical Status upon Viral Infections in Plant: A Critical Review. Phyton 2021, 90, 75–86.
- Boonham, N.; Kreuze, J.; Winter, S.; van der Vlugt, R.; Bergervoet, J.; Tomlinson, J.; Mumford, R. Methods in virus diagnostics: From ELISA to next generation sequencing. Virus Res. 2014, 186, 20–31.
- Naidu, R.A.; Hughes, J.D.A. Methods for the detection of plant virus diseases. In Plant Virology in Sub-Saharan Africa: Proceedings of a Conference Organized by IITA: 4–8 June 2001; International Institute of Tropical Agriculture: Ibadan, Nigeria, 2003; p. 233.
- Torrance, L.; Jones, R.A.C. Recent developments in serological methods suited for use in routine testing for plant viruses. Plant Pathol. 1981, 30, 1–24.
- Matthews, R.E.F. Serological techniques for plant viruses. In Methods in Virology; Maramorosch, K., Koprowski, H., Eds.; Elsevier Science: New York, NY, USA, 1967; Volume 3, pp. 199–241.
- Nakane, P.K.; Pierce, G.B. Enzyme-Labeled Antibodies: Preparation and Application for the Localization of Antigens. J. Histochem. Cytochem. 1966, 14, 929–931.
- Clark, M.F.; Adams, A.N.; Graham, F.L.; Smiley, J.; Russell, W.C.; Nairn, R. Characteristics of the Microplate Method of Enzyme-Linked Immunosorbent Assay for the Detection of Plant Viruses. J. Gen. Virol. 1977, 34, 475–483.
- Danks, C.; Barker, I. On-site detection of plant pathogens using lateral-flow devices. EPPO Bull. 2000, 30, 421–426.
- Maheshwari, Y.; Vijayanandraj, S.; Jain, R.K.; Mandal, B. Field-usable lateral flow immunoassay for the rapid detection of a macluravirus, large cardamom chirke virus. J. Virol. Methods 2018, 253, 43–48.
- Selvarajan, R.; Kanichelvam, P.S.; Balasubramanian, V.; Subramanian, S.S. A rapid and sensitive lateral flow immunoassay (LFIA) test for the on-site detection of banana bract mosaic virus in banana plants. J. Virol. Methods 2020, 284, 113929.
- Boine, B.; Kingston, R.L.; Pearson, M.N. Recombinant expression of the coat protein of Botrytis virus X and development of an immunofluorescence detection method to study its intracellular distribution in Botrytis cinerea. J. Gen. Virol. 2012, 93, 2502–2511.
- Kuo, S.-Y.; Lin, Y.-C.; Lai, Y.-C.; Liao, J.-T.; Hsu, Y.-H.; Huang, H.-C.; Hu, C.-C. Production of fluorescent antibody-labeling proteins in plants using a viral vector and the application in the detection of Acidovorax citrulli and Bamboo mosaic virus. PLoS ONE 2018, 13, e0192455.
- Morris, T.J.; Dodds, J. Isolation and analysis of double-stranded RNA from virus-infected plant and fungal tissue. Phytopathology 1979, 69, 854–858.
- Saiki, R.K.; Scharf, S.; Faloona, F.; Mullis, K.B.; Horn, G.T.; Erlich, H.A.; Arnheim, N. Enzymatic amplification of beta-globin genomic sequences and restriction site analysis for diagnosis of sickle cell anemia. Science 1985, 230, 1350–1354.
- Olmos, A.; Capote, N.; Bertolini, E.; Cambra, M. Molecular diagnostic methods for plant viruses. In Biotechnology and Plant Disease Management; Punja, Z.K., de Boer, S.H., Sanfaçon, H., Eds.; CAB International: Wallingford, UK, 2007; pp. 227–249.
- Farkas, D.H.; Holland, C.A. Overview of molecular diagnostic techniques and instrumentation. In Cell and Tissue Based Molecular Pathology; Tubbs, R.R., Stoler, M.H., Eds.; Churchill Livingstone: Philadelphia, CA, USA, 2009; pp. 19–32.
- Scagliusi, S.M.; Basu, S.; Gouvêa, J.A.D.; Vega, J. Comparison of two diagnostic methods for evaluation of Sugarcane yellow leaf virus concentration in Brazilian sugarcane cultivars. Funct. Plant Sci. Biotechnol. 2009, 3, 26–30.
- Mekuria, G.; Ramesh, S.; Alberts, E.; Bertozzi, T.; Wirthensohn, M.; Collins, G.; Sedgley, M. Comparison of ELISA and RT-PCR for the detection of Prunus necrotic ring spot virus and prune dwarf virus in almond (Prunus dulcis). J. Virol. Methods 2003, 114, 65–69.
- Vigne, E.; Garcia, S.; Komar, V.; Lemaire, O.; Hily, J.-M. Comparison of Serological and Molecular Methods With High-Throughput Sequencing for the Detection and Quantification of Grapevine Fanleaf Virus in Vineyard Samples. Front. Microbiol. 2018, 9, 2726.
- McGavin, W.J.; Cock, P.J.A.; Macfarlane, S.A. Partial sequence and RT-PCR diagnostic test for the plant rhabdovirus Raspberry vein chlorosis virus. Plant Pathol. 2010, 60, 462–467.
- Lima, J.A.A.; Nascimento, A.K.Q.; Radaelli, P.; Silva, A.K.F.; Silva, F.R. A Technique Combining Immunoprecipitation and RT-PCR for RNA Plant Virus Detection. J. Phytopathol. 2013, 162, 426–433.
- Rojas, M.R.; Gilbertson, R.J.; Russell, D.R.; Maxwell, D.P. Use of Degenerate Primers in the Polymerase Chain Reaction to Detect Whitefly-Transmitted Geminiviruses. Plant Dis. 1993, 77, 340–347.
- Nakaune, R.; Nakano, M. Efficient methods for sample processing and cDNA synthesis by RT-PCR for the detection of grapevine viruses and viroids. J. Virol. Methods 2006, 134, 244–249.
- Kokkinos, C.D.; Clark, C.A. Real-Time PCR Assays for Detection and Quantification of Sweetpotato Viruses. Plant Dis. 2006, 90, 783–788.
- Taylor, S.; Wakem, M.; Dijkman, G.; Alsarraj, M.; Nguyen, M. A practical approach to RT-qPCR—Publishing data that conform to the MIQE guidelines. Methods 2010, 50, S1–S5.
- Deepak, S.; Kottapalli, K.; Rakwal, R.; Oros, G.; Rangappa, K.; Iwahashi, H.; Masuo, Y.; Agrawal, G. Real-Time PCR: Revolutionizing Detection and Expression Analysis of Genes. Curr. Genom. 2007, 8, 234–251.
- Notomi, T.; Okayama, H.; Masubuchi, H.; Yonekawa, T.; Watanabe, K.; Amino, N.; Hase, T. Loop-mediated isothermal amplification of DNA. Nucleic Acids Res. 2000, 28, E63.
- Adams, I.P.; Glover, R.H.; Monger, W.A.; Mumford, R.; Jackeviciene, E.; Navalinskiene, M.; Samuitiene, M.; Boonham, N. Next-generation sequencing and metagenomic analysis: A universal diagnostic tool in plant virology. Mol. Plant Pathol. 2009, 10, 537–545.
- Barba, M.; Czosnek, H.; Hadidi, A. Historical Perspective, Development and Applications of Next-Generation Sequencing in Plant Virology. Viruses 2014, 6, 106–136.
- Wu, Q.; Habili, N.; Constable, F.; Al Rwahnih, M.A.; Goszczynski, D.E.; Wang, Y.; Pagay, V. Virus Pathogens in Australian Vineyards with an Emphasis on Shiraz Disease. Viruses 2020, 12, 818.
- Pecman, A.; Kutnjak, D.; Gutiérrez-Aguirre, I.; Adams, I.; Fox, A.; Boonham, N.; Ravnikar, M. Next Generation Sequencing for Detection and Discovery of Plant Viruses and Viroids: Comparison of Two Approaches. Front. Microbiol. 2017, 8, 1998.
- Blawid, R.; Silva, J.M.F.; Nagata, T. Discovering and sequencing new plant viral genomes by next-generation sequencing: Description of a practical pipeline. Ann. Appl. Biol. 2017, 170, 301–314.
- Rudkin, G.T.; Stollar, B.D. High resolution detection of DNA–RNA hybrids in situ by indirect immunofluorescence. Nature 1977, 265, 472–473.
- Kliot, A.; Kontsedalov, S.; Lebedev, G.; Brumin, M.; Cathrin, P.B.; Marubayashi, J.M.; Škaljac, M.; Belausov, E.; Czosnek, H.; Ghanim, M. Fluorescence in situ Hybridizations (FISH) for the Localization of Viruses and Endosymbiotic Bacteria in Plant and Insect Tissues. J. Vis. Exp. 2014, 84, e51030.
- Shargil, D.; Zemach, H.; Belausov, E.; Lachman, O.; Kamenetsky, R.; Dombrovsky, A. Development of a fluorescent in situ hybridization (FISH) technique for visualizing CGMMV in plant tissues. J. Virol. Methods 2015, 223, 55–60.
- Iannelli, D.; D’Apice, L.; Cottone, C.; Viscardi, M.; Scala, F.; Zoina, A.; Del Sorbo, G.; Spigno, P.; Capparelli, R. Simultaneous detection of cucumber mosaic virus, tomato mosaic virus and potato virus Y by flow cytometry. J. Virol. Methods 1997, 69, 137–145.
- D’Hondt, L.; Höfte, M.; VAN Bockstaele, E.; Leus, L. Applications of flow cytometry in plant pathology for genome size determination, detection and physiological status. Mol. Plant Pathol. 2011, 12, 815–828.
- Constable, F.E. A review of Diagnostic Technologies to Benefit the Australian Nursery Industry; Hort Innovation: North Sydney, Australia, 2019.
- Luo, W.; Pietravalle, S.; Parnell, S.; van den Bosch, F.; Gottwald, T.R.; Irey, M.S.; Parker, S.R. An improved regulatory sampling method for mapping and representing plant disease from a limited number of samples. Epidemics 2012, 4, 68–77.
- Jones, R.A.C. Control of plant virus diseases. Adv. Virus Res. 2006, 67, 205–244.
- Bock, C.H.; Poole, G.H.; Parker, P.E.; Gottwald, T.R. Plant Disease Severity Estimated Visually, by Digital Photography and Image Analysis, and by Hyperspectral Imaging. Crit. Rev. Plant Sci. 2010, 29, 59–107.
- Smith, K.M. Testing for viruses: Indicator plants. In Plant Viruses; Smith, K.M., Ed.; Springer: Dordrecht, The Netherlands, 1977; pp. 175–180.
- Wolfenden, R.; Henderson, C.; Dennien, S. Innovating New Virus Diagnostics and Planting Bed Management in the Australian Sweetpotato Industry; Hort Innovation: North Sydney, Australia, 2018.
- Constable, F.E.; Connellan, J.; Nicholas, P.; Rodoni, B.C. The reliability of woody indexing for detection of grapevine virus-associated diseases in three different climatic conditions in Australia. Aust. J. Grape Wine Res. 2012, 19, 74–80.
- Santos, J.L.; Farahi, F. Handbook of Optical Sensors; Taylor & Francis: London, UK, 2014; pp. 3–11.
- Lee, W.S.; Alchanatis, V.; Yang, C.; Hirafuji, M.; Moshou, D.; Li, C. Sensing technologies for precision specialty crop production. Comput. Electron. Agric. 2010, 74, 2–33.
- Mahlein, A.-K.; Oerke, E.-C.; Steiner, U.; Dehne, H.-W. Recent advances in sensing plant diseases for precision crop protection. Eur. J. Plant Pathol. 2012, 133, 197–209.
- Heim, R.H.J.; Carnegie, A.J.; Zarco-Tejada, P.J. Breaking down barriers between remote sensing and plant pathology. Trop. Plant Pathol. 2019, 44, 398–400.
- Thomas, S.; Kuska, M.T.; Bohnenkamp, D.; Brugger, A.; Alisaac, E.; Wahabzada, M.; Behmann, J.; Mahlein, A.-K. Benefits of hyperspectral imaging for plant disease detection and plant protection: A technical perspective. J. Plant Dis. Prot. 2017, 125, 5–20.
- Mahlein, A.-K. Plant Disease Detection by Imaging Sensors—Parallels and Specific Demands for Precision Agriculture and Plant Phenotyping. Plant Dis. 2016, 100, 241–251.
- Oerke, E.-C.; Mahlein, A.-K.; Steiner, U. Proximal Sensing of Plant Diseases. In Detection and Diagnostics of Plant Pathogens; Gullino, M.L., Bonants, P.J.M., Eds.; Springer: Dordrecht, The Netherlands, 2014; Volume 5, pp. 55–70.
- Jones, R. Trends in plant virus epidemiology: Opportunities from new or improved technologies. Virus Res. 2014, 186, 3–19.
- Adão, T.; Hruška, J.; Pádua, L.; Bessa, J.; Peres, E.; Morais, R.; Sousa, J.J. Hyperspectral imaging: A review on UAV-based sensors, data processing and applications for agriculture and forestry. Remote Sens. 2017, 9, 1110.
- Gautam, D.; Pagay, V. A Review of Current and Potential Applications of Remote Sensing to Study the Water Status of Horticultural Crops. Agronomy 2020, 10, 140.
- Aasen, H.; Honkavaara, E.; Lucieer, A.; Zarco-Tejada, P.J. Quantitative Remote Sensing at Ultra-High Resolution with UAV Spectroscopy: A Review of Sensor Technology, Measurement Procedures, and Data Correction Workflows. Remote Sens. 2018, 10, 1091.
- Hirsch, R. Exploring Colour Photography: A Complete Guide; Laurence King: London, UK, 2004.
- Mohanty, S.P.; Hughes, D.P.; Salathé, M. Using Deep Learning for Image-Based Plant Disease Detection. Front. Plant Sci. 2016, 7, 1419.
- Ferentinos, K.P. Deep learning models for plant disease detection and diagnosis. Comput. Electron. Agric. 2018, 145, 311–318.
- Wiesner-Hanks, T.; Wu, H.; Stewart, E.; DeChant, C.; Kaczmar, N.; Lipson, H.; Gore, M.A.; Nelson, R.J. Millimeter-Level Plant Disease Detection From Aerial Photographs via Deep Learning and Crowdsourced Data. Front. Plant Sci. 2019, 10, 1550.
- Zhou, X.-G.; Zhang, D.; Lin, F. UAV Remote Sensing: An Innovative Tool for Detection and Management of Rice Diseases; IntechOpen: London, UK, 2021.
- Kang, H.R. Multispectral imaging. In Computational Color Technology; Kang, H.R., Ed.; SPIE Press: Bellingham, WC, USA, 2006; pp. 301–324.
- Ünsalan, C.; Boyer, K.L. Multispectral Satellite Image Understanding: From Land Classification to Building and Road Detection; Springer: London, UK, 2011; pp. 49–119.
- Curran, P.J.; Windham, W.R.; Gholz, H.L. Exploring the relationship between reflectance red edge and chlorophyll concentration in slash pine leaves. Tree Physiol. 1995, 15, 203–206.
- Mulla, D.J. Twenty five years of remote sensing in precision agriculture: Key advances and remaining knowledge gaps. Biosyst. Eng. 2013, 114, 358–371.
- Rouse, J.W., Jr.; Harlan, J.C.; Haas, R.H.; Schell, J.A.; Deering, D.W. Monitoring the Vernal Advancement and Retrogradation (Green Wave Effect) of Natural Vegetation. NASA/GSFCT Type III Final Report 1974, NASA-CR-144661. Available online: https://ntrs.nasa.gov/citations/19740022555 (accessed on 12 May 2021).
- Davy, S.H. NDVI from A to Z. In The Normalized Difference Vegetation Index; Pettorelli, N., Ed.; OUP Oxford: Oxford, UK, 2013; pp. 30–43.
- Thenkabail, P.S.; Lyon, J.G.; Huete, A. Advances in hyperspectral remote sensing of vegetation and agricultural croplands. In Hyperspectral Remote Sensing of Vegetation; Thenkabail, P.S., Lyon, J.G., Huete, A., Eds.; CRC Press: Boca Raton, FL, USA, 2011; pp. 3–35.
- Griffel, L.; Delparte, D.; Edwards, J. Using Support Vector Machines classification to differentiate spectral signatures of potato plants infected with Potato Virus Y. Comput. Electron. Agric. 2018, 153, 318–324.
- Naidu, R.A.; Perry, E.M.; Pierce, F.J.; Mekuria, T. The potential of spectral reflectance technique for the detection of Grapevine leafroll-associated virus-3 in two red-berried wine grape cultivars. Comput. Electron. Agric. 2009, 66, 38–45.
- Sinha, R.; Khot, L.R.; Rathnayake, A.P.; Gao, Z.; Naidu, R.A. Visible-near infrared spectroradiometry-based detection of grapevine leafroll-associated virus 3 in a red-fruited wine grape cultivar. Comput. Electron. Agric. 2019, 162, 165–173.
- Afonso, A.M.; Guerra, R.; Cavaco, A.M.; Pinto, P.; Andrade, A.; Duarte, A.; Power, D.M.; Marques, N.T. Identification of asymptomatic plants infected with Citrus tristeza virus from a time series of leaf spectral characteristics. Comput. Electron. Agric. 2017, 141, 340–350.
- Grisham, M.P.; Johnson, R.M.; Zimba, P.V. Detecting Sugarcane yellow leaf virus infection in asymptomatic leaves with hyperspectral remote sensing and associated leaf pigment changes. J. Virol. Methods 2010, 167, 140–145.
- Qin, J. Hyperspectral imaging instruments. In Hyperspectral Imaging for Food Quality Analysis and Control; Sun, D.-W., Ed.; Academic Press: San Diego, CA, USA, 2010; pp. 129–172.
- MacDonald, S.L.; Staid, M.; Staid, M.; Cooper, M.L. Remote hyperspectral imaging of grapevine leafroll-associated virus 3 in cabernet sauvignon vineyards. Comput. Electron. Agric. 2016, 130, 109–117.
- Wang, D.; Vinson, R.; Holmes, M.; Seibel, G.; Bechar, A.; Nof, S.; Tao, Y. Early Detection of Tomato Spotted Wilt Virus by Hyperspectral Imaging and Outlier Removal Auxiliary Classifier Generative Adversarial Nets (OR-AC-GAN). Sci. Rep. 2019, 9, 4377.
- Gorbe, E.; Calatayud, A. Applications of chlorophyll fluorescence imaging technique in horticultural research: A review. Sci. Hortic. 2012, 138, 24–35.
- Daley, P.F. Chlorophyll fluorescence analysis and imaging in plant stress and disease. Can. J. Plant Pathol. 1995, 17, 167–173.
- Osmond, C.B.; Daley, P.F.; Badger, M.R.; Lüttge, U. Chlorophyll Fluorescence Quenching During Photosynthetic Induction in Leaves of Abutilon striatum Dicks. Infected with Abutilon Mosaic Virus, Observed with a Field-Portable Imaging System. Bot. Acta 1998, 111, 390–397.
- Pineda, M.; Soukupová, J.; Matouš, K.; Nedbal, L.; Barón, M. Conventional and combinatorial chlorophyll fluorescence imaging of tobamovirus-infected plants. Photosynthetica 2008, 46, 441–451.
- Spoustová, P.; Synková, H.; Valcke, R.; Čeřovská, N. Chlorophyll a fluorescence as a tool for a study of the Potato virus Y effects on photosynthesis of nontransgenic and transgenic Pssu-ipt tobacco. Photosynthetica 2013, 51, 191–201.
- Lei, R.; Jiang, H.; Hu, F.; Yan, J.; Zhu, S. Chlorophyll fluorescence lifetime imaging provides new insight into the chlorosis induced by plant virus infection. Plant Cell Rep. 2016, 36, 327–341.
- Chaerle, L.; Lenk, S.; Hagenbeek, D.; Buschmann, C.; Van Der Straeten, D. Multicolor fluorescence imaging for early detection of the hypersensitive reaction to tobacco mosaic virus. J. Plant Physiol. 2007, 164, 253–262.
- Pérez-Bueno, M.L.; Pineda, M.; Barón, M. Phenotyping Plant Responses to Biotic Stress by Chlorophyll Fluorescence Imaging. Front. Plant Sci. 2019, 10, 1135.
- Fernandez-Jaramillo, A.A.; Duarte-Galvan, C.; Contreras-Medina, L.M.; Torres-Pacheco, I.; Romero-Troncoso, R.D.J.; Guevara-Gonzalez, R.G.; Millan-Almaraz, J.R. Instrumentation in Developing Chlorophyll Fluorescence Biosensing: A Review. Sensors 2012, 12, 11853–11869.
- Ni, Z.; Lu, Q.; Huo, H.; Zhang, H. Estimation of Chlorophyll Fluorescence at Different Scales: A Review. Sensors 2019, 19, 3000.
- Grace, J.; Nichol, C.; Disney, M.; Lewis, P.; Quaife, T.; Bowyer, P. Can we measure terrestrial photosynthesis from space directly, using spectral reflectance and fluorescence? Glob. Chang. Biol. 2007, 13, 1484–1497.
- Zarco-Tejada, P.J.; Jimenez-Berni, J.A.; Suárez, L.; Sepulcre-Cantó, G.; Morales, F.; Miller, J.R. Imaging chlorophyll fluorescence with an airborne narrow-band multispectral camera for vegetation stress detection. Remote Sens. Environ. 2009, 113, 1262–1275.
- MacArthur, A.; Robinson, I.C.; Rossini, M.; Davis, N.; Macdonald, K. A dual-field-of-view spectrometer system for reflectance and fluorescence measurements (Piccolo Doppio) and correction of etaloning. In Proceedings of the Fifth International Workshop on Remote Sensing of Vegetation Fluorescence, Paris, France, 22–24 April 2014.
- Chang, C.Y.; Zhou, R.; Kira, O.; Marri, S.; Skovira, J.; Gu, L.; Sun, Y. An Unmanned Aerial System (UAS) for concurrent measurements of solar-induced chlorophyll fluorescence and hyperspectral reflectance toward improving crop monitoring. Agric. For. Meteorol. 2020, 294, 108145.
- Vargas, J.Q.; Bendig, J.; Mac Arthur, A.; Burkart, A.; Julitta, T.; Maseyk, K.; Thomas, R.; Siegmann, B.; Rossini, M.; Celesti, M.; et al. Unmanned Aerial Systems (UAS)-Based Methods for Solar Induced Chlorophyll Fluorescence (SIF) Retrieval with Non-Imaging Spectrometers: State of the Art. Remote Sens. 2020, 12, 1624.
- Khanal, S.; Fulton, J.; Shearer, S. An overview of current and potential applications of thermal remote sensing in precision agriculture. Comput. Electron. Agric. 2017, 139, 22–32.
- Chaerle, L.; Van Caeneghem, W.; Messens, E.; Lambers, H.; Van Montagu, M.; Van Der Straeten, D. Presymptomatic visualization of plant–virus interactions by thermography. Nat. Biotechnol. 1999, 17, 813–816.
- Zhu, W.; Chen, H.; Ciechanowska, I.; Spaner, D. Application of infrared thermal imaging for the rapid diagnosis of crop disease. IFAC-PapersOnLine 2018, 51, 424–430.
- Mandrile, L.; Rotunno, S.; Miozzi, L.; Vaira, A.M.; Giovannozzi, A.M.; Rossi, A.M.; Noris, E. Nondestructive Raman Spectroscopy as a Tool for Early Detection and Discrimination of the Infection of Tomato Plants by Two Economically Important Viruses. Anal. Chem. 2019, 91, 9025–9031.
- Farber, C.; Shires, M.; Ong, K.; Byrne, D.; Kurouski, D. Raman spectroscopy as an early detection tool for rose rosette infection. Planta 2019, 250, 1247–1254.
- Rys, M.; Juhász, C.; Surówka, E.; Janeczko, A.; Saja, D.; Tóbiás, I.; Skoczowski, A.; Barna, B.; Gullner, G. Comparison of a compatible and an incompatible pepper-tobamovirus interaction by biochemical and non-invasive techniques: Chlorophyll a fluorescence, isothermal calorimetry and FT-Raman spectroscopy. Plant Physiol. Biochem. 2014, 83, 267–278.
- Yeturu, S.; Jentzsch, P.V.; Ciobotă, V.; Guerrero, R.; Garrido, P.; Ramos, L.A. Handheld Raman spectroscopy for the early detection of plant diseases: Abutilon mosaic virus infecting Abutilon sp. Anal. Methods 2016, 8, 3450–3457.
- Choi, Y.H.; Kim, H.K.; Linthorst, H.J.M.; Hollander, J.G.; Lefeber, A.W.M.; Erkelens, C.; Nuzillard, A.J.-M.; Verpoorte, R. NMR Metabolomics to Revisit the Tobacco Mosaic Virus Infection in Nicotiana tabacum Leaves. J. Nat. Prod. 2006, 69, 742–748.
- López-Gresa, M.P.; Lisón, P.; Kim, H.K.; Choi, Y.H.; Verpoorte, R.; Rodrigo, I.; Conejero, V.; Bellés, J.M. Metabolic fingerprinting of Tomato Mosaic Virus infected Solanum lycopersicum. J. Plant Physiol. 2012, 169, 1586–1596.
- Lee, C.; Lee, S.-Y.; Kim, J.-Y.; Jung, H.-Y.; Kim, J. Optical Sensing Method for Screening Disease in Melon Seeds by Using Optical Coherence Tomography. Sensors 2011, 11, 9467–9477.
- Hao, C.T.; Eddie, T.K.-M.; Beng-Koon, N.; Sirajudeen, G.R.; Meng, T.C.; Fatt, C.T.; Tang, P.W. Diagnosis of virus infection in orchid plants with high-resolution optical coherence tomography. J. Biomed. Opt. 2009, 14, 014006.
- Lee, S.-Y.; Lee, C.; Kim, J.; Jung, H.-Y. Application of optical coherence tomography to detect Cucumber green mottle mosaic virus (CGMMV) infected cucumber seed. Hortic. Environ. Biotechnol. 2012, 53, 428–433.
More
Information
Subjects:
Virology
Contributors
MDPI registered users' name will be linked to their SciProfiles pages. To register with us, please refer to https://encyclopedia.pub/register
:
View Times:
3.1K
Entry Collection:
Remote Sensing Data Fusion
Revisions:
2 times
(View History)
Update Date:
08 Apr 2022
Table of Contents


Notice
You are not a member of the advisory board for this topic. If you want to update advisory board member profile, please contact office@encyclopedia.pub.
OK
Confirm
Only members of the Encyclopedia advisory board for this topic are allowed to note entries. Would you like to become an advisory board member of the Encyclopedia?
Yes
No
${ textCharacter }/${ maxCharacter }
Submit
Cancel
Back
Comments
${ item }
|
${ item.createdUser.fullName }
${ item.createdAt }
${ item.vote }
${ item.reply }
Delete
${ reply.createdUser.fullName }
${ reply.createdAt }
${ reply.vote }
Delete
There is no reply to this comment~
${ item.replyTextCharacter }/${ item.replyMaxCharacter }
Submit
Cancel
More
No more~
There is no comment~
${ textCharacter }/${ maxCharacter }
Submit
Cancel
${ selectedItem.replyTextCharacter }/${ selectedItem.replyMaxCharacter }
Submit
Cancel
Confirm
Are you sure to Delete?
Yes
No