 +1 credit
| Version | Summary | Created by | Modification | Content Size | Created at | Operation |
|---|---|---|---|---|---|---|
| 1 | Teresa Terrazas | + 2100 word(s) | 2100 | 2022-03-09 09:22:10 | | | |
| 2 | Catherine Yang | Meta information modification | 2100 | 2022-03-21 03:42:01 | | |
Video Upload Options
Lignin is one of the most studied and analyzed materials due to its importance in cell structure and in lignocellulosic biomass. Because lignin exhibits autofluorescence, fluorescence microscopy methods have been developed that allow it to be analyzed and characterized directly in plant tissue and in samples of lignocellulose fibers. Compared to destructive and costly analytical techniques, fluorescence microscopy presents suitable alternatives for the analysis of lignin autofluorescence. The existing qualitative methods are Epifluorescence and Confocal Laser Scanning Microscopy; however, other semi-qualitative methods have been developed that allow fluorescence measurements and to quantify the differences in the structural composition of lignin. The methods are fluorescence lifetime spectroscopy, two-photon microscopy, Föster resonance energy transfer, fluorescence recovery after photobleaching, total internal reflection fluorescence, and stimulated emission depletion. With these methods, it is possible to analyze the transport and polymerization of lignin monomers, distribution of lignin of the syringyl or guaiacyl type in the tissues of various plant species, and changes in the degradation of wood by pulping and biopulping treatments as well as identify the purity of cellulose nanofibers through lignocellulosic biomass.
1. Introduction
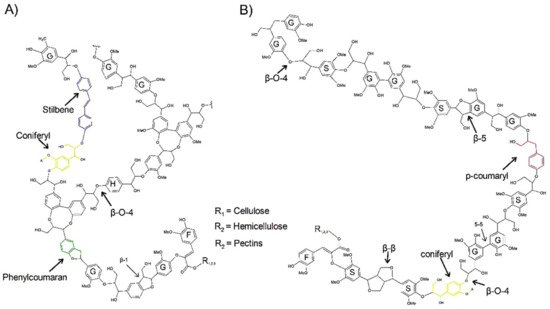
2. Structure and Autofluorescence of Lignin
3. Fluorescence Microscopy Methods
There are several methods for lignin analysis, such as those used to obtain qualitative images: epifluorescence microscopy (Epi) and confocal laser scanning microscopy (CLSM). In addition, there are methods that allow semi-quantitative analysis, such as fluorescence lifetime imaging microscopy (FLIM), total internal fluorescence reflection (TIRF), fluorescence recovery after photobleaching (FRAP), Föster resonance energy transfer (FRET), microscopy of two-photon excitation (TPM), and stimulated emission depletion (STED).
A characteristic that the different techniques share is that they work at similar wavelengths, both to excite the sample and to detect their fluorescence. In general, the range goes from 400 to 640 nm. However, some methods such as excitation using UV ranges from 300 nm of excitation, while some lasers reach up to 820 nm of excitation [19]. Based on the intensity and wavelength in which the compounds are detected, whether, in the blue, green, or red channel, some of the structural components present in the samples can be identified. In the case of lignin, the range in which fluorophores emit fluorescence is wide, so their presence can be detected in different channels [20], depending on the wavelength in which fluorophores are excited and detected, in addition to the treatments or dyes that the sample receives [19].
3.1. Wield-field fluorescence or Epifluorescence (Epi)
Epi involves the simultaneous illumination and detection of the entire field of view with low doses of photons and the rapid acquisition of the image to avoid photobleaching. However, the main disadvantage is that Epi collects quite out-of- focus light (Figure 2), so a deconvolution procedure can be applied to the image to reduce the amount of out-of-focus light and obtain a better quality image [21].
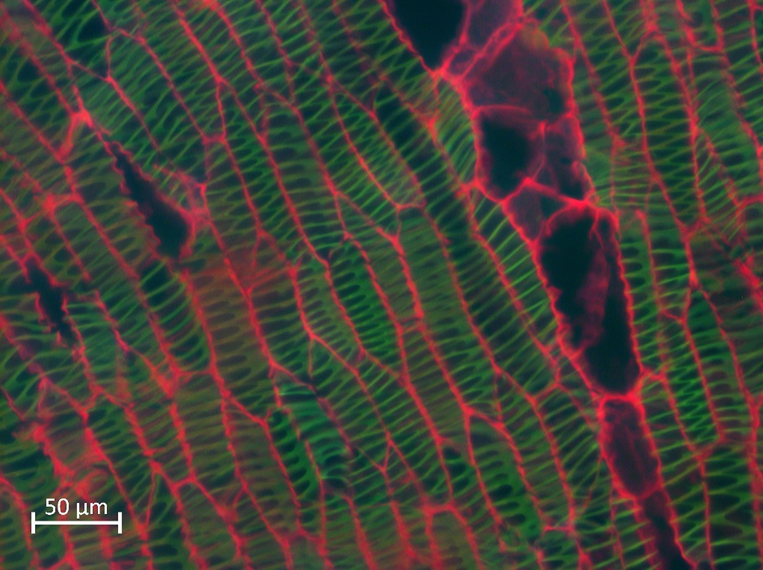
Figure 2. Epifluorescence image from a Lophocereus marginatus secondary xylem stained with safranin - fast green, excited at 365 nm (blue), 470 nm (green) and 546 nm (red) at the same time. Scale bar: 20 µm. Image taken from personal file
3.2. Confocal Laser Scanning Microscopy (CLSM)
Similar to Epi, CLSM uses a focused laser at a defined point and at a specific depth, and performs a transverse and axial scan, to collect all the emitted fluorescence information by a point detector consisting of a pinhole. The pinhole eliminates most of the light outside the focal plane, so better quality images can be obtained compared to Epi [21]. The use of this method precedes and is the basis of other techniques because the image is first taken of the area to be analyzed and later analyzes are carried out with techniques such as FRET [22][23].
3.3. Fluorescence Lifetime Spectroscopy (FLIM)
FLIM is a technique that makes it possible to identify the time that elapses between the excitation of the fluorophore, the emission of fluorescence, and its decay, which is measured in picoseconds or nanoseconds, and values obtained can be statistically analyzed [24]. However, FLIM analysis can only be used to infer the chemical changes in the sample but does not give information on what causes the changes, which may even be due to changes in the environment such as pH [25]. FLIM measurement is done by single-photon or multiple photons [20].
A variant of FLIM is Fluorescence spectral and lifetime measurement (SLiM) proposed by Terryn et al. to analyze the interaction between lignin-degrading enzymes and lignocellulose directly in plant tissues [26]. The difference with respect to FLIM that obtains the fluorescence lifetime and the CLSM image in a single wavelength range, with SLiM the range from 455 nm to 655 nm is divided into 16 spectral channels so that both the image as the fluorescence lifetime are obtained for each channel.
3.4. Two-Photon Microscopy (TPM)
With this technique, thick samples are analyzed so 3D images can be generated. However, unlike the confocal microscope, there is no photobleaching or phototoxicity above or below the plane in focus, which is why TPM has been used to characterize lignocellulose biomass samples [27]. TPM uses a double excitation by means of two photons simultaneously (Figure 3). Each photon has half the energy of the single-photon excitation event, so the energy of a photon is inversely proportional to its wavelength. In a two-photon excitation, the photons must have a wavelength approximately twice the wavelength of the photons needed to achieve an equivalent transition under one-photon exposure [28].
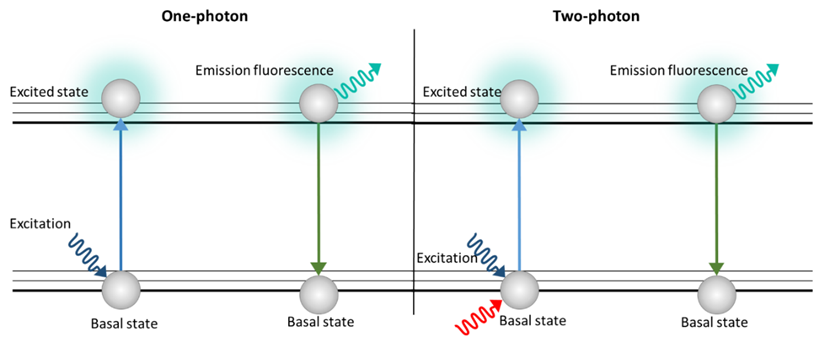
Figure 3. Schematic image of excitation with one photon (Epi, CLSM) and two photons (TPM)
This type of microscopy has been used to analyze the structural morphology of sugarcane bagasse before and after a hydrolysis and bleaching treatment, because when penetrating the sample, better quality details of the structure are obtained compared to confocal microscopy [29].
3.5. Förster Resonance Energy Transfer (FRET)
This method consists of measuring the molecular interaction between two fluorophores by superimposing the emission and excitation spectra [30]. The process occurs when a donor fluorophore and an acceptor fluorophore are within 10 nm, making it possible for a non-radiative transfer of excitation energy from donor to acceptor to occur [12]. When the distance between donor and acceptor increases, the efficiency of FRET decreases to the sixth power of the distance [26]. Measurement with FRET occurs by determining the changes in fluorescence intensity of the donor and acceptor or by the change in fluorescence over the lifetime of the donor in the presence or absence of the acceptor [20].
3.6. Fluorescence Recovery After Photobleaching (FRAP)
FRAP consists of three steps: the first is to mark a region of interest (ROI) in the sample and record the fluorescence intensity prior to photobleaching, then, the ROI is photobleached with a high-power laser beam so that the fluorophores in ROIs are destroyed and irreversibly stop fluorescing (Figure 4). Subsequently, the area around the fluorescent molecules that can freely distribute in the ROI increases and thus increases the ROI fluorescence, so that the fluorescence recovery reaches a plateau. The scanning fraction that is exchanged between the unbleached area and the bleached area is called the mobile fraction, while the fraction that cannot be exchanged is called the immobile fraction. What is measured is the intensity of fluorescence and the time it takes to recover after photobleaching [12].
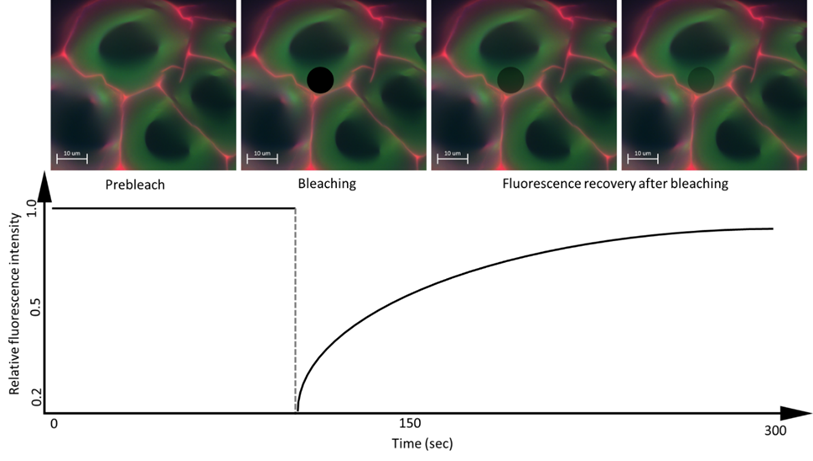
Figure 4. Schematic image of the FRAP method. Image taken from personal file, graphic based in [31].
3.7. Total Internal Reflection Fluorescence (TIRF)
TIRF uses specific optics to produce illumination light only in the range of 50 to 100 nm at the interface [21], which drastically reduces the light from the bulb and improves the ability to detect fluorescent molecules only on the surface of the sample. TIRF uses the evanescent wave generated when the incident light undergoes total internal reflection, or a highly inclined laminated optical sheet (HILO) to illuminate only a partial volume smaller than 200 nm, obtaining the dynamic behavior of a single fluorescent molecule [31]; unlike CLSM which detects the fluorescence emission of the sample from the inner part of the sample. Due to better resolution images, TIRF can be used in conjunction with epifluorescence to characterize lignified fibers and cellular structures [32].
3.8. Stimulated Emission Depletion (STED)
STED is a super-resolution microscopy method based on confocal microscopy, in which images are acquired by scanning a point of light focused on a ROI, and fluorescence is collected sequentially pixel by pixel [33]. The system combines blue excitation lasers with red depletion lasers that pass through a phase plate to be patterned into a donut shape in the focal plane. The resulting excitation is a superposition of the two beams, leading to a high-resolution probe scanning the sample, whereby the resulting effective detected fluorescence emission is collected with high spatial and axial resolutions on the nanometer scale, similar to what obtained with transmission electron microscopy (TEM) [34].
4. Conclusion and Future Perspectives
Most studies take advantage of the autofluorescence of lignin and the dyes they use are mainly to dye cellulosic or hemicellulosic structures because they do not emit autofluorescence, especially in the FRET method, where lignin and Rhodamine dye interact for the fluorescence emission. On the other hand, although the selected articles were the most recent, the FRET, FRAP, TPM FLIM, STED, and TIRF techniques have recently been applied to analyze the structure and composition of lignin. The data obtained can be semi-quantitative and they allow comparisons to be made between the samples analyzed quickly, at low cost, and with non-destructive and super-resolution procedures, as in the case of STED.
References
- Hugues Renault; Danièle Werck-Reichhart; Jing-Ke Weng; Harnessing lignin evolution for biotechnological applications. Current Opinion in Biotechnology 2018, 56, 105-111, 10.1016/j.copbio.2018.10.011.
- Bo Liu; Lina Tang; Qian Chen; Liming Zhu; Xianwu Zou; Botao Li; Qin Zhou; Yuejin Fu; Yun Lu; Lignin Distribution on Cell Wall Micro-Morphological Regions of Fibre in Developmental Phyllostachys pubescens Culms. Polymers 2022, 14, 312, 10.3390/polym14020312.
- António Velez Marques; Jorge Rencoret; Ana Gutiérrez; José C. del Río; Helena Pereira; Ferulates and lignin structural composition in cork. Holzforschung 2015, 70, 275-289, 10.1515/hf-2015-0014.
- Xuebing Zhao; Lihua Zhang; Dehua Liu; Biomass recalcitrance. Part II: Fundamentals of different pre-treatments to increase the enzymatic digestibility of lignocellulose. Biofuels, Bioproducts and Biorefining 2012, 6, 561-579, 10.1002/bbb.1350.
- Siti Hajar Sekeri; Mohamad Nasir Mohamad Ibrahim; Khalid Umar; Asim Ali Yaqoob; Mohamad Nurul Azmi; M. Hazwan Hussin; Muhammad Bisyrul Hafi Othman; Muhammad Fadhirul Izwan Abdul Malik; Preparation and characterization of nanosized lignin from oil palm (Elaeis guineensis) biomass as a novel emulsifying agent. International Journal of Biological Macromolecules 2020, 164, 3114-3124, 10.1016/j.ijbiomac.2020.08.181.
- Lloyd A. Donaldson; Wood cell wall ultrastructure The key to understanding wood properties and behaviour. IAWA Journal 2019, 40, 645-672, 10.1163/22941932-40190258.
- Cassie Marie Welker; Vimal Kumar Balasubramanian; Carloalberto Petti; Krishan Mohan Rai; Seth DeBolt; Venugopal Mendu; Engineering Plant Biomass Lignin Content and Composition for Biofuels and Bioproducts. Energies 2015, 8, 7654-7676, 10.3390/en8087654.
- Brigitte Chabbert; Christine Terryn; Mickaël Herbaut; Alankar Vaidya; Anouck Habrant; Gabriel Paës; Lloyd Donaldson; Fluorescence techniques can reveal cell wall organization and predict saccharification in pretreated wood biomass. Industrial Crops and Products 2018, 123, 84-92, 10.1016/j.indcrop.2018.06.058.
- John H. Grabber; How Do Lignin Composition, Structure, and Cross‐Linking Affect Degradability? A Review of Cell Wall Model Studies. Crop Science 2005, 45, 820-831, 10.2135/cropsci2004.0191.
- John H. Grabber; How Do Lignin Composition, Structure, and Cross‐Linking Affect Degradability? A Review of Cell Wall Model Studies. Crop Science 2005, 45, 820-831, 10.2135/cropsci2004.0191.
- Gregor P. C. Drummen; Fluorescent Probes and Fluorescence (Microscopy) Techniques — Illuminating Biological and Biomedical Research. Molecules 2012, 17, 14067-14090, 10.3390/molecules171214067.
- Gabriel Paës; Fluorescent Probes for Exploring Plant Cell Wall Deconstruction: A Review. Molecules 2014, 19, 9380-9402, 10.3390/molecules19079380.
- Bo Albinsson; Shiming Li; Knut Lundquist; Rolf Stomberg; The origin of lignin fluorescence. Journal of Molecular Structure 1999, 508, 19-27, 10.1016/s0022-2860(98)00913-2.
- Lloyd Donaldson; Ksenija Radotić; Aleksandar Kalauzi; Daniela Djikanović; Milorad Jeremić; Quantification of compression wood severity in tracheids of Pinus radiata D. Don using confocal fluorescence imaging and spectral deconvolution. Journal of Structural Biology 2010, 169, 106-115, 10.1016/j.jsb.2009.09.006.
- Antonio Eduardo Da Hora Machado; Rodrigo De Paula; Reinaldo Ruggiero; Christian Gardrat; Alain Castellan; Photophysics of dibenzodioxocins. Journal of Photochemistry and Photobiology A: Chemistry 2006, 180, 165-174, 10.1016/j.jphotochem.2005.10.011.
- D. Djikanović; Aleksandar Kalauzi; K. Radotić; C. Lapierre; M. Jeremić; Deconvolution of lignin fluorescence spectra: A contribution to the comparative structural studies of lignins. Russian Journal of Physical Chemistry A 2007, 81, 1425-1428, 10.1134/s0036024407090142.
- Ilabahen Patel; Jeremiah Woodcock; Ryan Beams; Stephan Stranick; Ryan Nieuwendaal; Jeffrey Gilman; Marina Mulenos; Christie Sayes; Maryam Salari; Glen DeLoid; et al.Philip DemokritouBryan HarperStacey HarperKimberly OngJo ShatkinDouglas Fox Fluorescently Labeled Cellulose Nanofibers for Environmental Health and Safety Studies. Nanomaterials 2021, 11, 1015, 10.3390/nano11041015.
- Lloyd Donaldson; Softwood and Hardwood Lignin Fluorescence Spectra of Wood Cell Walls in Different Mounting Media. IAWA Journal 2012, 34, 3-19, 10.1163/22941932-00000002.
- Dimitrios Kapsokalyvas; Joachim Loos; Ilco A. L. A. Boogers; Maaike M. Appeldoorn; Mirjam Kabel; Marc Van Zandvoort; Quantification of morphochemical changes during in situ enzymatic hydrolysis of individual biomass particles based on autofluorescence imaging. Biopolymers 2019, 111, e23347, 10.1002/bip.23347.
- Lloyd Donaldson; Autofluorescence in Plants. Molecules 2020, 25, 2393, 10.3390/molecules25102393.
- Brian T DeVree; Lisa M Steiner; Sylwia Głazowska; Felix Ruhnow; Klaus Herburger; Staffan Persson; Jozef Mravec; Current and future advances in fluorescence-based visualization of plant cell wall components and cell wall biosynthetic machineries. Biotechnology for Biofuels 2021, 14, 1-26, 10.1186/s13068-021-01922-0.
- Eliana Capecchi; Davide Piccinino; Elisabetta Tomaino; Bruno Mattia Bizzarri; Francesca Polli; Riccarda Antiochia; Franco Mazzei; Raffaele Saladino; Lignin nanoparticles are renewable and functional platforms for the concanavalin a oriented immobilization of glucose oxidase–peroxidase in cascade bio-sensing. RSC Advances 2020, 10, 29031-29042, 10.1039/d0ra04485g.
- Lloyd A. Donaldson; Roger H. Newman; Alankar Vaidya; Nanoscale interactions of polyethylene glycol with thermo-mechanically pre-treatedPinus radiatabiofuel substrate. Biotechnology and Bioengineering 2013, 111, 719-725, 10.1002/bit.25138.
- L.A. Donaldson; K. Radotic; Fluorescence lifetime imaging of lignin autofluorescence in normal and compression wood. Journal of Microscopy 2013, 251, 178-187, 10.1111/jmi.12059.
- Raymond Wightman; Marta Busse-Wicher; Paul Dupree; Correlative FLIM-confocal-Raman mapping applied to plant lignin composition and autofluorescence. Micron 2019, 126, 102733, 10.1016/j.micron.2019.102733.
- Christine Terryn; Gabriel Paës; Corentin Spriet; FRET-SLiM on native autofluorescence: a fast and reliable method to study interactions between fluorescent probes and lignin in plant cell wall. Plant Methods 2018, 14, 1-10, 10.1186/s13007-018-0342-3.
- Vitor Carlos Coletta; Camila Alves Rezende; Fernando Rodrigues da Conceição; Igor Polikarpov; Francisco Eduardo Gontijo Guimarães; Mapping the lignin distribution in pretreated sugarcane bagasse by confocal and fluorescence lifetime imaging microscopy. Biotechnology for Biofuels 2013, 6, 43-43, 10.1186/1754-6834-6-43.
- Jonathan V. Rocheleau; David W. Piston; Two‐Photon Excitation Microscopy for the Study of Living Cells and Tissues. Current Protocols in Cell Biology 2003, 20, 4.11.1-4.11.15, 10.1002/0471143030.cb0411s20.
- Tiago A. Chimenez; Marcelo H. Gehlen; Karen Marabezi; Antonio A. S. Curvelo; Characterization of sugarcane bagasse by autofluorescence microscopy. Cellulose 2013, 21, 653-664, 10.1007/s10570-013-0135-9.
- Christine Terryn; Anouck Habrant; Gabriel Paës; Corentin Spriet; Measuring Interactions between Fluorescent Probes and Lignin in Plant Sections by sFLIM Based on Native Autofluorescence. Journal of Visualized Experiments 2020, Jan 2, e59925, 10.3791/59925.
- Ai-Yu Guo; Ya-Mei Zhang; Liu Wang; Di Bai; Ya-Peng Xu; Wen-Qiang Wu; Single-Molecule Imaging in Living Plant Cells: A Methodological Review. International Journal of Molecular Sciences 2021, 22, 5071, 10.3390/ijms22105071.
- Josué Hernández-Varela; José Chanona-Pérez; Héctor Calderón Benavides; Susana Gallegos Cerda; Lizbeth Gonzalez Victoriano; María De Jesús Perea Flores; Maximiliano Campos López; Liliana Edith Rojas Candelas; Benjamín Arrendondo Tamato; CLSM and TIRF images from lignocellulosic materials: garlic skin and agave fibers study. Microscopy and Microanalysis 2021, 27, 1730-1734, 10.1017/s1431927621006334.
- Gabriel Paës; Anouck Habrant; Christine Terryn; Fluorescent Nano-Probes to Image Plant Cell Walls by Super-Resolution STED Microscopy. Plants 2018, 7, 11, 10.3390/plants7010011.
- H. Blom; H. Brismar; STED microscopy: increased resolution for medical research?. Journal of Internal Medicine 2014, 276, 560-578, 10.1111/joim.12278.

