Your browser does not fully support modern features. Please upgrade for a smoother experience.
Submitted Successfully!
 +1 credit
Thank you for your contribution! You can also upload a video entry or images related to this topic.
For video creation, please contact our Academic Video Service.
Video Upload Options
We provide professional Academic Video Service to translate complex research into visually appealing presentations. Would you like to try it?
Cite
If you have any further questions, please contact Encyclopedia Editorial Office.
He, X. Two CONSTANS-like 16 Genes. Encyclopedia. Available online: https://encyclopedia.pub/entry/20624 (accessed on 27 July 2026).
He X. Two CONSTANS-like 16 Genes. Encyclopedia. Available at: https://encyclopedia.pub/entry/20624. Accessed July 27, 2026.
He, Xinhua. "Two CONSTANS-like 16 Genes" Encyclopedia, https://encyclopedia.pub/entry/20624 (accessed July 27, 2026).
He, X. (2022, March 16). Two CONSTANS-like 16 Genes. In Encyclopedia. https://encyclopedia.pub/entry/20624
He, Xinhua. "Two CONSTANS-like 16 Genes." Encyclopedia. Web. 16 March, 2022.
Copy Citation
CONSTANS (CO) is an important regulator of photoperiodic flowering and functions at a key position in the flowering regulatory network. Here, two CO homologs, MiCOL16A and MiCOL16B, were isolated from “SiJiMi” mango to elucidate the mechanisms controlling mango flowering. The MiCOL16A and MiCOL16B genes were highly expressed in the leaves and expressed at low levels in the buds and flowers. The expression levels of MiCOL16A and MiCOL16B increased during the flowering induction period but decreased during the flower organ development and flowering periods.
mango
CONSTANS
flowering
functional analysis
1. Introduction
In higher plants, floral transition is the process that describes the switch from the vegetative stage to the reproductive stage. The time for this process is referred to as flowering time. The flowering mechanism of the annual plant species Arabidopsis is thoroughly understood. According to recent research, the onset of flowering is regulated in a timely manner by an intricate network involving a series of regulatory pathways, such as gibberellin, photoperiod, autonomous, aging and vernalization pathways [1][2][3]. Of the many regulatory pathways, the photoperiod pathway is especially important; it is involved in plant responses to photoperiod sensing and subsequent molecular events [4].
Many photoperiod pathway-related genes have been discovered, such as TIME OF CAB EXPRESSION 1 (TOC1), LATE ELONGATED HYPOCOTYL (LHY), EARLY FLOWERING 4 (ELF4), GIGANTEA (GI), CIRCADIAN CLOCK ASSOCIATED 1 (CCA1), FLOWERING LOCUS T (FT) and CONSTANS (CO) [5]. Among them, CO is a key component of which there are orthologs in various plant species [6][7][8][9]. Currently, CYCLING DOF FACTOR (CDF) is known as the only transcription factor that directly binds to the CO promoter and suppresses the expression of CO [10][11][12]. The GI gene plays a key role in the photoperiod induction pathway and positively regulates the expression of the CO gene under long-day conditions [13]. Overexpression of the FLOWERING BHLH (FBH) gene elevates CO levels without being affected by photoperiod [14]. In addition, phytochrome-interacting factors (PIFs) interact with CO to suppress flowering [15]. The E3 ubiquitin ligase-encoding gene HIGH EXPRESSION OF OSMOTICALLY RESPONSIVE GENES1 (HOS1) is involved in controlling the abundance of CO, and CONSTITUTIVE PHOTOMORPHOGENIC1 (COP1), as a flowering repressor, is regulated by cryptochromes (CRY) and promotes the proteolysis of CO in the dark [16][17]. CO genes belong to the BBX family and can be divided into three categories according to their domains in Arabidopsis [7][18]. Group I genes have one CO, CO-like, and TOC1 (CCT) domain and two B-box domains; group II genes have one B-box and one CCT domain; and group III genes have one B-box, one variant B-box and one CCT domain.
However, the functions of CO orthologs vary across different species. In Arabidopsis, overexpression of the AtCO, AtCOL5 and AtCOL16 genes promotes flowering under long-day (LD) or short-day (SD) conditions [19][20], but AtCOL7, AtCOL8 and AtCOL9 inhibit flowering under LD conditions [21][22]. In rice, the OsHd1 gene delays flowering under LD conditions and promotes flowering under SD conditions [23], and OsCOL16 inhibits flowering under both SD and LD conditions [24]. StCO, a CO homolog in potato, regulates flowering [25]. Moreover, the CO orthologs in Fuji apple, MdCOL1 and MdCOL2, play a significant role in the growth and development of reproductive organs [26]. Thus, homologous CO genes have a wide range of effects on plant flowering and development.
Mango (Mangifera indica L.) is a member of the Anacardiaceae family and is an economically important fruit tree species. Flowering time has a considerable influence on the yield and quality of mango. Therefore, the discovery and identification of flowering-related genes are necessary for mango production. Mango flowering is the result of a complex process influenced by many factors, but it is not affected by daylength [27]. Several flowering-related regulatory genes have recently been identified in mango. For example, the MiFT, MiSOC1 and MiAP1 genes promote flowering, but the MiCO gene inhibits flowering in Arabidopsis [28][29][30][31]. However, the COL16 gene has not been studied in mango.
2. Isolation and Analysis of MiCOL16A and MiCOL16B
Two CO homologs, MiCOL16A (GenBank No: MW326761) and MiCOL16B (GenBank No: MW326762), were identified from M. indica. L. cv. SiJiMi. The full cDNA sequences of MiCOL16A and MiCOL16B were 1269 bp and 1251 bp, encoding 423 and 417 amino acids, respectively; the two genes were 73.06% identical. The DNA sequences of MiCOL16A and MiCOL16B were 2030 bp and 1751 bp, respectively, and each contained one intron (Figure 1A). The alignment of MiCOL16A and MiCOL16B indicated that both have one CCT and one B-box domain and are highly conserved with other genes (Figure 1B). Phylogenetic analysis showed that these two genes were highly identical to Arabidopsis AtCOL6 and AtCOL16 in group II (Figure 1C). Therefore, these results indicated that MiCOL16A and MiCOL16B belong to group II genes of the CO gene family.
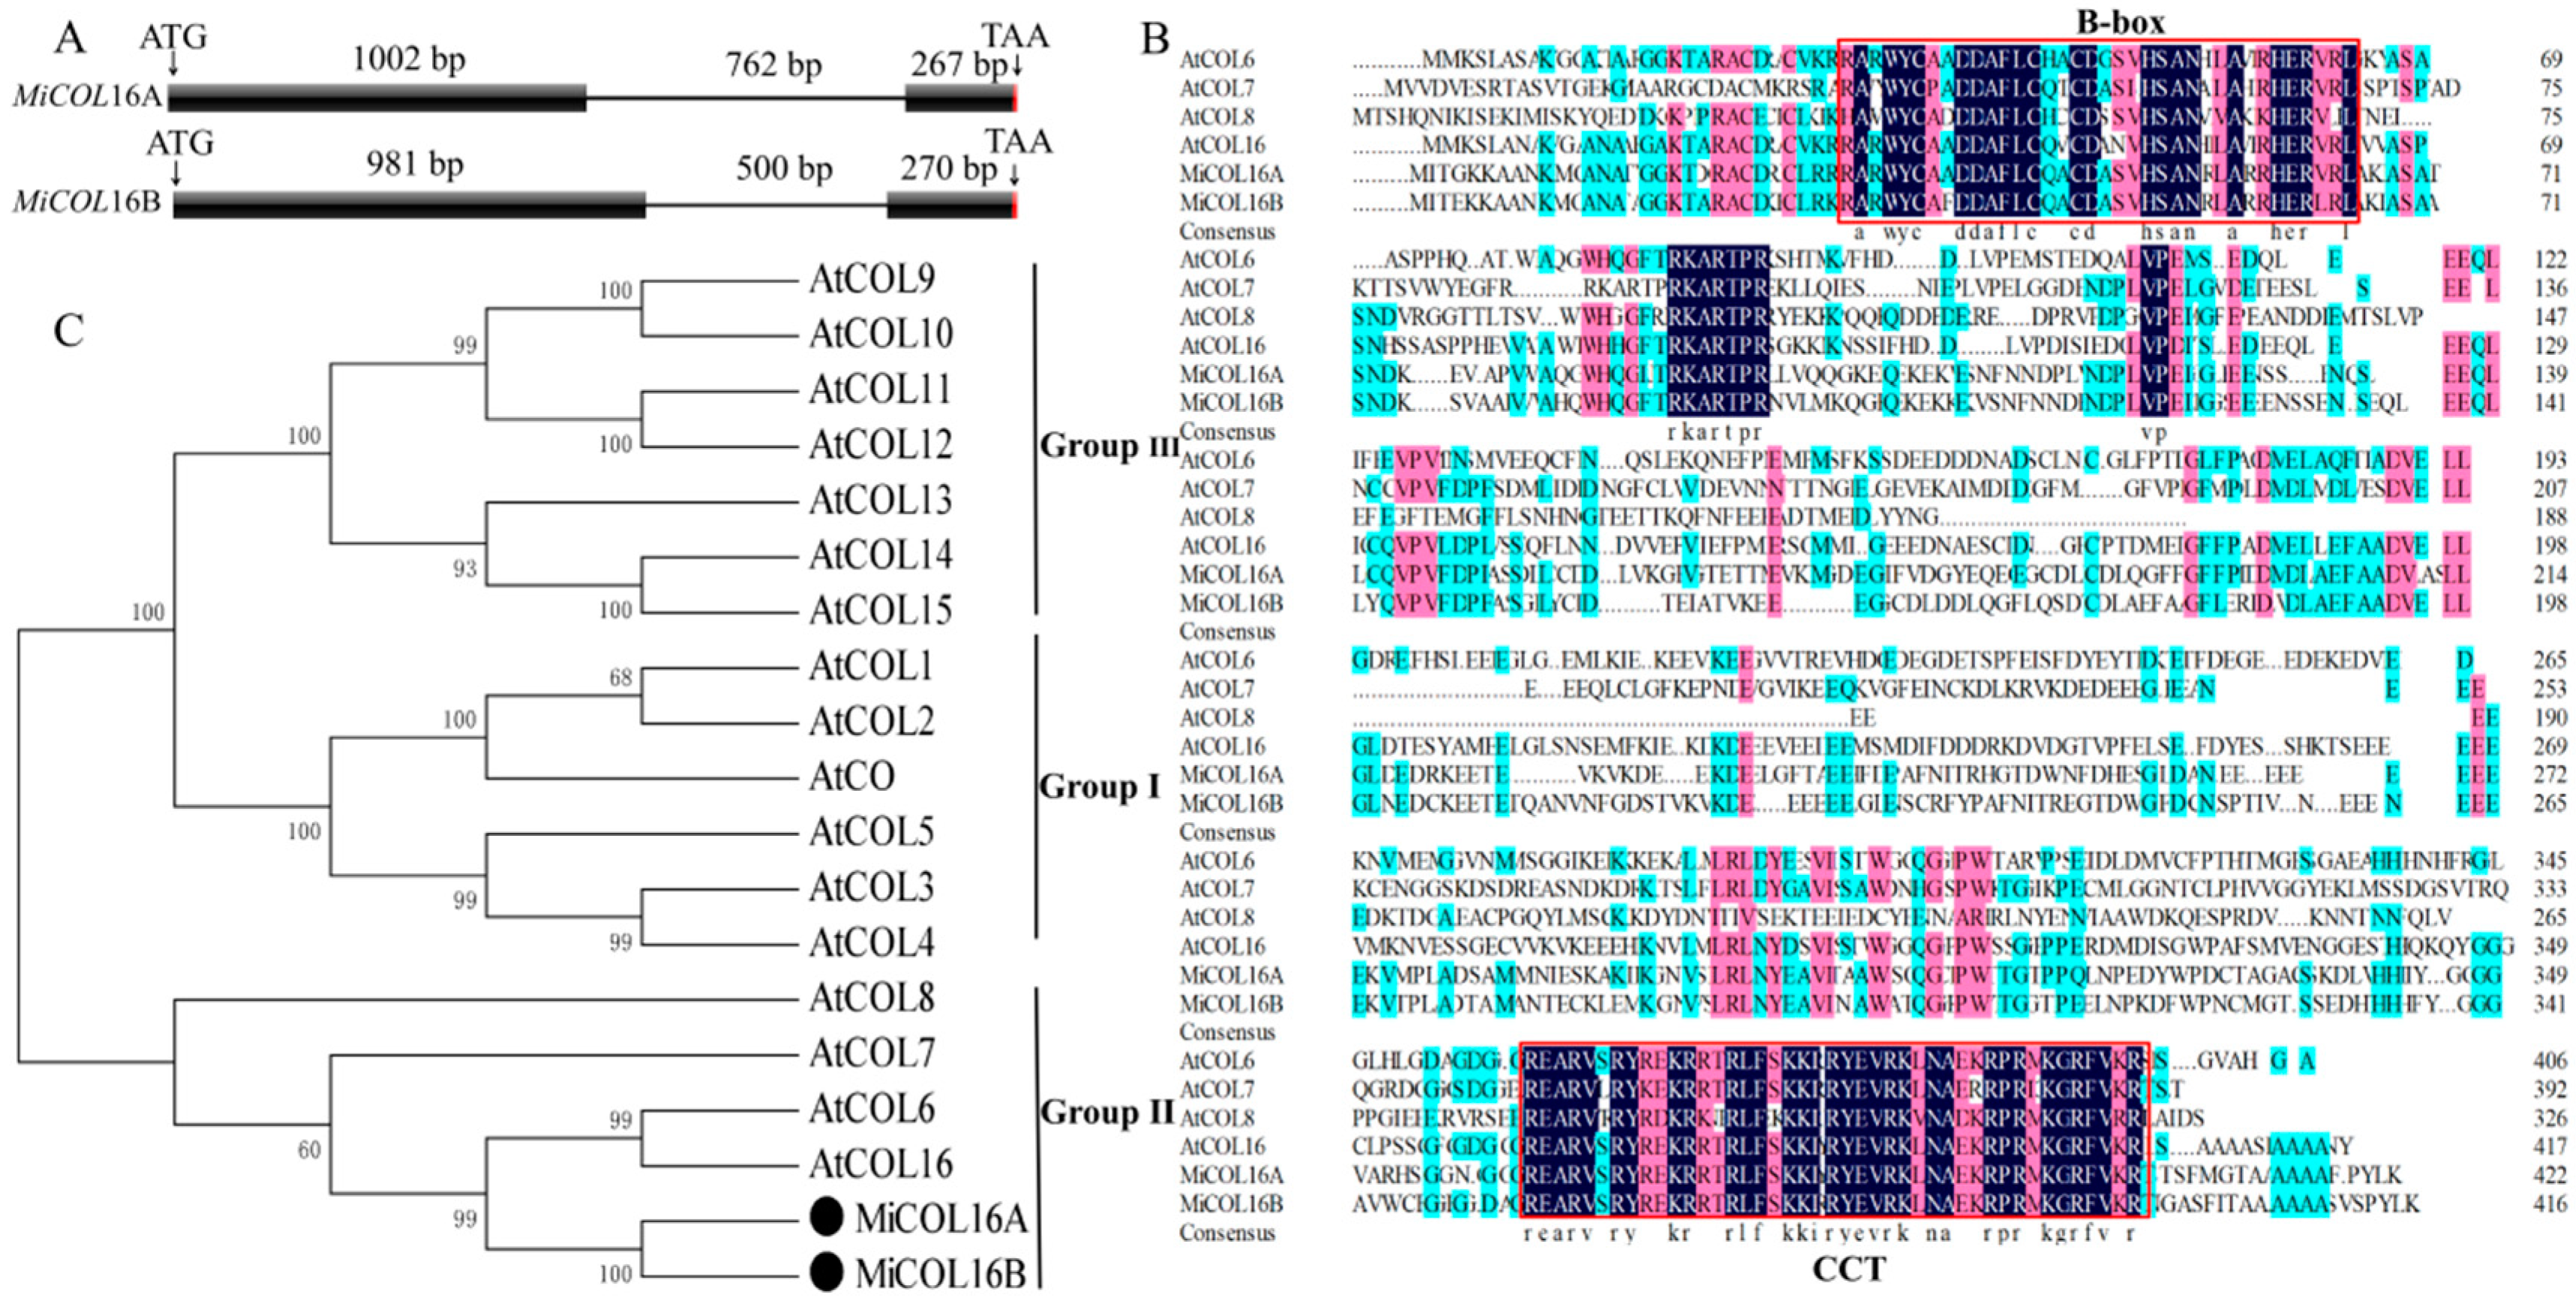
Figure 1. Sequence analysis of MiCOL16A and MiCOL16B. (A) Genomic structures of MiCOL16A and MiCOL16B. Exons are represented by black squares, and introns are represented by black lines. The numbers indicate the lengths of the corresponding regions. (B) Alignment of the predicted amino acid sequences of AtCOL6–8 and AtCOL16 in Arabidopsis and of MiCOL16A and MiCOL16B in mango. The conserved CCT and B-box domain regions are indicated with red boxes. The dark color indicates that the amino acids are 100% conserved. (C) Phylogenetic relationship of CO/COL proteins in Arabidopsis and mango. MiCOL16A and MiCOL16B are represented by black solid circles.
3. Expression of MiCOL16A and MiCOL16B in Mango
For the tissue-specific expression tests, qRT–PCR was performed. The results showed that MiCOL16A and MiCOL16B were expressed in all the tested tissues. On different branches, the expression levels of MiCOL16A and MiCOL16B in the leaves were always higher than those in the stems, buds or flowers, and the lowest expression levels of MiCOL16A and MiCOL16B were detected in the buds and flowers. In contrast, the expression level of MiCOL16A in the leaves of nonflowering branches was higher than that in the leaves of flowering branches (Figure 2A), but MiCOL16B expression was lower in the leaves of nonflowering branches than in those of flowering branches (Figure 2B).
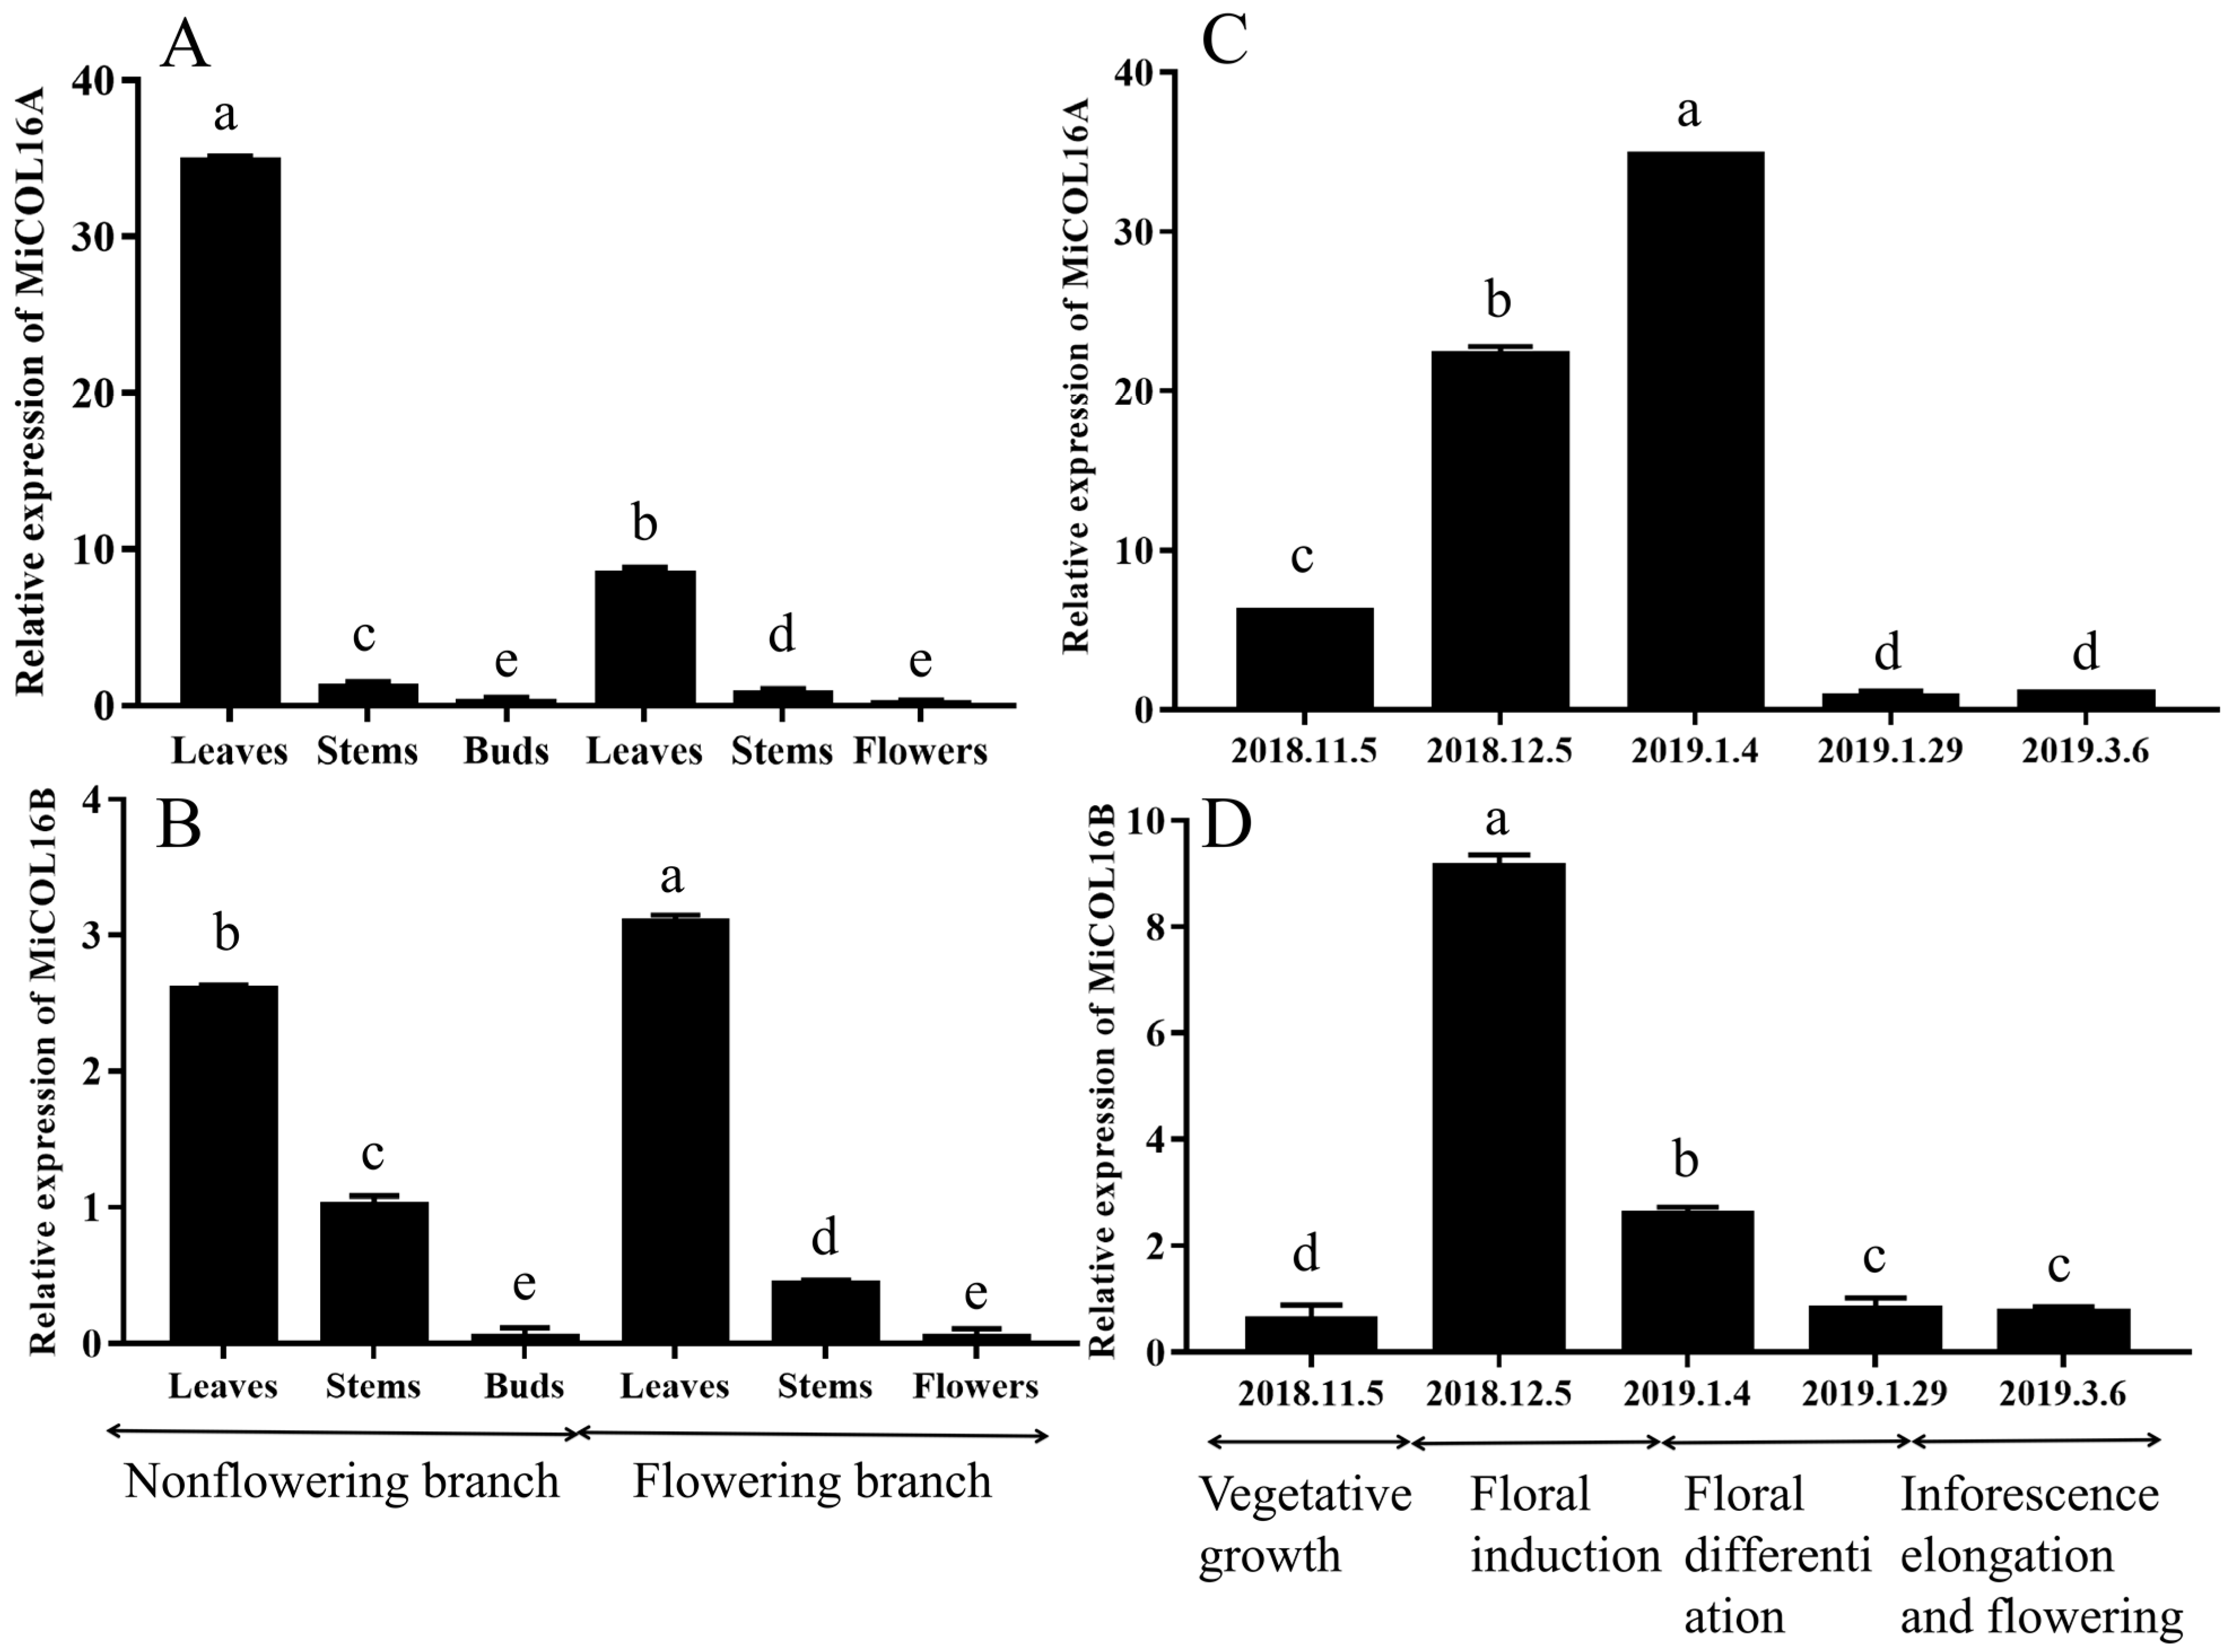
Figure 2. Tissue-specific and temporal expression analysis of the MiCOL16A and MiCOL16B genes. (A,B) Expression patterns of the MiCOL16A and MiCOL16B genes in different tissues of SiJiMi mango. (C,D) Expression patterns of the MiCOL16A and MiCOL16B genes at different time points.
To analyze the temporal expression patterns of MiCOL16A and MiCOL16B, qRT–PCR was performed. The results suggested that the two target genes were expressed in the leaves of mango at all tested periods. The expression pattern of MiCOL16A gradually increased from vegetative growth to the late floral induction period and then decreased (Figure 2C). However, MiCOL16B gene expression increased from the vegetative growth period to the early floral induction period and then decreased (Figure 2D).
The circadian-driven expression of MiCOL16A and MiCOL16B was determined using total RNA isolated from ‘SiJiMi’ mango leaves, which were collected every 3 h for three days. The results suggested that under LD conditions, the expression level of MiCOL16A started to increase after dusk, peaked 6 h after dusk and decreased rapidly thereafter before beginning to increase again after dusk (Figure 3A). Interestingly, this pattern also appeared under MD and SD conditions, and this result proved that MiCOL16A expression may be induced by night treatment and is not affected by the length of light (Figure 3C,E). The expression level of MiCOL16B fluctuated with time under different conditions, but there was no regularity. These results suggest that MiCOL16A expression exhibits a diurnal oscillation rhythm, but MiCOL16B expression is not affected by a diurnal rhythm (Figure 3B,D,F).
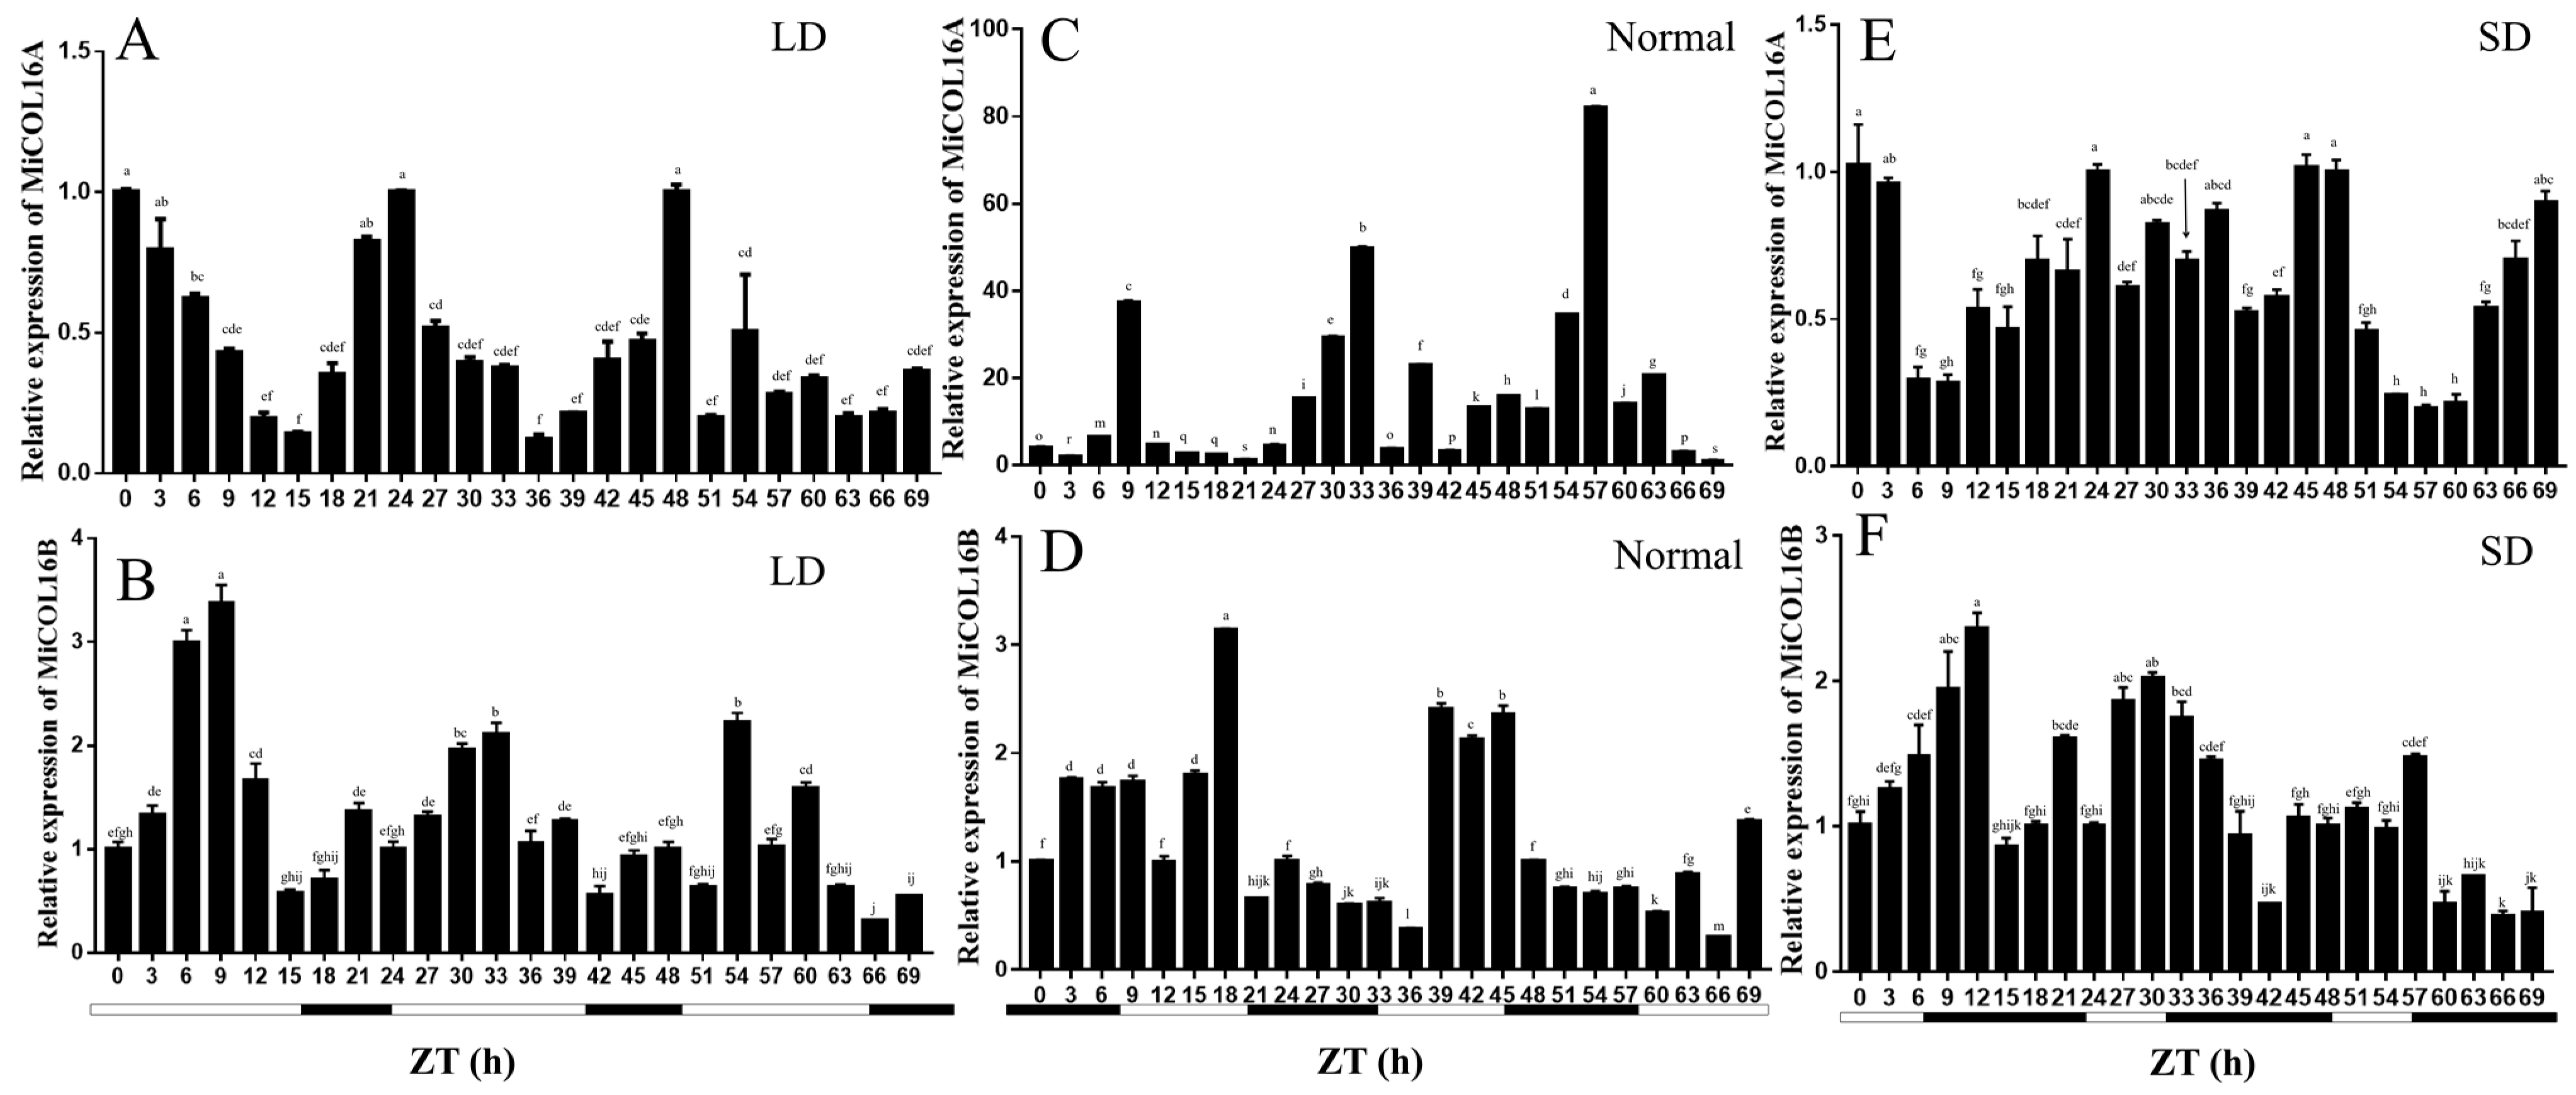
Figure 3. Expression analysis of the MiCOL16A and MiCOL16B genes in terms of circadian rhythm. (A,C,E) Expression patterns of MiCOL16A under LD (A), normal (C) and SD (E) conditions. (B,D,F) Expression patterns of MiCOL16B under LD (B), normal (D) and SD (F) conditions.
4. Both MiCOL16A and MiCOL16B Are Nuclear Proteins with Transcriptional Activation Activity
MiCOL16A and MiCOL16B protein-linked GFP fusion constructs driven by the CaMV 35S promoter were developed for molecular function assays. The GFP fusion constructs were inserted into vectors, which were transferred into onion inner epidermal cells. Single-strand analysis indicated that free GFP localized to the nucleus and cytomembrane, and both the MiCOL16A and MiCOL16B proteins localized to the nucleus (Figure 4A).
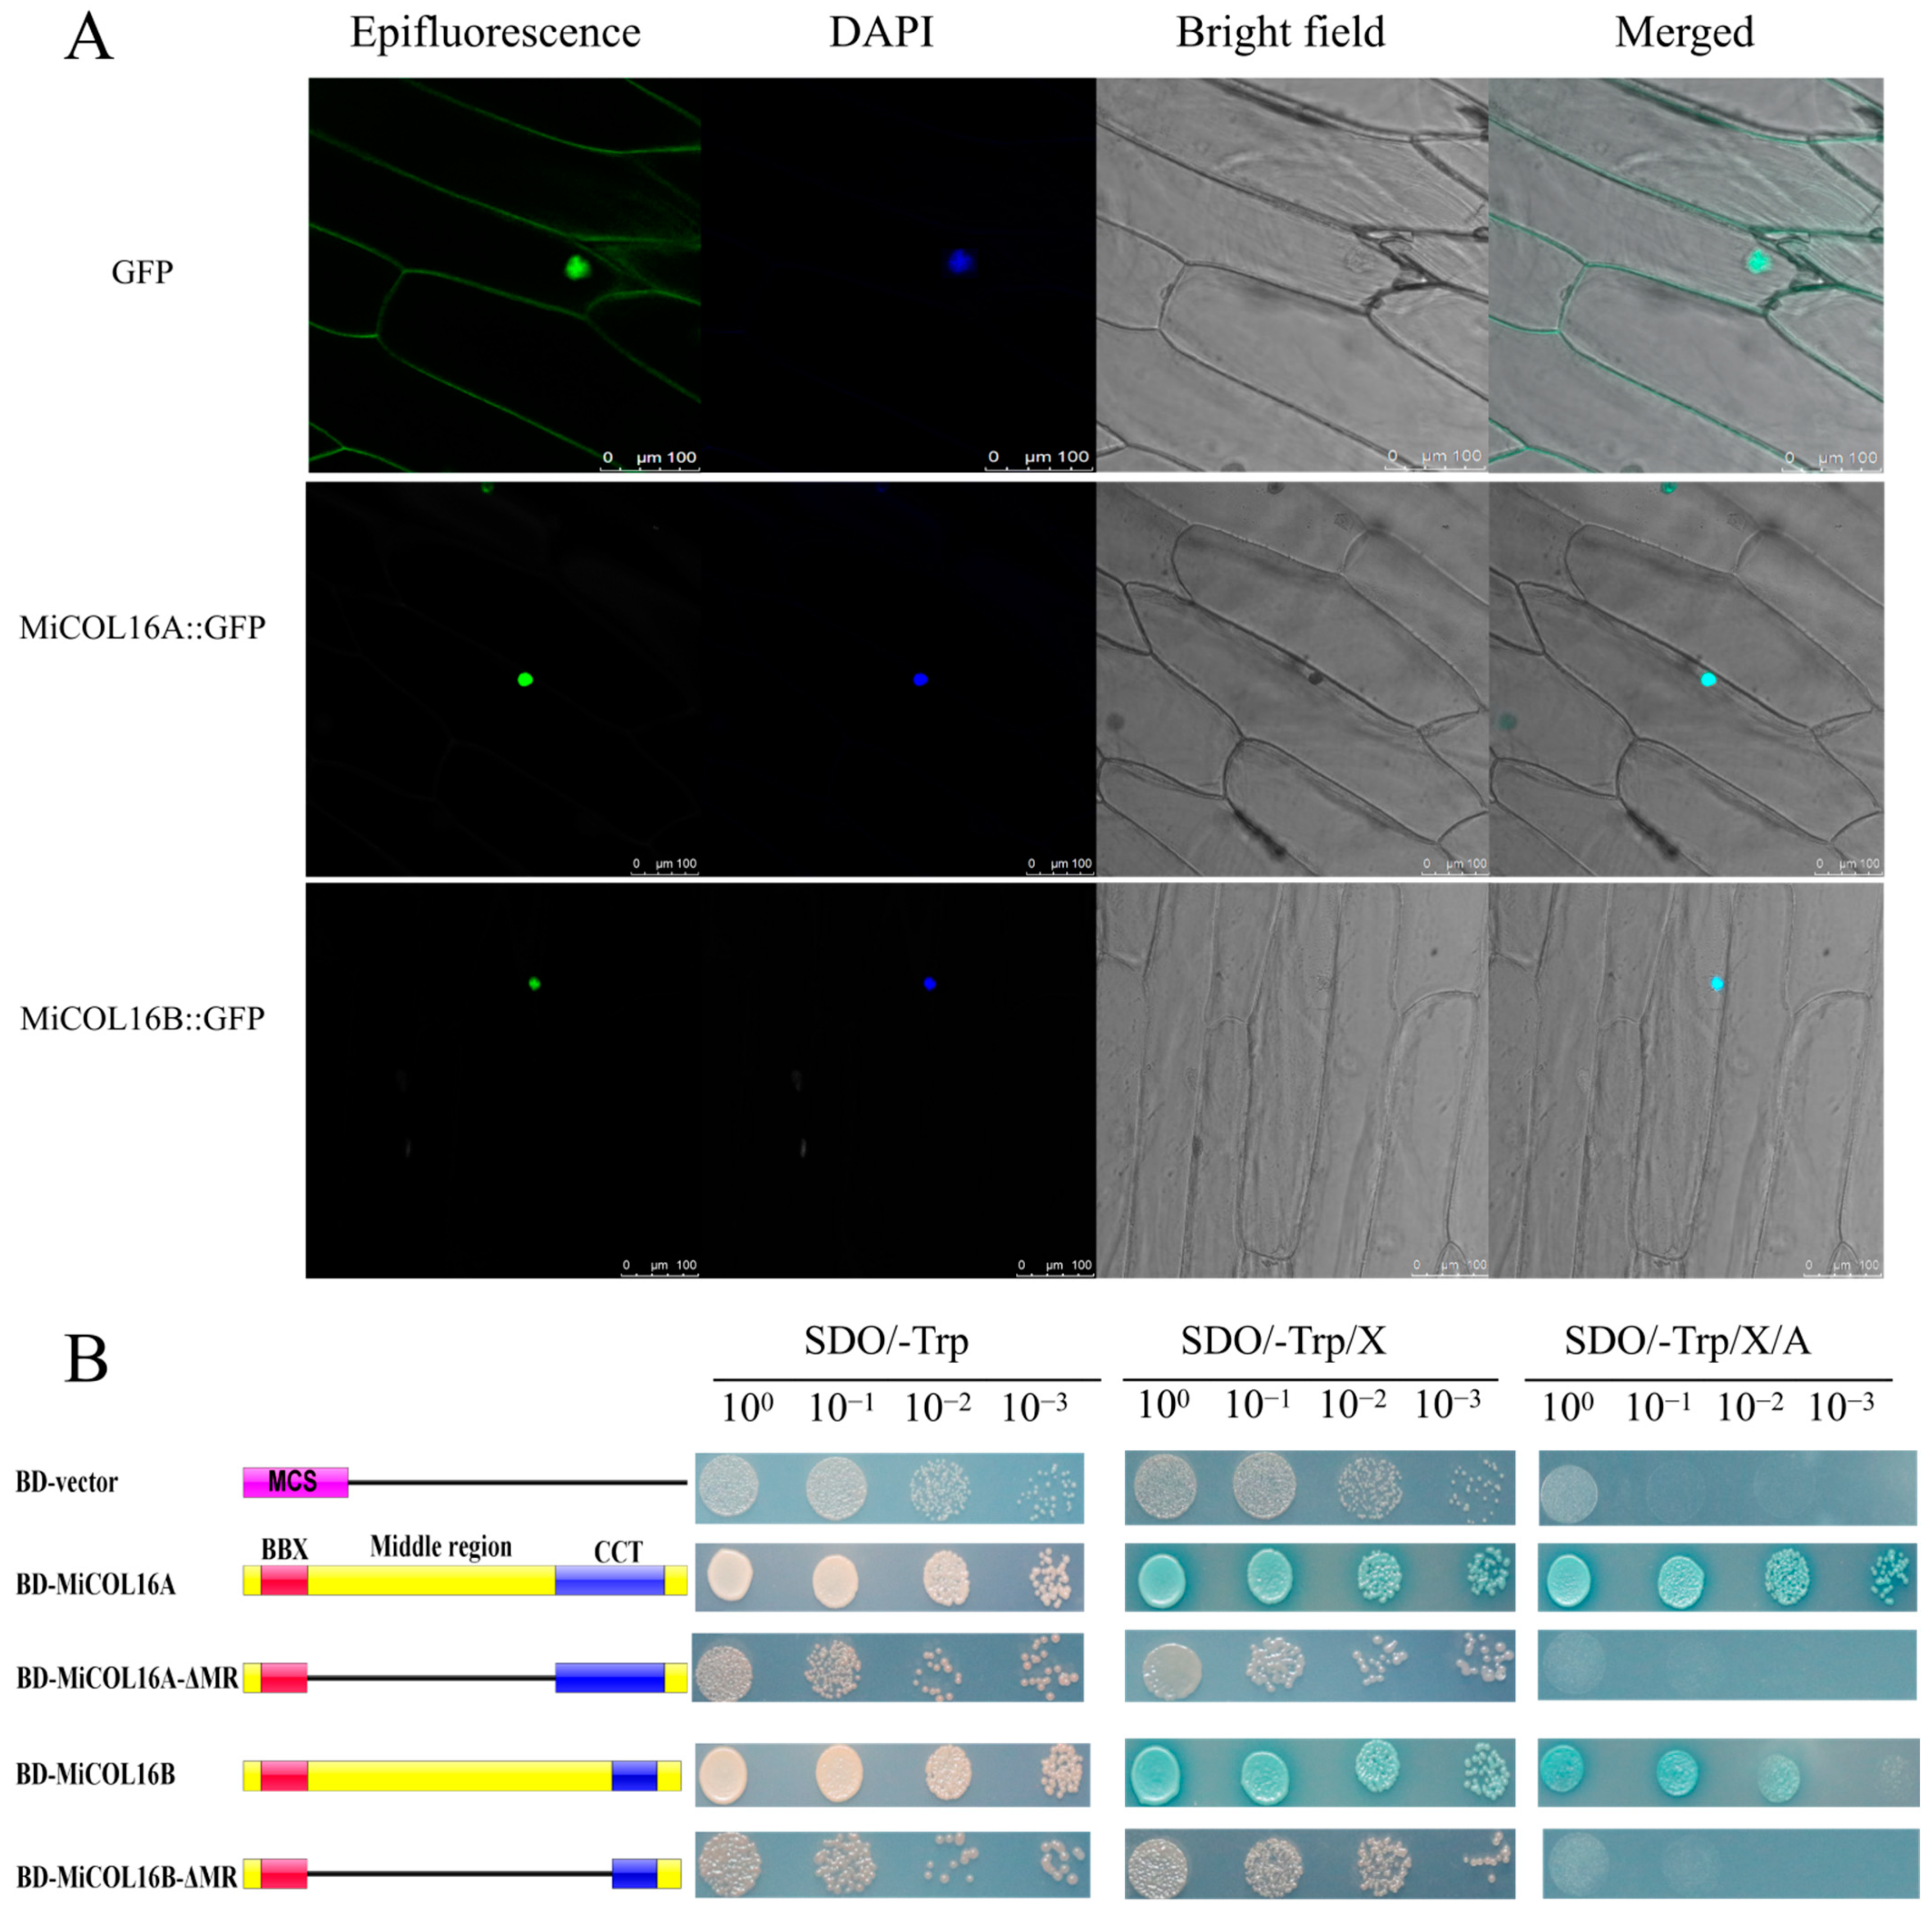
Figure 4. (A) Subcellular localization. Scale bars = 100 µm. (B) Transcriptional activation activity. The left diagram shows various constructs. MCS, multiple cloning sites; BD, GAL4-DNA binding domain; BBX, B-box; CCT, CO, CO-like, TOC1; MR, middle region.
A transcriptional activity assay was performed in yeast cells to demonstrate whether MiCOL16A or MiCOL16B had transcriptional activation activity. According to a previous study, the MR between the B-BOX and CCT domains is required for CO transcriptional activity [24][32][33]. Thus, MiCOL16A, MiCOL16B, MiCOL16A-ΔMR and MiCOL16B-ΔMR were fused into a pGBKT7 vector, and an empty pGBKT7 vector was used as a control. The five different plasmids were transferred into yeast cells, which were then transferred onto different plates. Three days later, all the transformants grew equally well on selective SD/-Trp media. On these three selective media, the BD-MiCOL16A and BD-MiCOL16B transformants grew well and turned blue, but the yeast transformed with the BD-vector, BD-MiCOL16A-ΔMR and BD-MiCOL16B-ΔMR grew only on SD/-Trp/X-α-gal plates and did not turn blue (Figure 4B). Together, α-gal activity could not be detected when the MR region was deleted. These results showed that through their MR domains, MiCOL16A and MiCOL16B have transcriptional activation activity in yeast.
5. Overexpression of MiCOL16A and MiCOL16B Delayed Flowering in Arabidopsis
To determine whether MiCOL16A and MiCOL16B are involved in the regulation of flowering time, they were overexpressed in Arabidopsis (under the control of the CaMV 35S promoter). Researchers obtained 15 and 10 independent transgenic lines of MiCOL16A and MiCOL16B, respectively, and researchers selected three homozygous lines for each construct from within the T3 generation and planted them under LD or SD conditions. The PCR analysis results showed that MiCOL16A and MiCOL16B were expressed in the transgenic plants but not in the WT or empty vector-transformed Arabidopsis plants under LD (Figure 5(A1,B1)) or SD conditions (Figure 6(A1,B1)). Under LD and SD conditions, both the MiCOL16A and MiCOL16B transgenic lines flowered later than the WT and empty vector-transformed plants. At flowering, compared with the WT and empty vector-transformed plants, the MiCOL16A and MiCOL16B transgenic plants had more rosette leaves (Figure 5 and Figure 6) (Table 1).
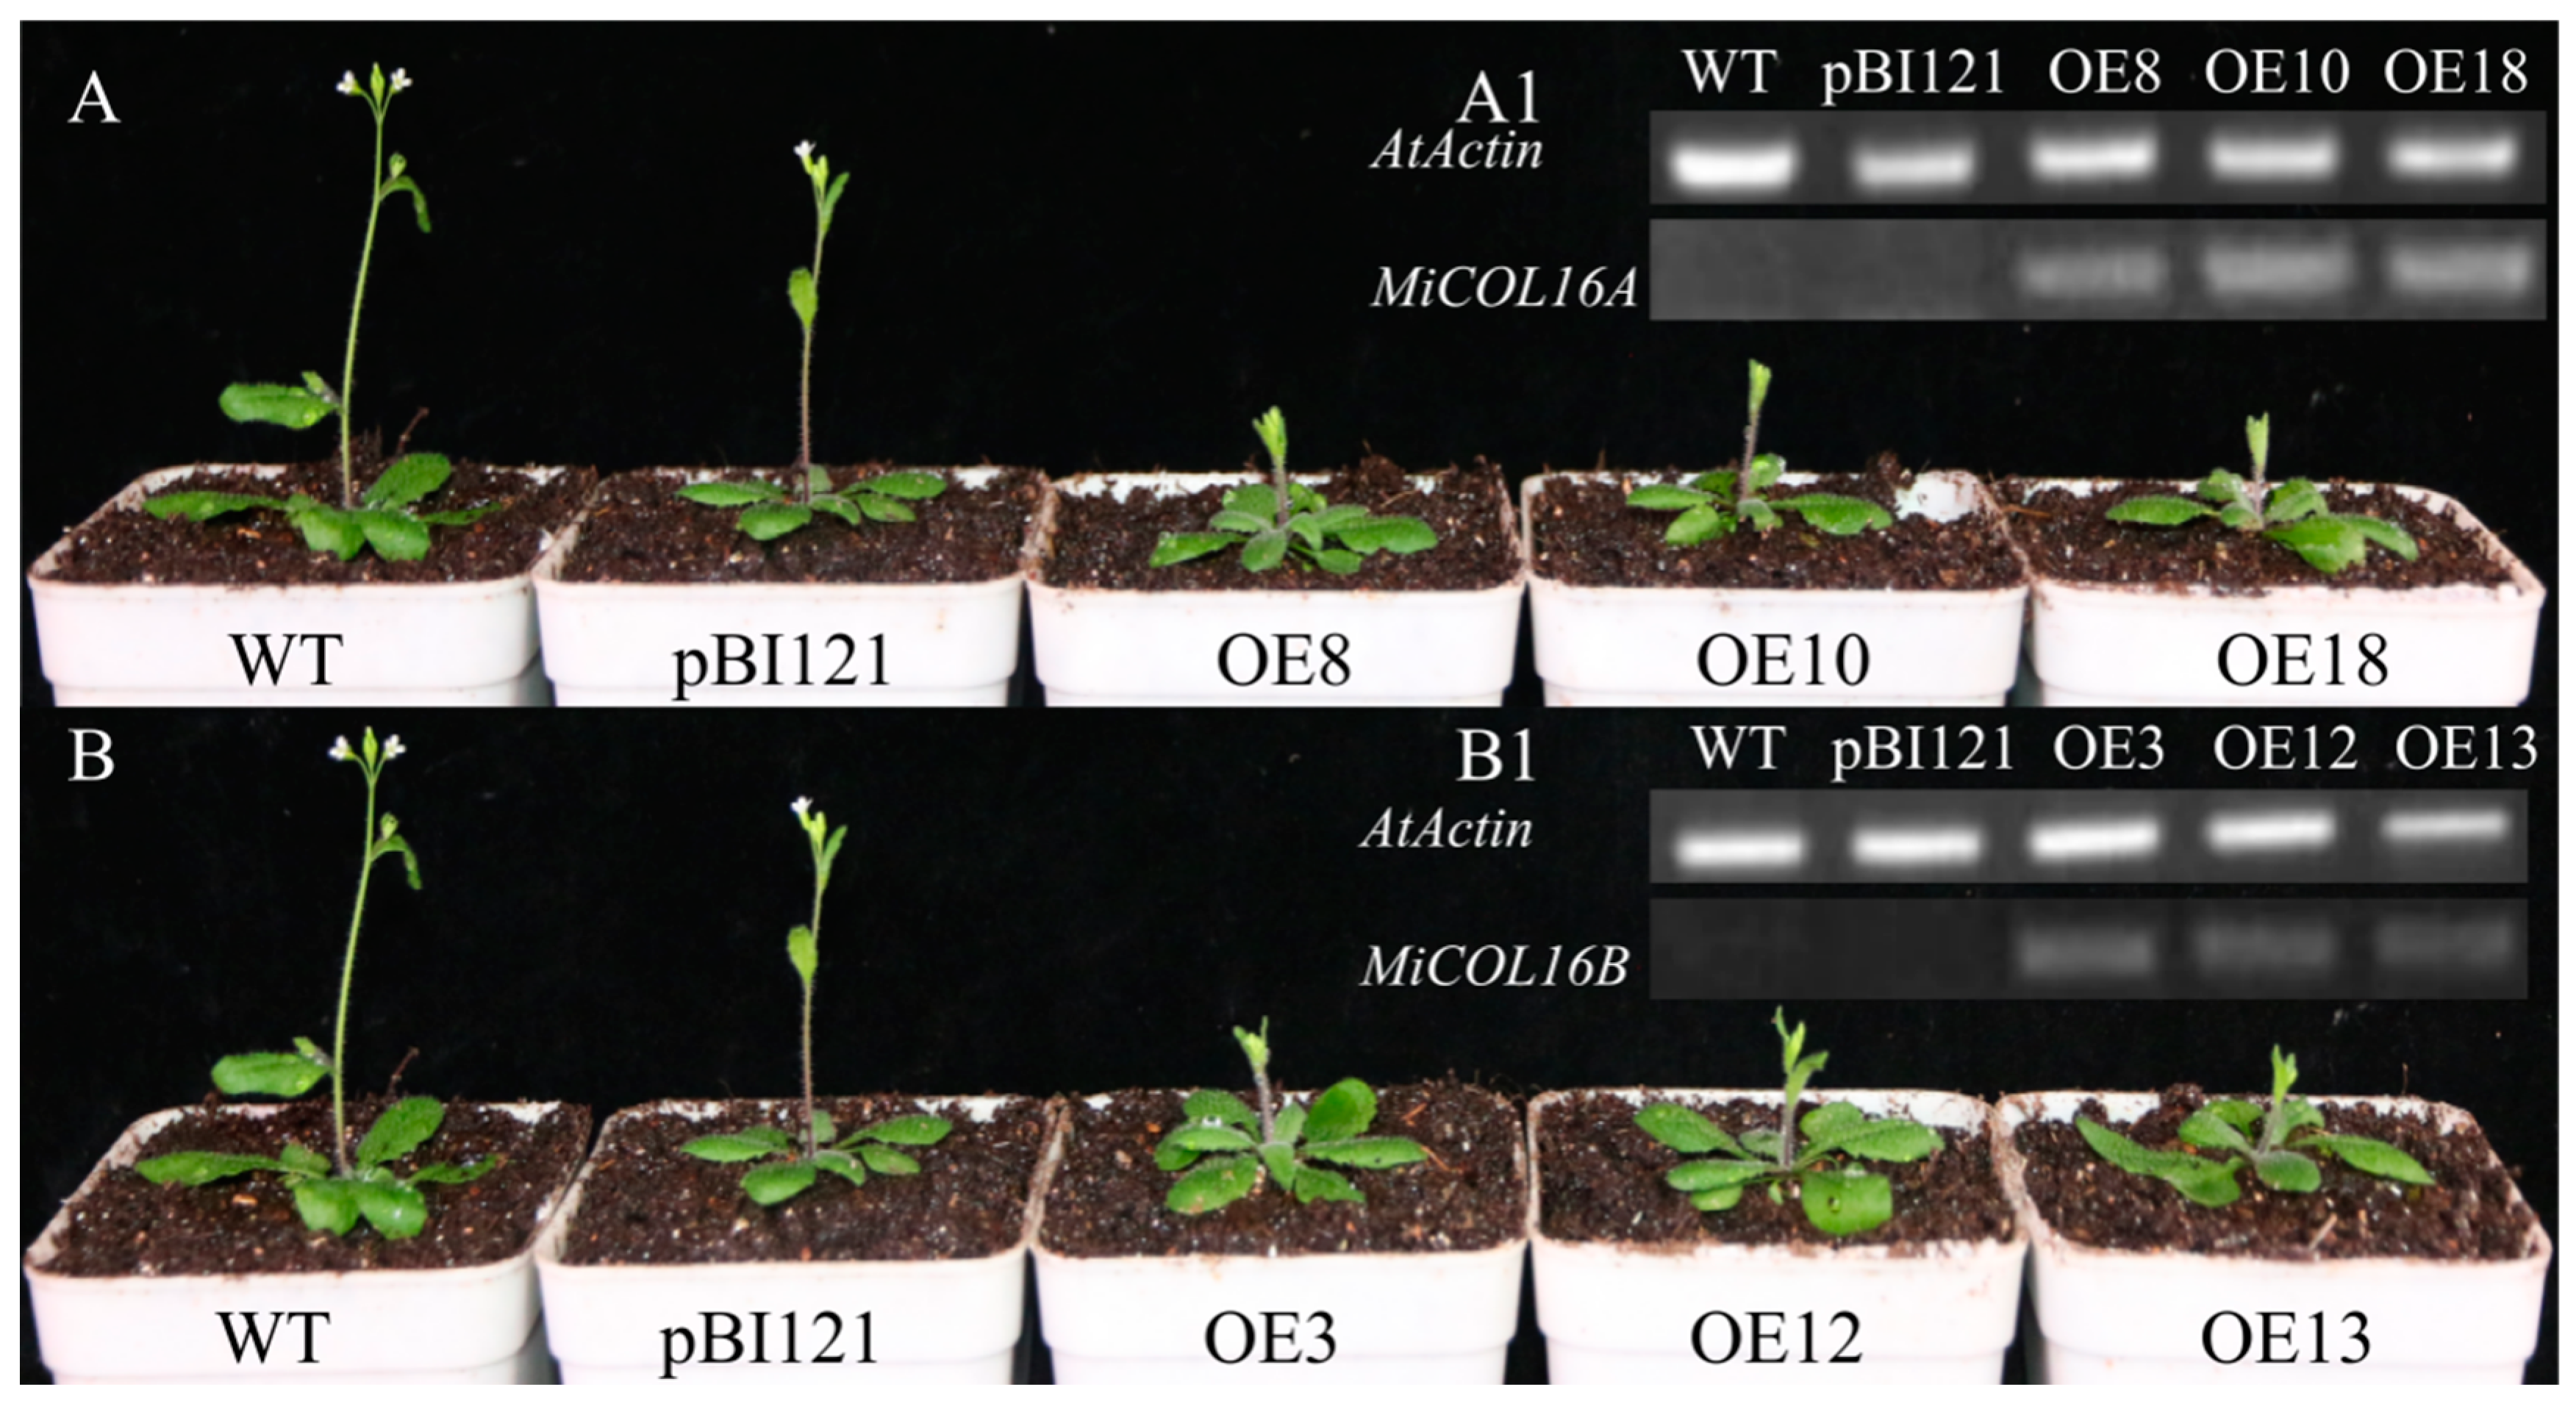
Figure 5. Ectopic expression of MiCOL16A and MiCOL16B delayed flowering under LD conditions. (A1,B1) Expression of MiCOL16A (A1) and MiCOL16B (B1) in the WT, empty vector-transformed and overexpression plants. (A) MiCOL16A transgenic Arabidopsis plants under LD conditions. (B) MiCOL16B transgenic Arabidopsis plants under LD conditions.
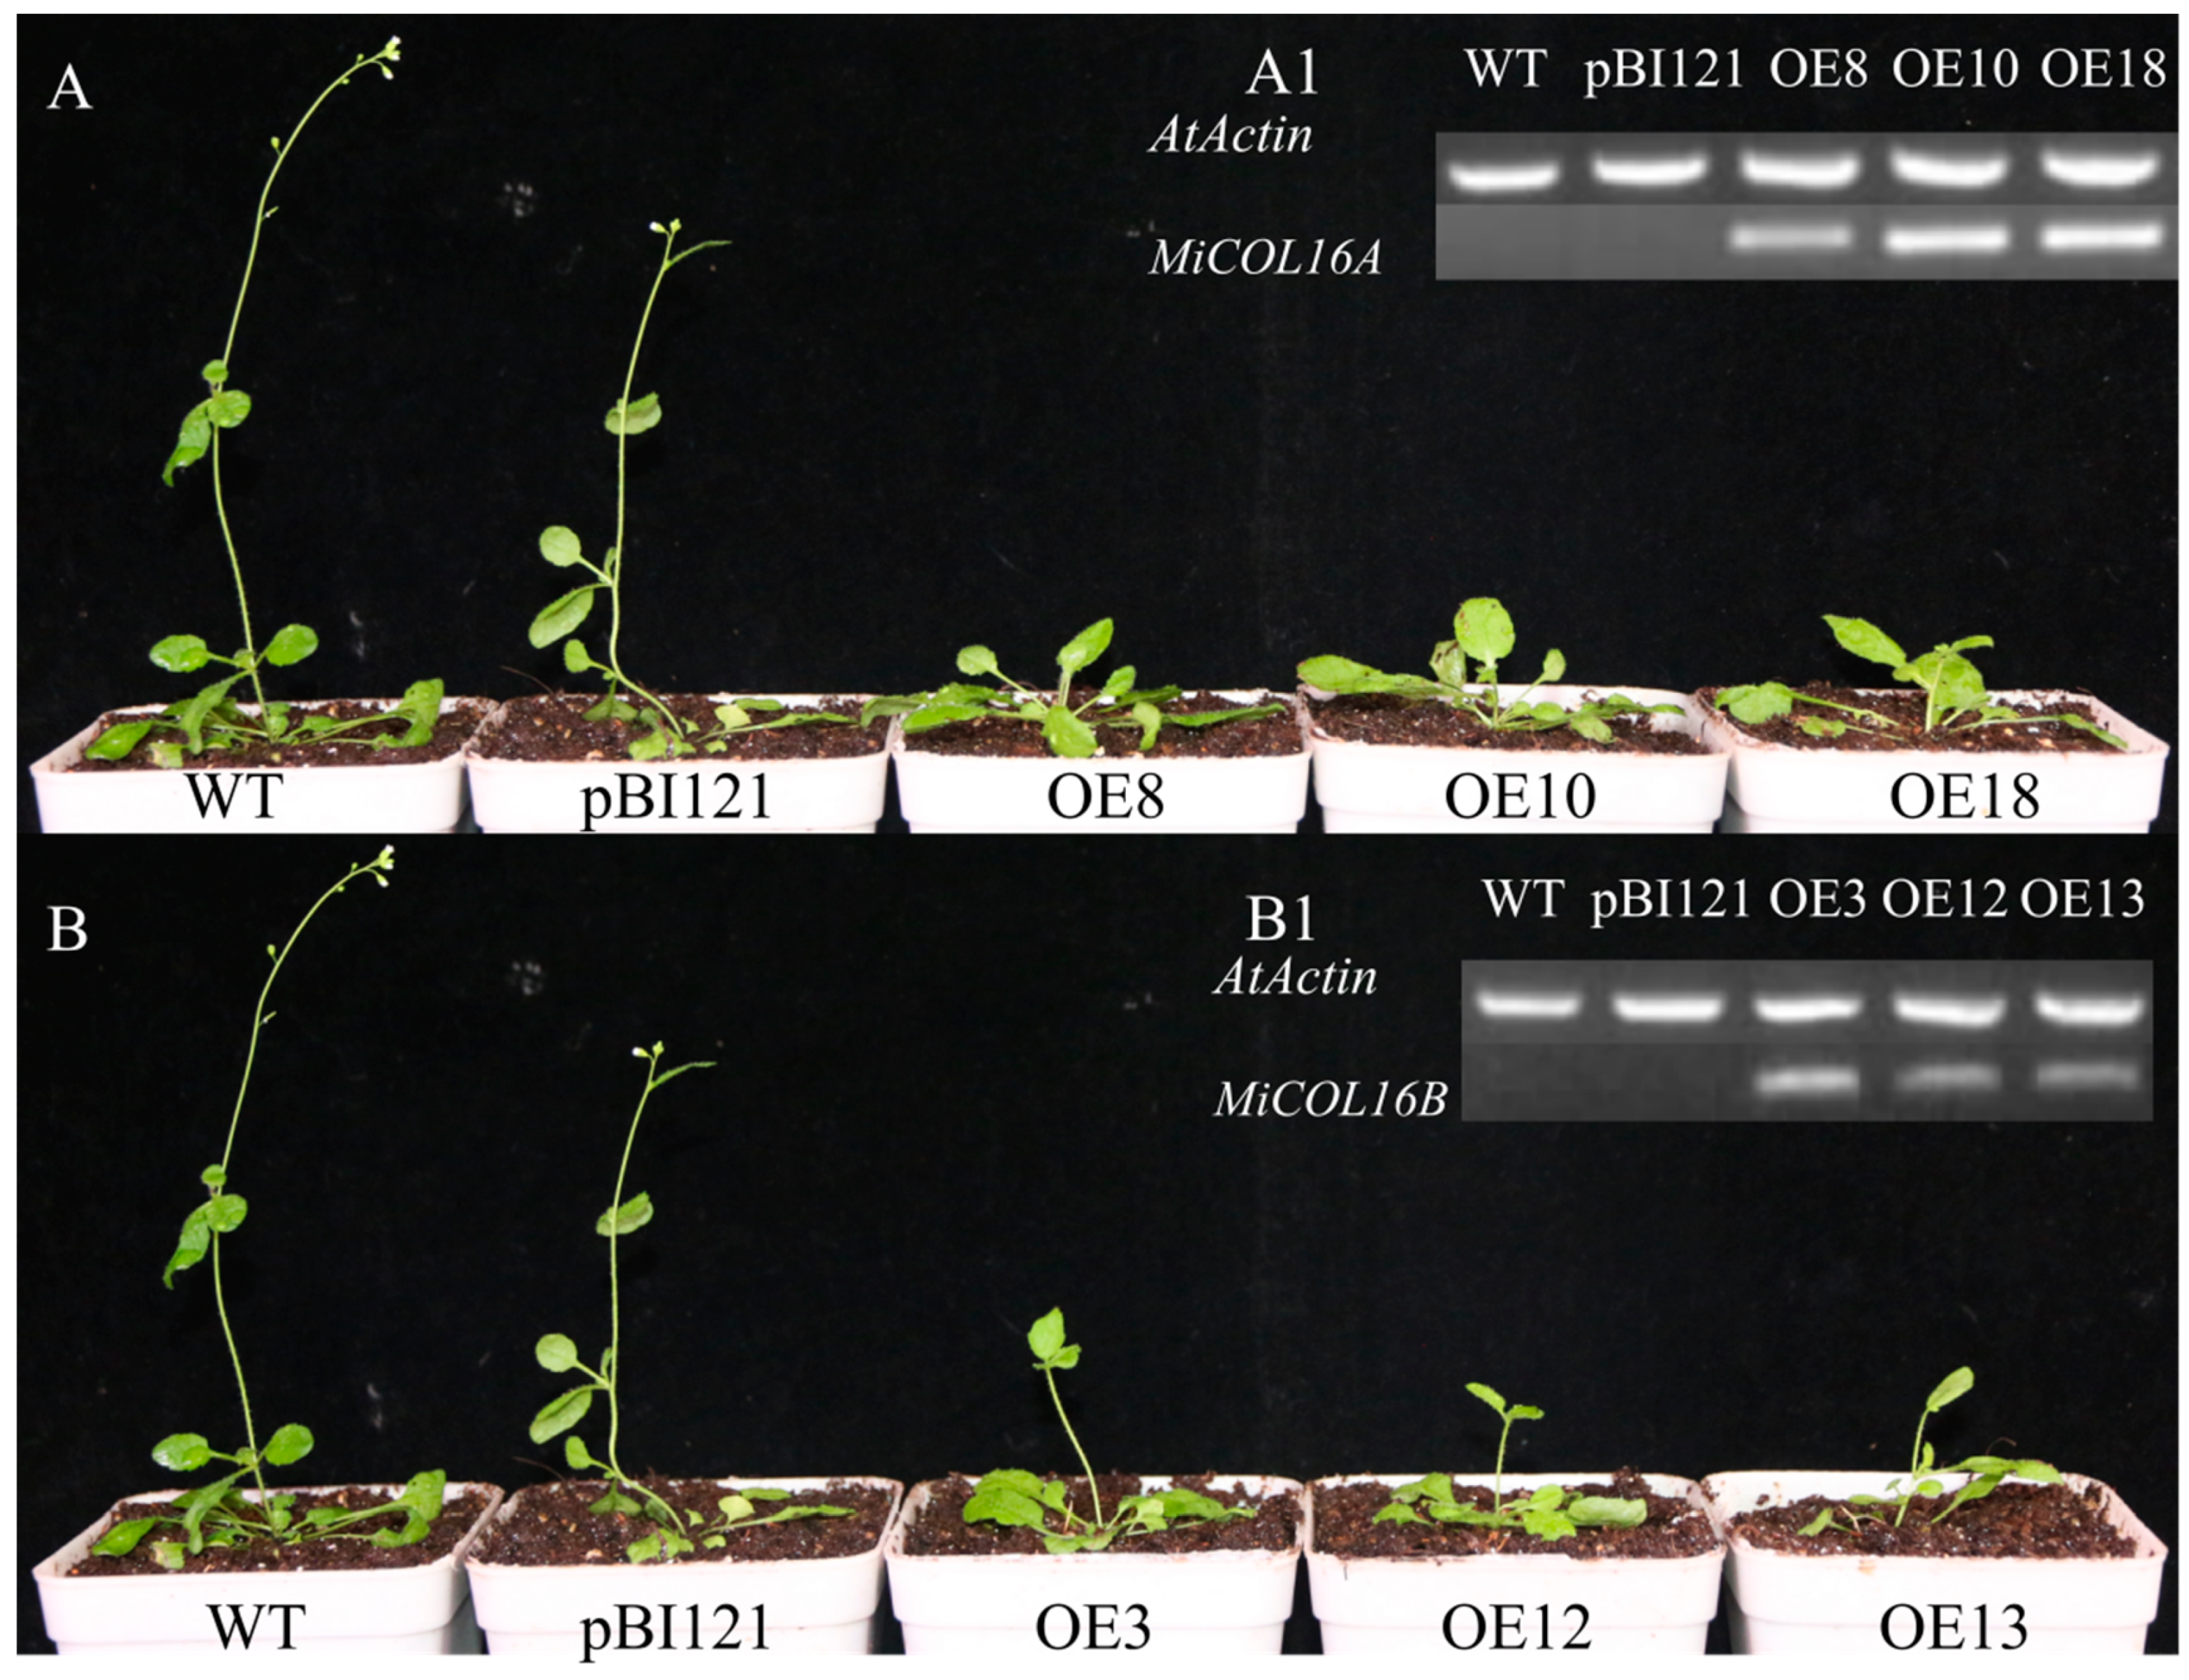
Figure 6. Ectopic expression of MiCOL16A and MiCOL16B delayed flowering under SD conditions. (A1,B1) Expression of MiCOL16A (A1) and MiCOL16B (B1) in the WT, empty vector-transformed and overexpression plants. (A) MiCOL16A transgenic Arabidopsis plants under SD conditions. (B) MiCOL16B transgenic Arabidopsis plants under SD conditions.
Table 1. Overexpression of MiCOL16A and MiCOL16B repressed flowering in Arabidopsis.
| ID | Days to Flowering | No. Rosette Leaves | Plant Height a (cm) | |||
|---|---|---|---|---|---|---|
| LD | SD | LD | SD | LD | SD | |
| WT | 24.8 ± 0.6 | 50.1 ± 0.8 | 5.5 ± 0.5 | 7.2 ± 0.3 | 6.4 ± 0.8 | 11.4 ± 0.6 |
| pBI121 | 25.6 ± 0.4 | 49.6 ± 0.7 | 7.6 ±0.6 | 7.0 ± 0.5 | 6.7 ± 0.4 | 11.7 ± 0.4 |
| MiCOL16A | ||||||
| OE2 | 28.0 ± 0.3 * | 51.3 ± 0.8 | 6.3 ± 0.4 | 7.6 ± 0.3 | 4.6 ± 1.1 * | 14.2 ± 0.9 * |
| OE8 | 28.0 ± 0.5 * | 52.8 ± 0.2 * | 6.8 ± 0.6 * | 7.3 ± 0.7 | 4.5 ± 0.6 * | 14.2 ± 0.8 * |
| OE10 | 28.1 ± 0.8 * | 52.8 ± 0.3 * | 7.5 ± 1.0 * | 7.3 ± 0.5 | 6.2 ± 1.1 | 13.0 ± 0.3 * |
| MiCOL16B | ||||||
| OE3 | 27.6 ± 0.5 * | 53.0 ± 0.4 * | 6.6 ± 0.7 * | 7.4 ± 0.6 | 4.7 ± 1.0 * | 17.7 ± 1.1 * |
| OE12 | 26.9 ± 0.8 * | 51.2 ± 0.9 | 7.1 ± 0.5 * | 7.3 ± 0.4 | 5.2 ± 1.1 * | 17.1 ± 1.0 * |
| OE13 | 28.4 ± 0.5 * | 51.5 ± 0.4 * | 6.7 ± 0.7 * | 6.6 ± 0.6 | 4.3 ± 0.8 * | 13.4 ± 0.2 * |
a Plant height was measured at the time of flowering. Significant differences among the samples were assessed at the p < 0.05 (*) level by Student’s t tests.
To further dissect the expression patterns of the floral integrator genes in the MiCOL16A and MiCOL16B overexpression lines, the transcript levels of AtFT and AtSOC1 were measured in the WT and overexpression plants under LD or SD conditions (Figure 7). The results showed that both MiCOL16A and MiCOL16B significantly repressed the expression of AtSOC1 and AtFT in Arabidopsis under LD and SD conditions.
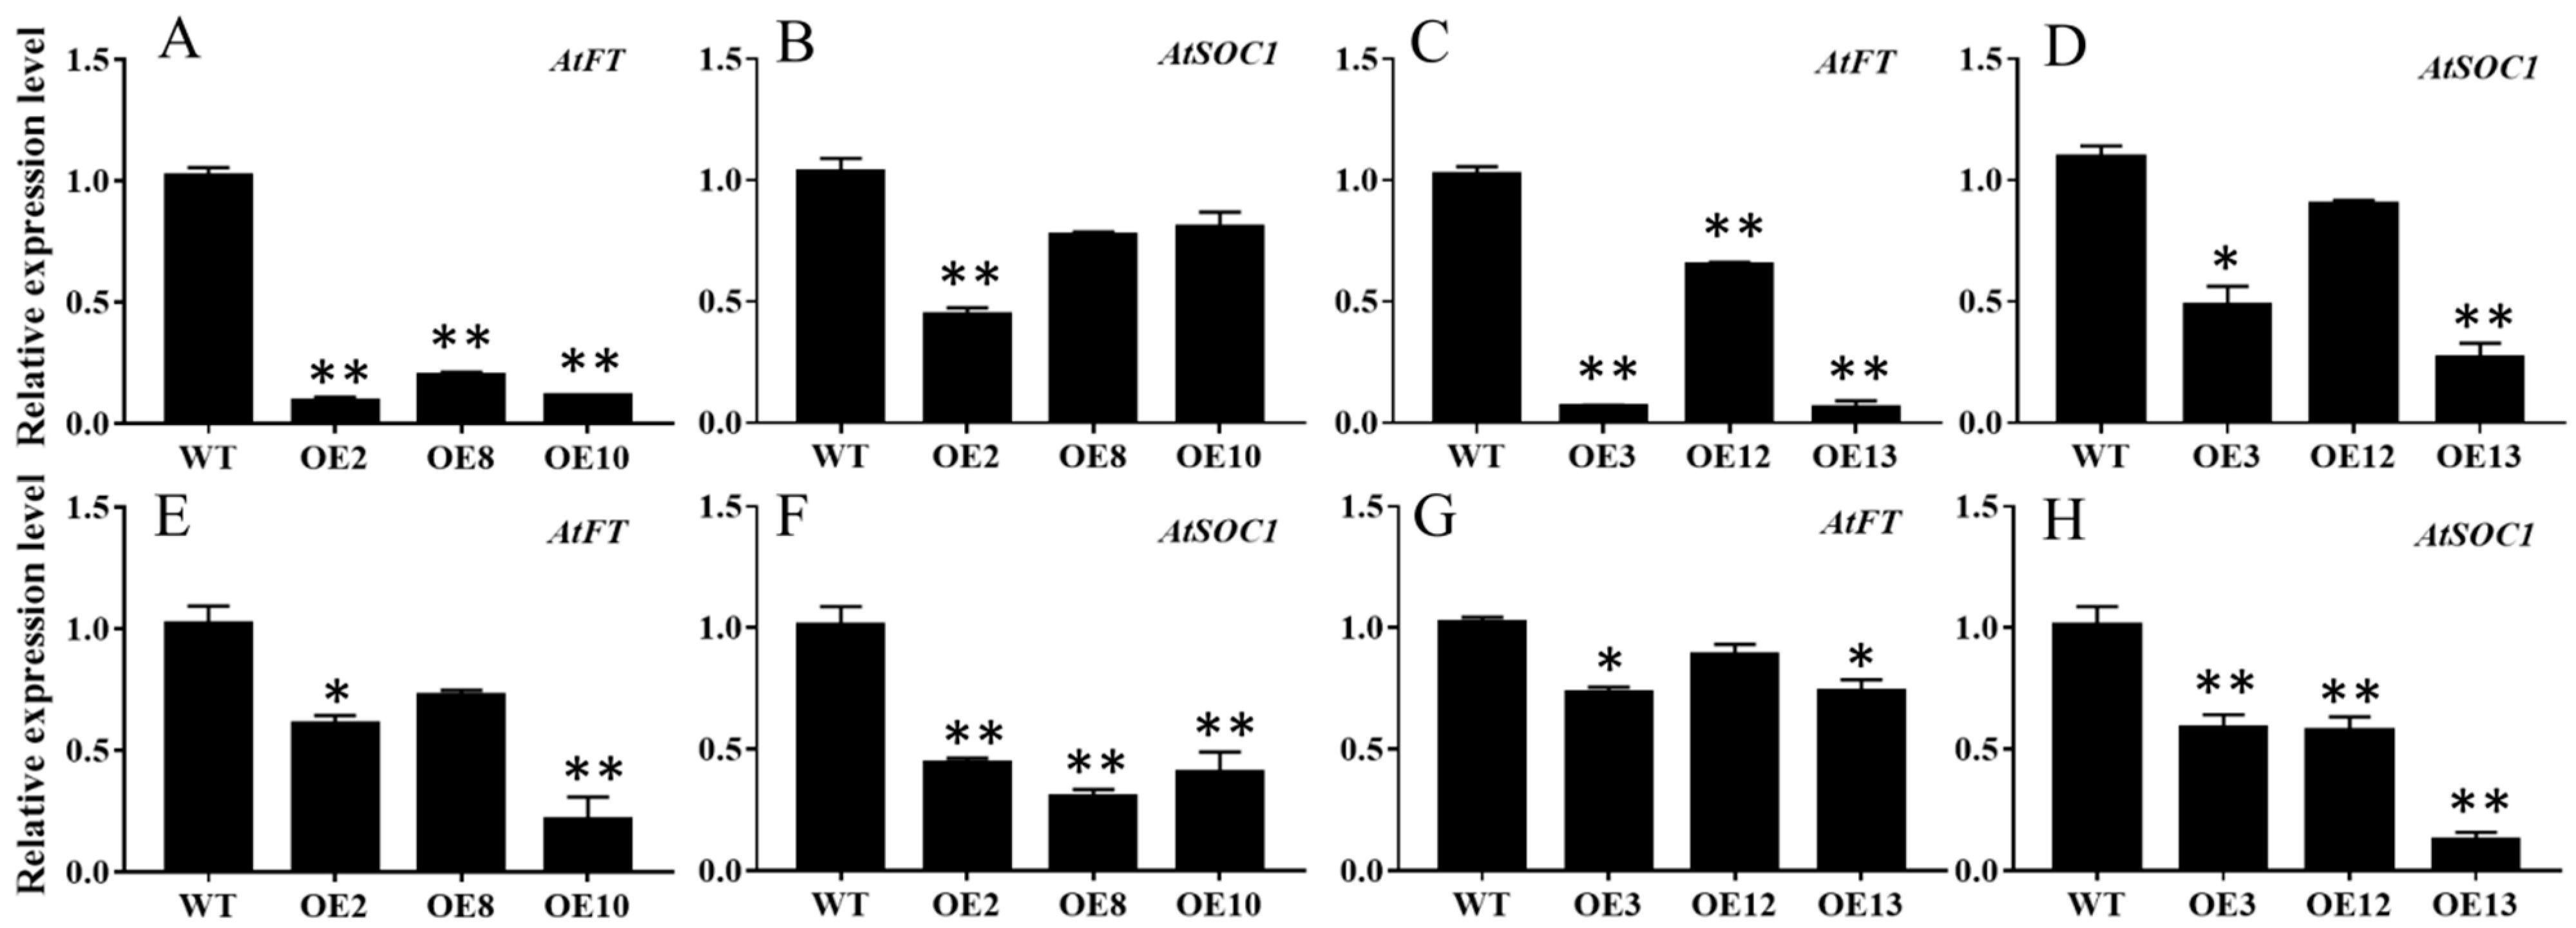
Figure 7. Expression patterns of flowering-related genes. (A–D) Expression patterns of AtFT and AtSOC1 in the WT and the MiCOL16A (A,B) or MiCOL16B (C,D) overexpression plants under LD conditions. (E–H) Expression levels of AtFT and AtSOC1 in the WT and the MiCOL16A (E,F) or MiCOL16B (G,H) overexpression plants under SD conditions. Significant differences among the samples were assessed at the p < 0.05 (*) and p < 0.01 (**) levels by Student’s t tests.
6. MiCOL16A and MiCOL16B Enhance Tolerance to Abiotic Stress
To assess the effect of ectopic MiCOL16A and MiCOL16B expression in response to abiotic stress, three homozygous lines (T3 generation) were selected. Three-day-old seedlings of the overexpression and WT plants were transplanted onto half-strength MS media supplemented with mannitol and NaCl. The length of their roots was measured after 7 days of stress treatment. The untreated WT and overexpression plants did not significantly differ, but compared with the WT plants, both MiCOL16A and MiCOL16B overexpression plants grew better and had longer roots under all stress conditions (Figure 8 and Figure 9). Together, these results showed that, compared with WT plants, MiCOL16A and MiCOL16B transgenic plants had improved tolerance to drought and salt stress.
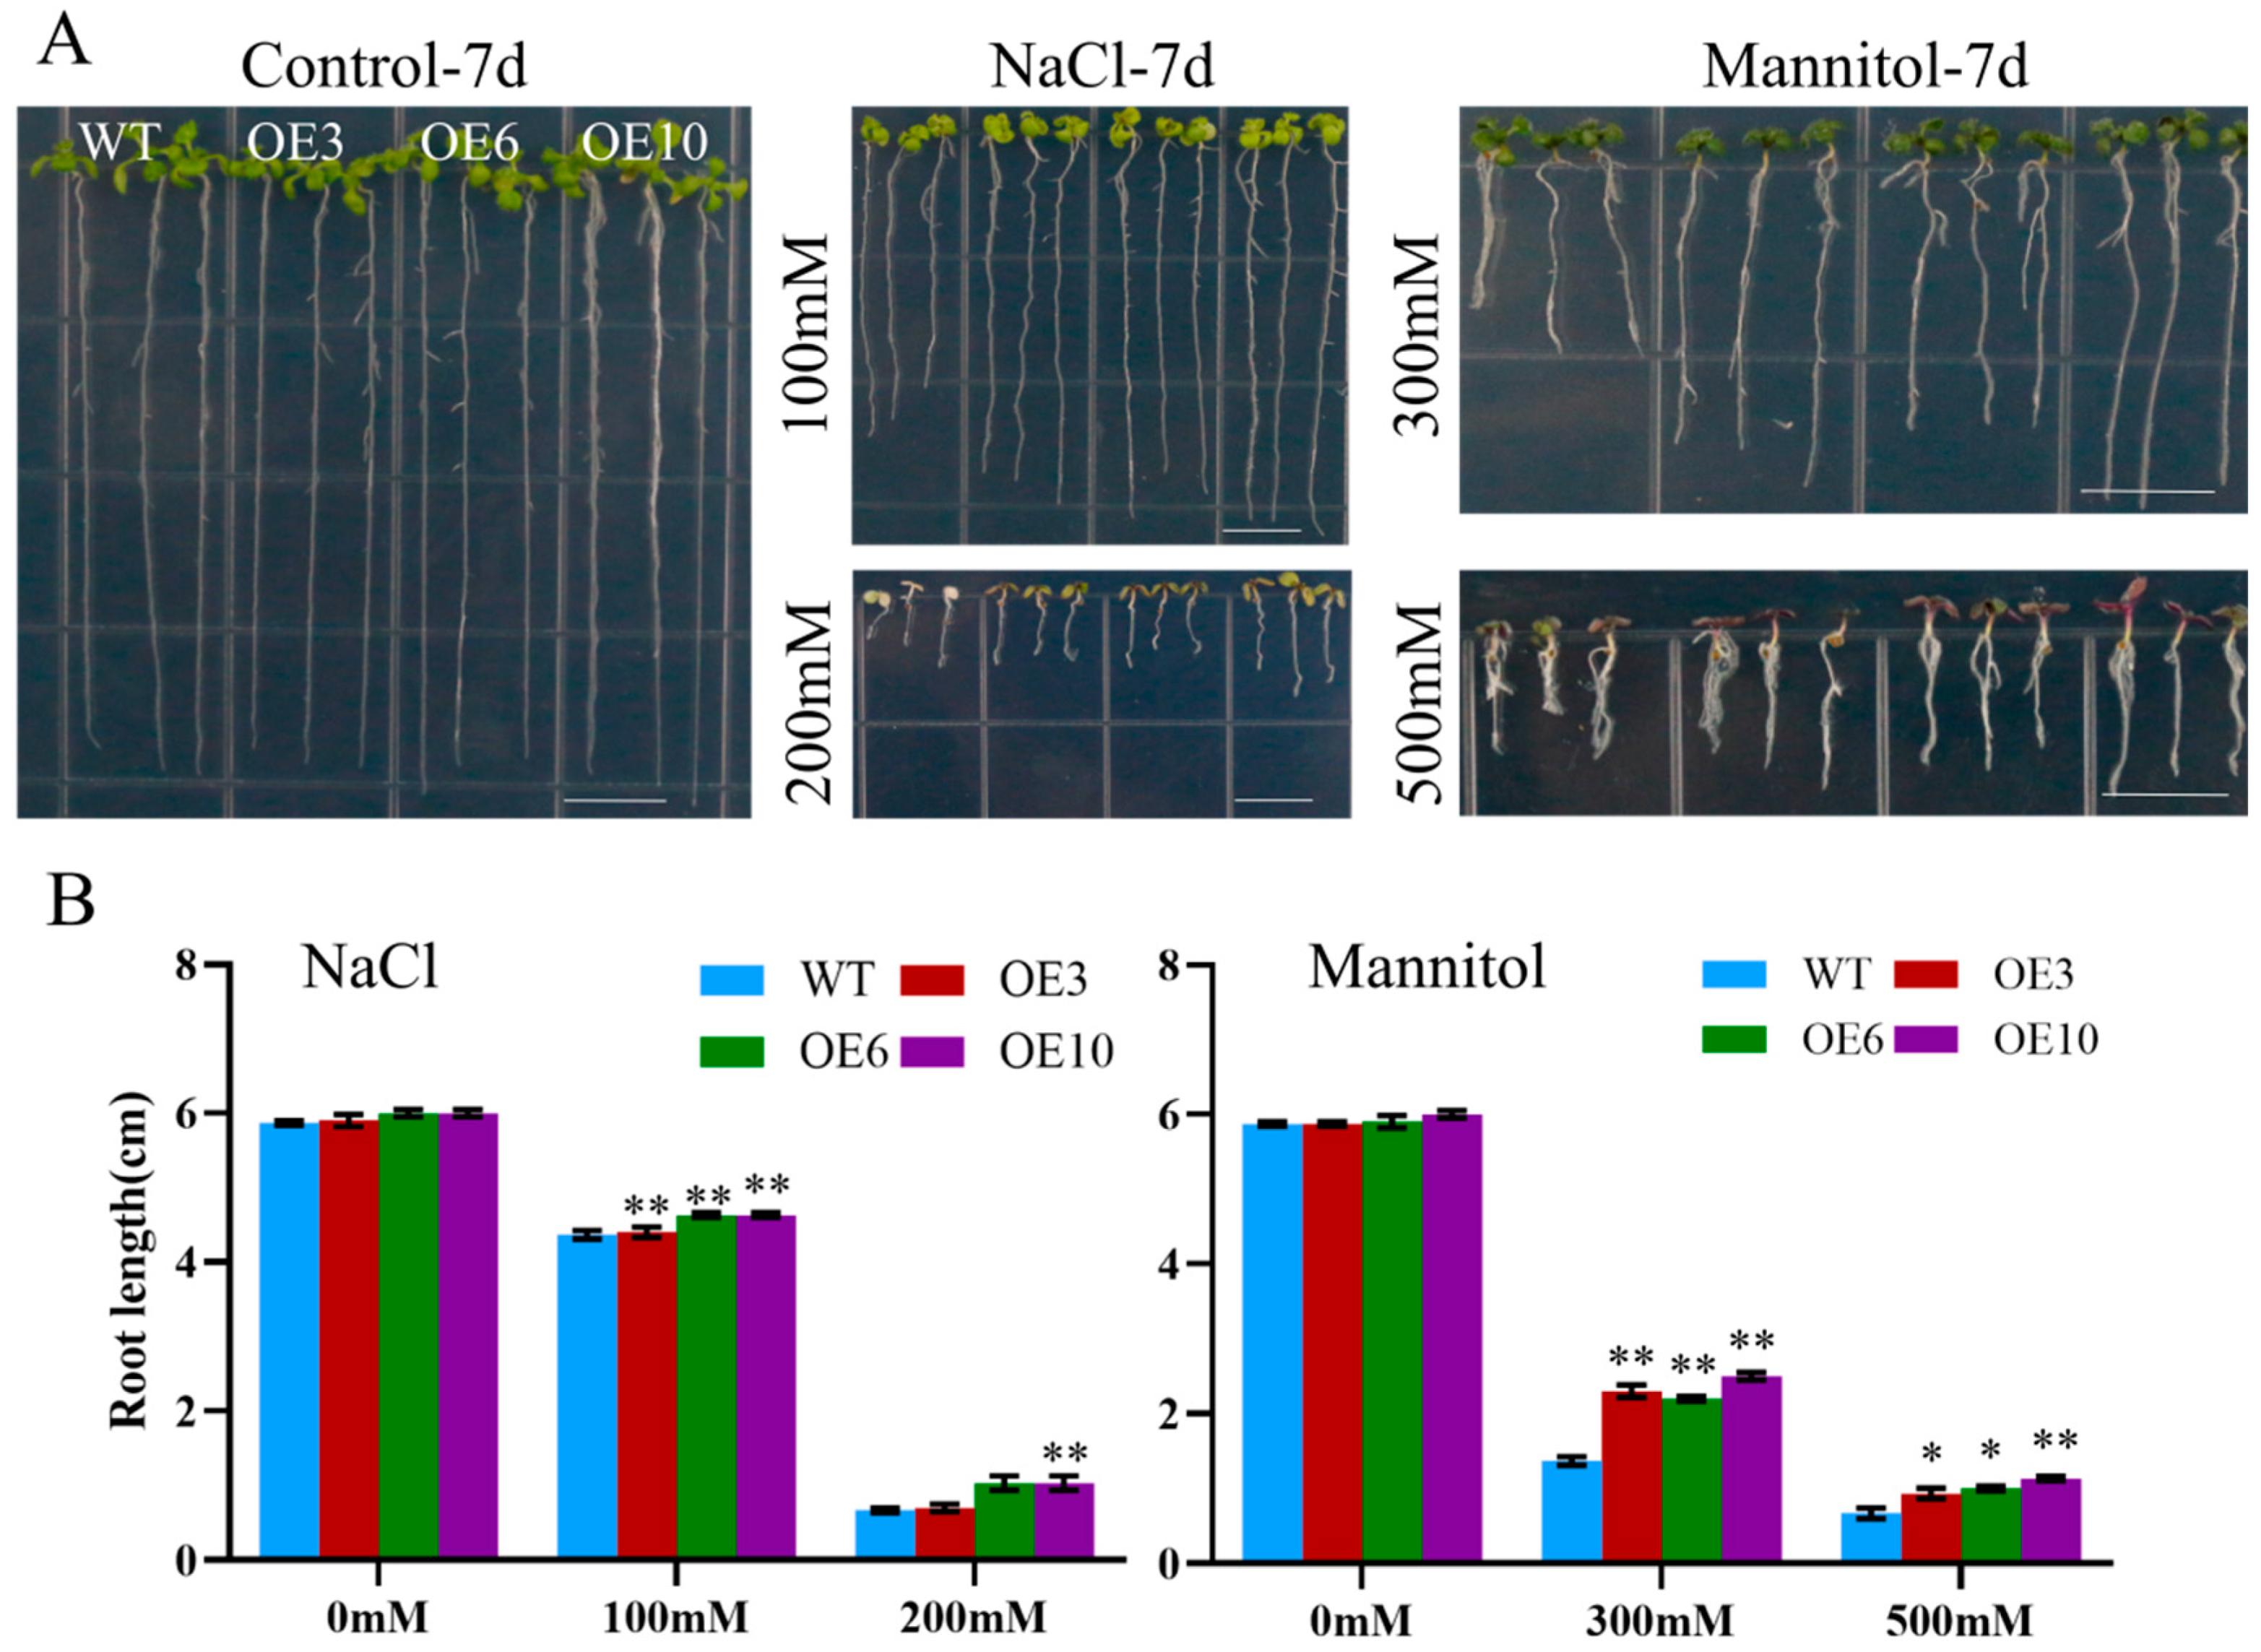
Figure 8. Assays of the length of the primary roots of WT and MiCOL16A transgenic lines under abiotic stress. (A) Seeds of the WT and three transgenic lines grown on half-strength MS media and subjected to various stresses. The bars represent 1.0 cm. (B) Lengths of the roots of all the lines under salt and drought treatment. Significant differences among the samples were assessed at the p < 0.05 (*) and p < 0.01 (**) levels by Student’s t tests.
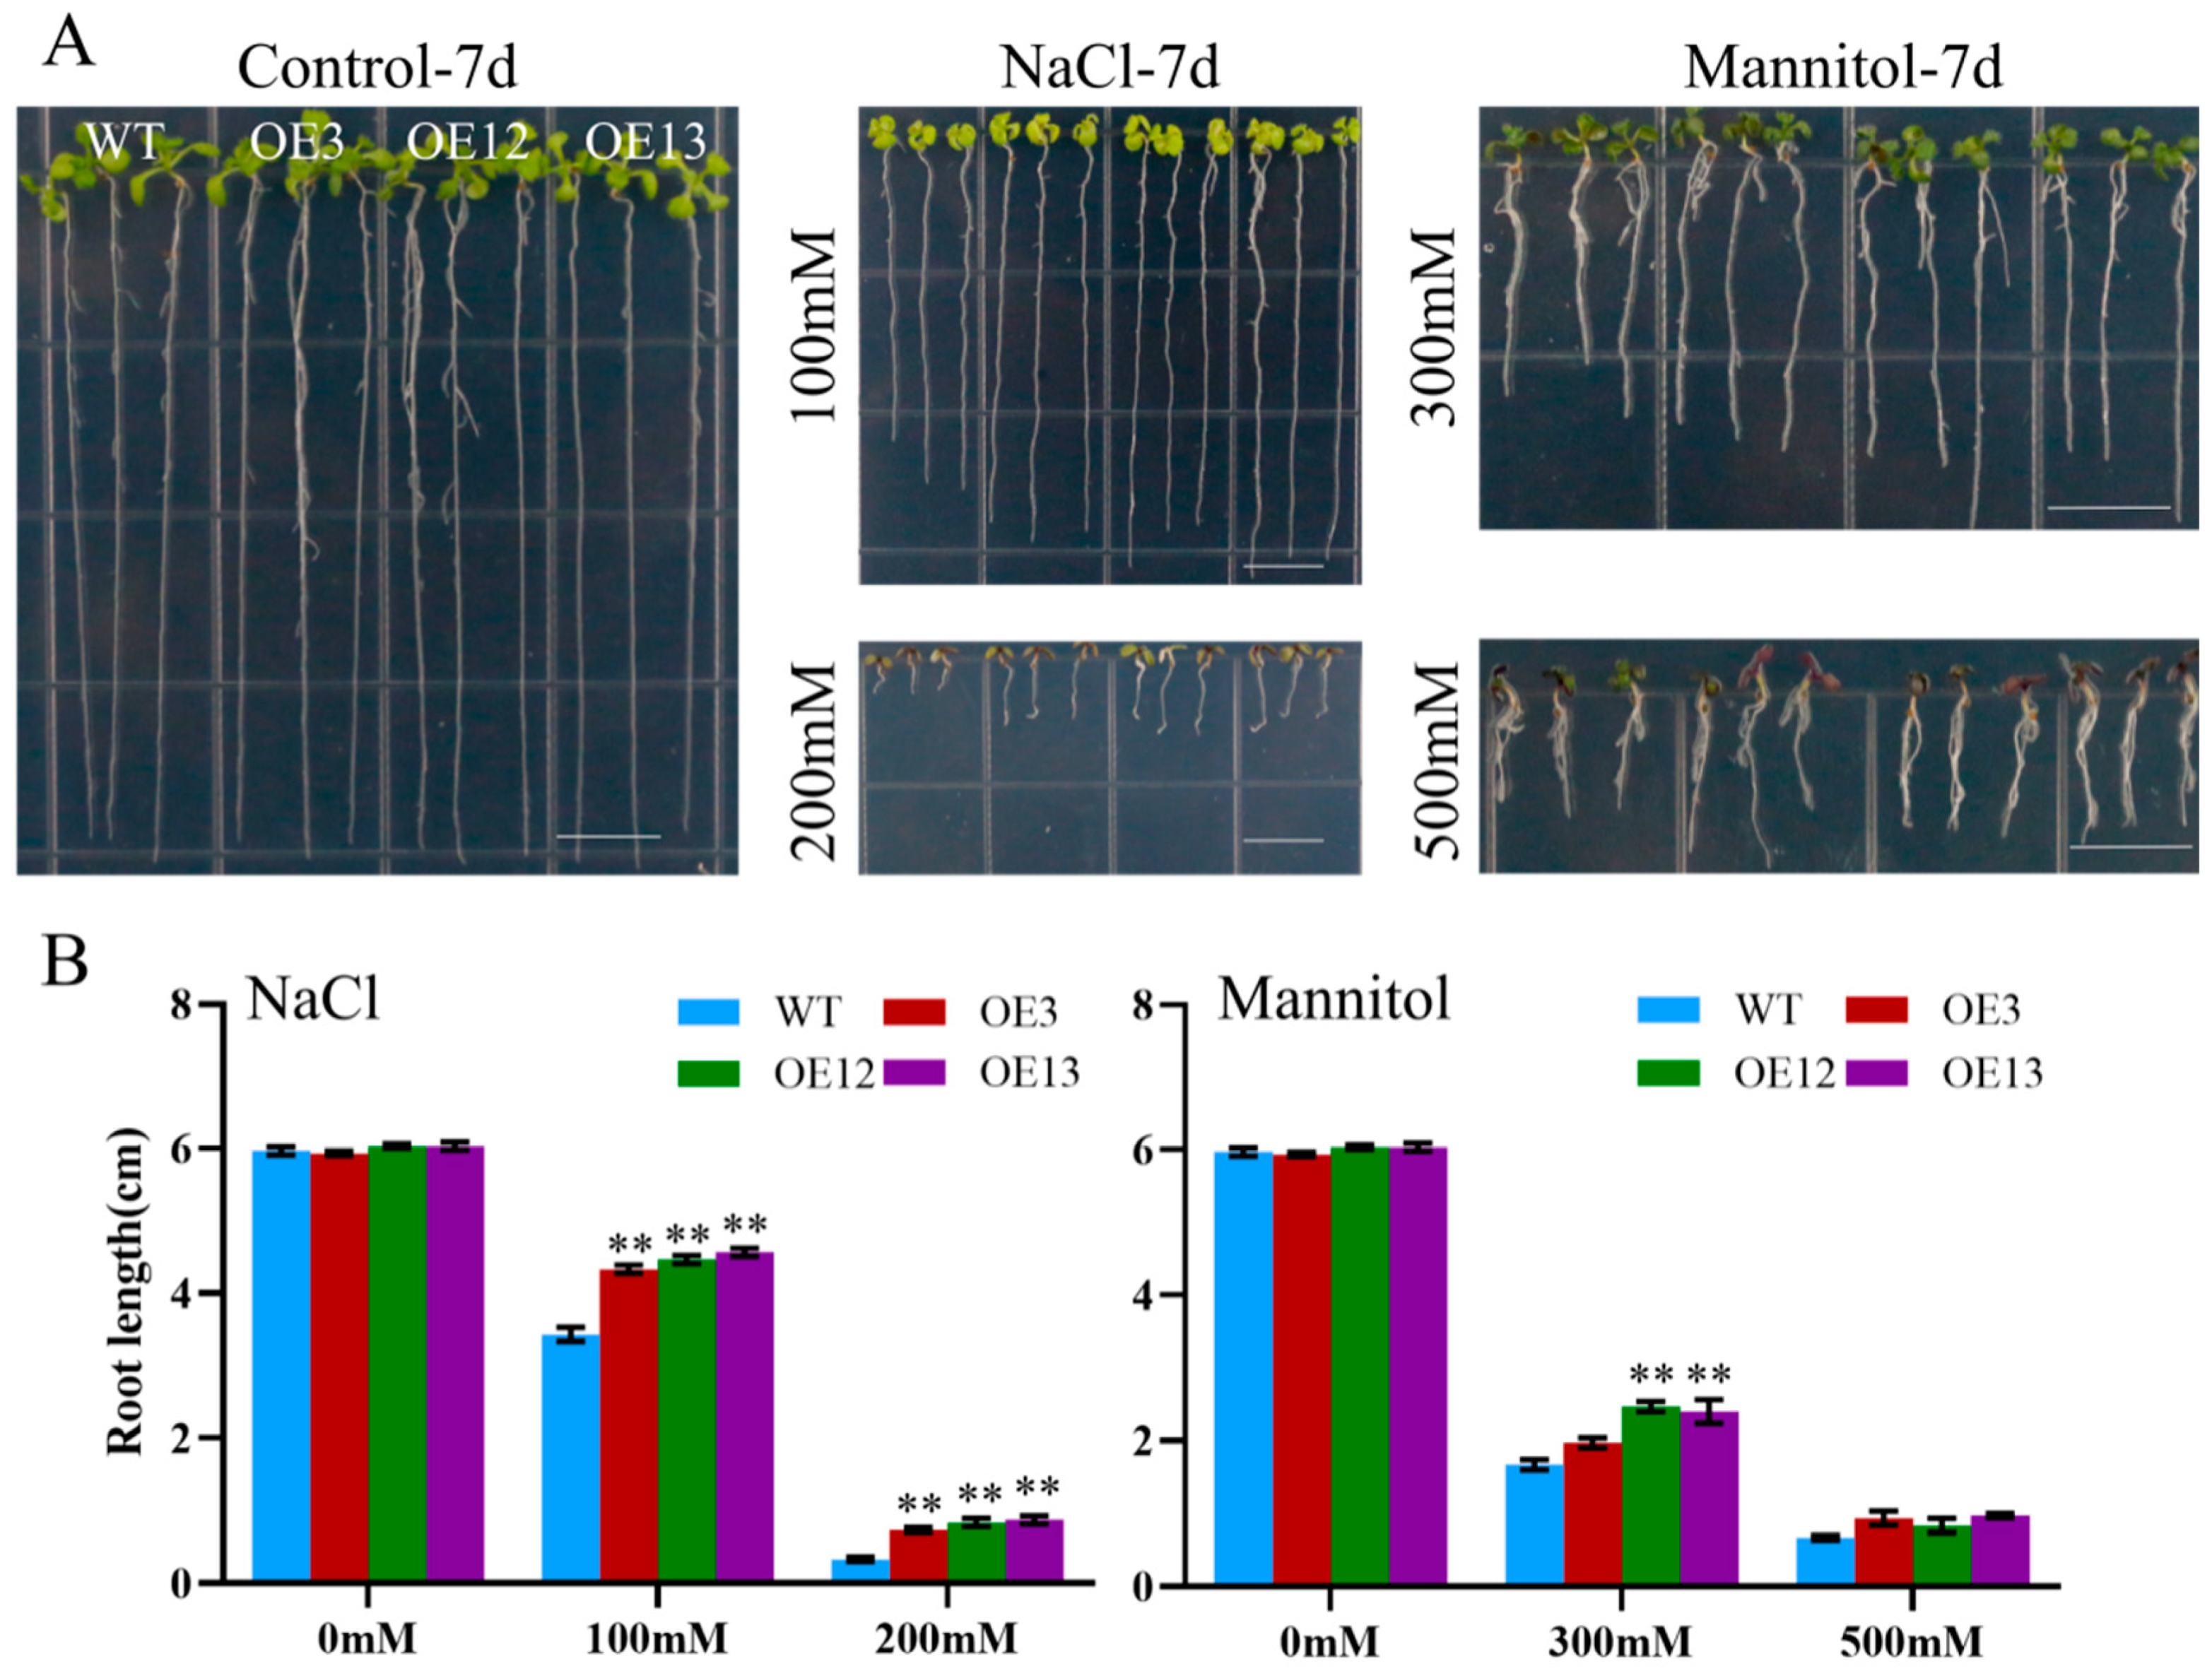
Figure 9. Assays of the length of the primary roots of the WT and MiCOL16B transgenic lines under abiotic stress. (A) Seeds of the WT and three transgenic lines grown on half-strength MS media and subjected to various stresses. The bars represent 1.0 cm. (B) Lengths of the roots of all the lines under salt and drought treatment. Significant differences among the samples were assessed at the p < 0.01 (**) levels by Student’s t tests.
To further determine the response of MiCOL16A and MiCOL16B transgenic plants to abiotic stress, 7-day-old seedlings were transplanted into square pots. After the seedlings were allowed to recover, they were watered with 300 mM NaCl every 2 days, and regular water was withheld (Figure 10A,B). For salt treatment, the survival rate was measured when obvious phenotypic differences occurred. Approximately 20.0% of WT plants, 80.0% of OEMiCOL16A#3 plants, 93.3% of OEMiCOL16A#6 plants and 86.7% of OEMiCOL16A#10 plants survived (Figure 10C). Similarly, approximately 26.7% of WT plants survived, but 73.3% of OEMiCOL16B#3, 93.3% of OEMiCOL16B#12 and 86.7% of OEMiCOL16B#13 plants survived (Figure 10D). With respect to the drought treatment, the survival rate was measured after the plants had been rewatered for 3 days: a total of 6.7% of WT plants survived, but 93.3% of OEMiCOL16A#3, 80.0% of OEMiCOL16A#6 and 73.3% of OEMiCOL16A#10 plants survived (Figure 10C). Similarly, no WT survived, but 40.0% of OEMiCOL16B#3, 93.3% of OEMiCOL16B#12 and 80.0% of OEMiCOL16B#13 lines survived (Figure 10D). Together, these results showed that overexpression of MiCOL16A and MiCOL16B in Arabidopsis improved salt and drought tolerance.
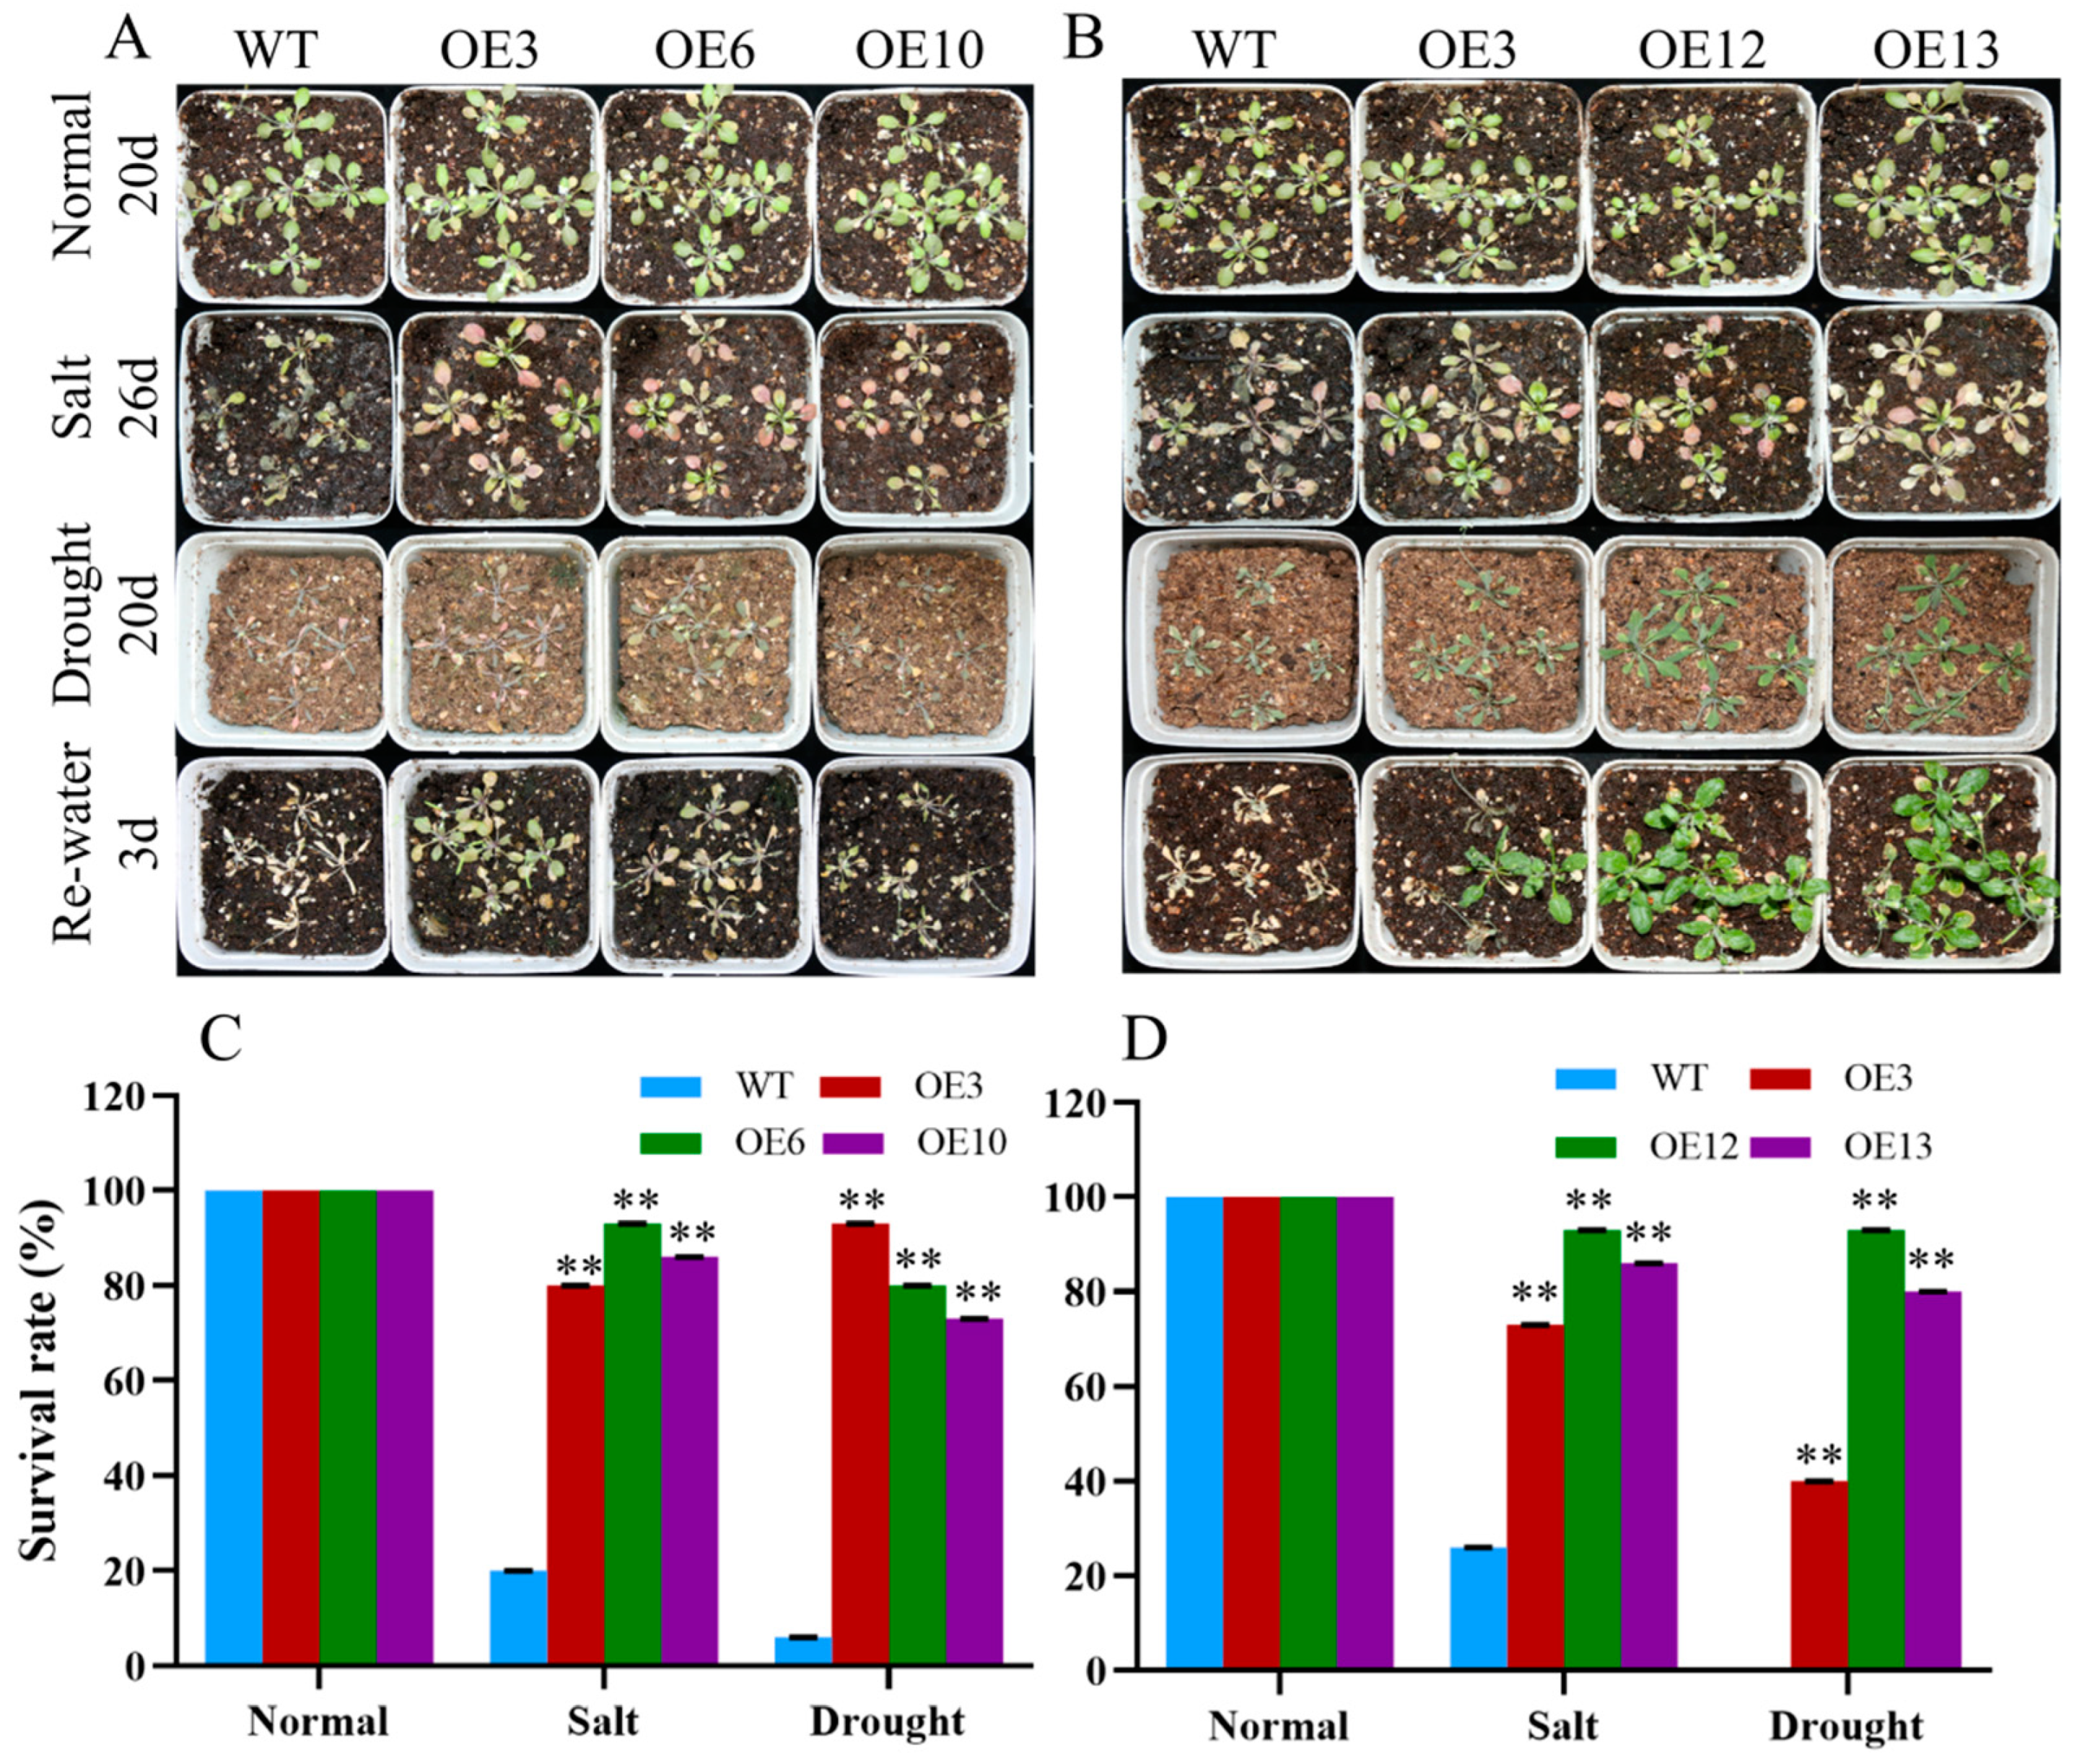
Figure 10. Phenotypes of WT and MiCOL16A and MiCOL16B transgenic plants under abiotic stresses. Normal, control; salt, 300 mM NaCl solution applied every 2 days; drought, withholding of water. (A) WT and MiCOL16A transgenic plants under different stresses. (B) WT and MiCOL16B transgenic lines under different stresses. (C–D) Survival rates of the WT and the MiCOL16A (C) and MiCOL16B (D) transgenic lines under different stresses. Significant differences among the samples were assessed at the p < 0.01 (**) levels by Student’s t tests.
To explore the molecular mechanism underlying these phenomena in the transgenic lines in response to salt or drought, four stress-related genes were selected: AtNHX1, AtRD20, AtSOS1 and AtCOR15A (Figure 11). Under salt stress, the expression levels of AtNHX1, AtRD20 and AtSOS1 were significantly higher in the three transgenic lines of MiCOL16A than in the WT, but in the MiCOL16B transgenic lines, the expression level of AtRD20 was not significantly higher (Figure 11A,B). Under drought conditions, the expression levels of AtCOR15A, AtRD20 and AtNHX1 in the MiCOL16A and MiCOL16B transgenic lines were significantly higher than those in the WT (Figure 11C,D). These findings showed that by regulating the expression of stress-responsive genes, the MiCOL16A and MiCOL16B genes might increase the stress tolerance of transgenic plants under drought or salt stress.
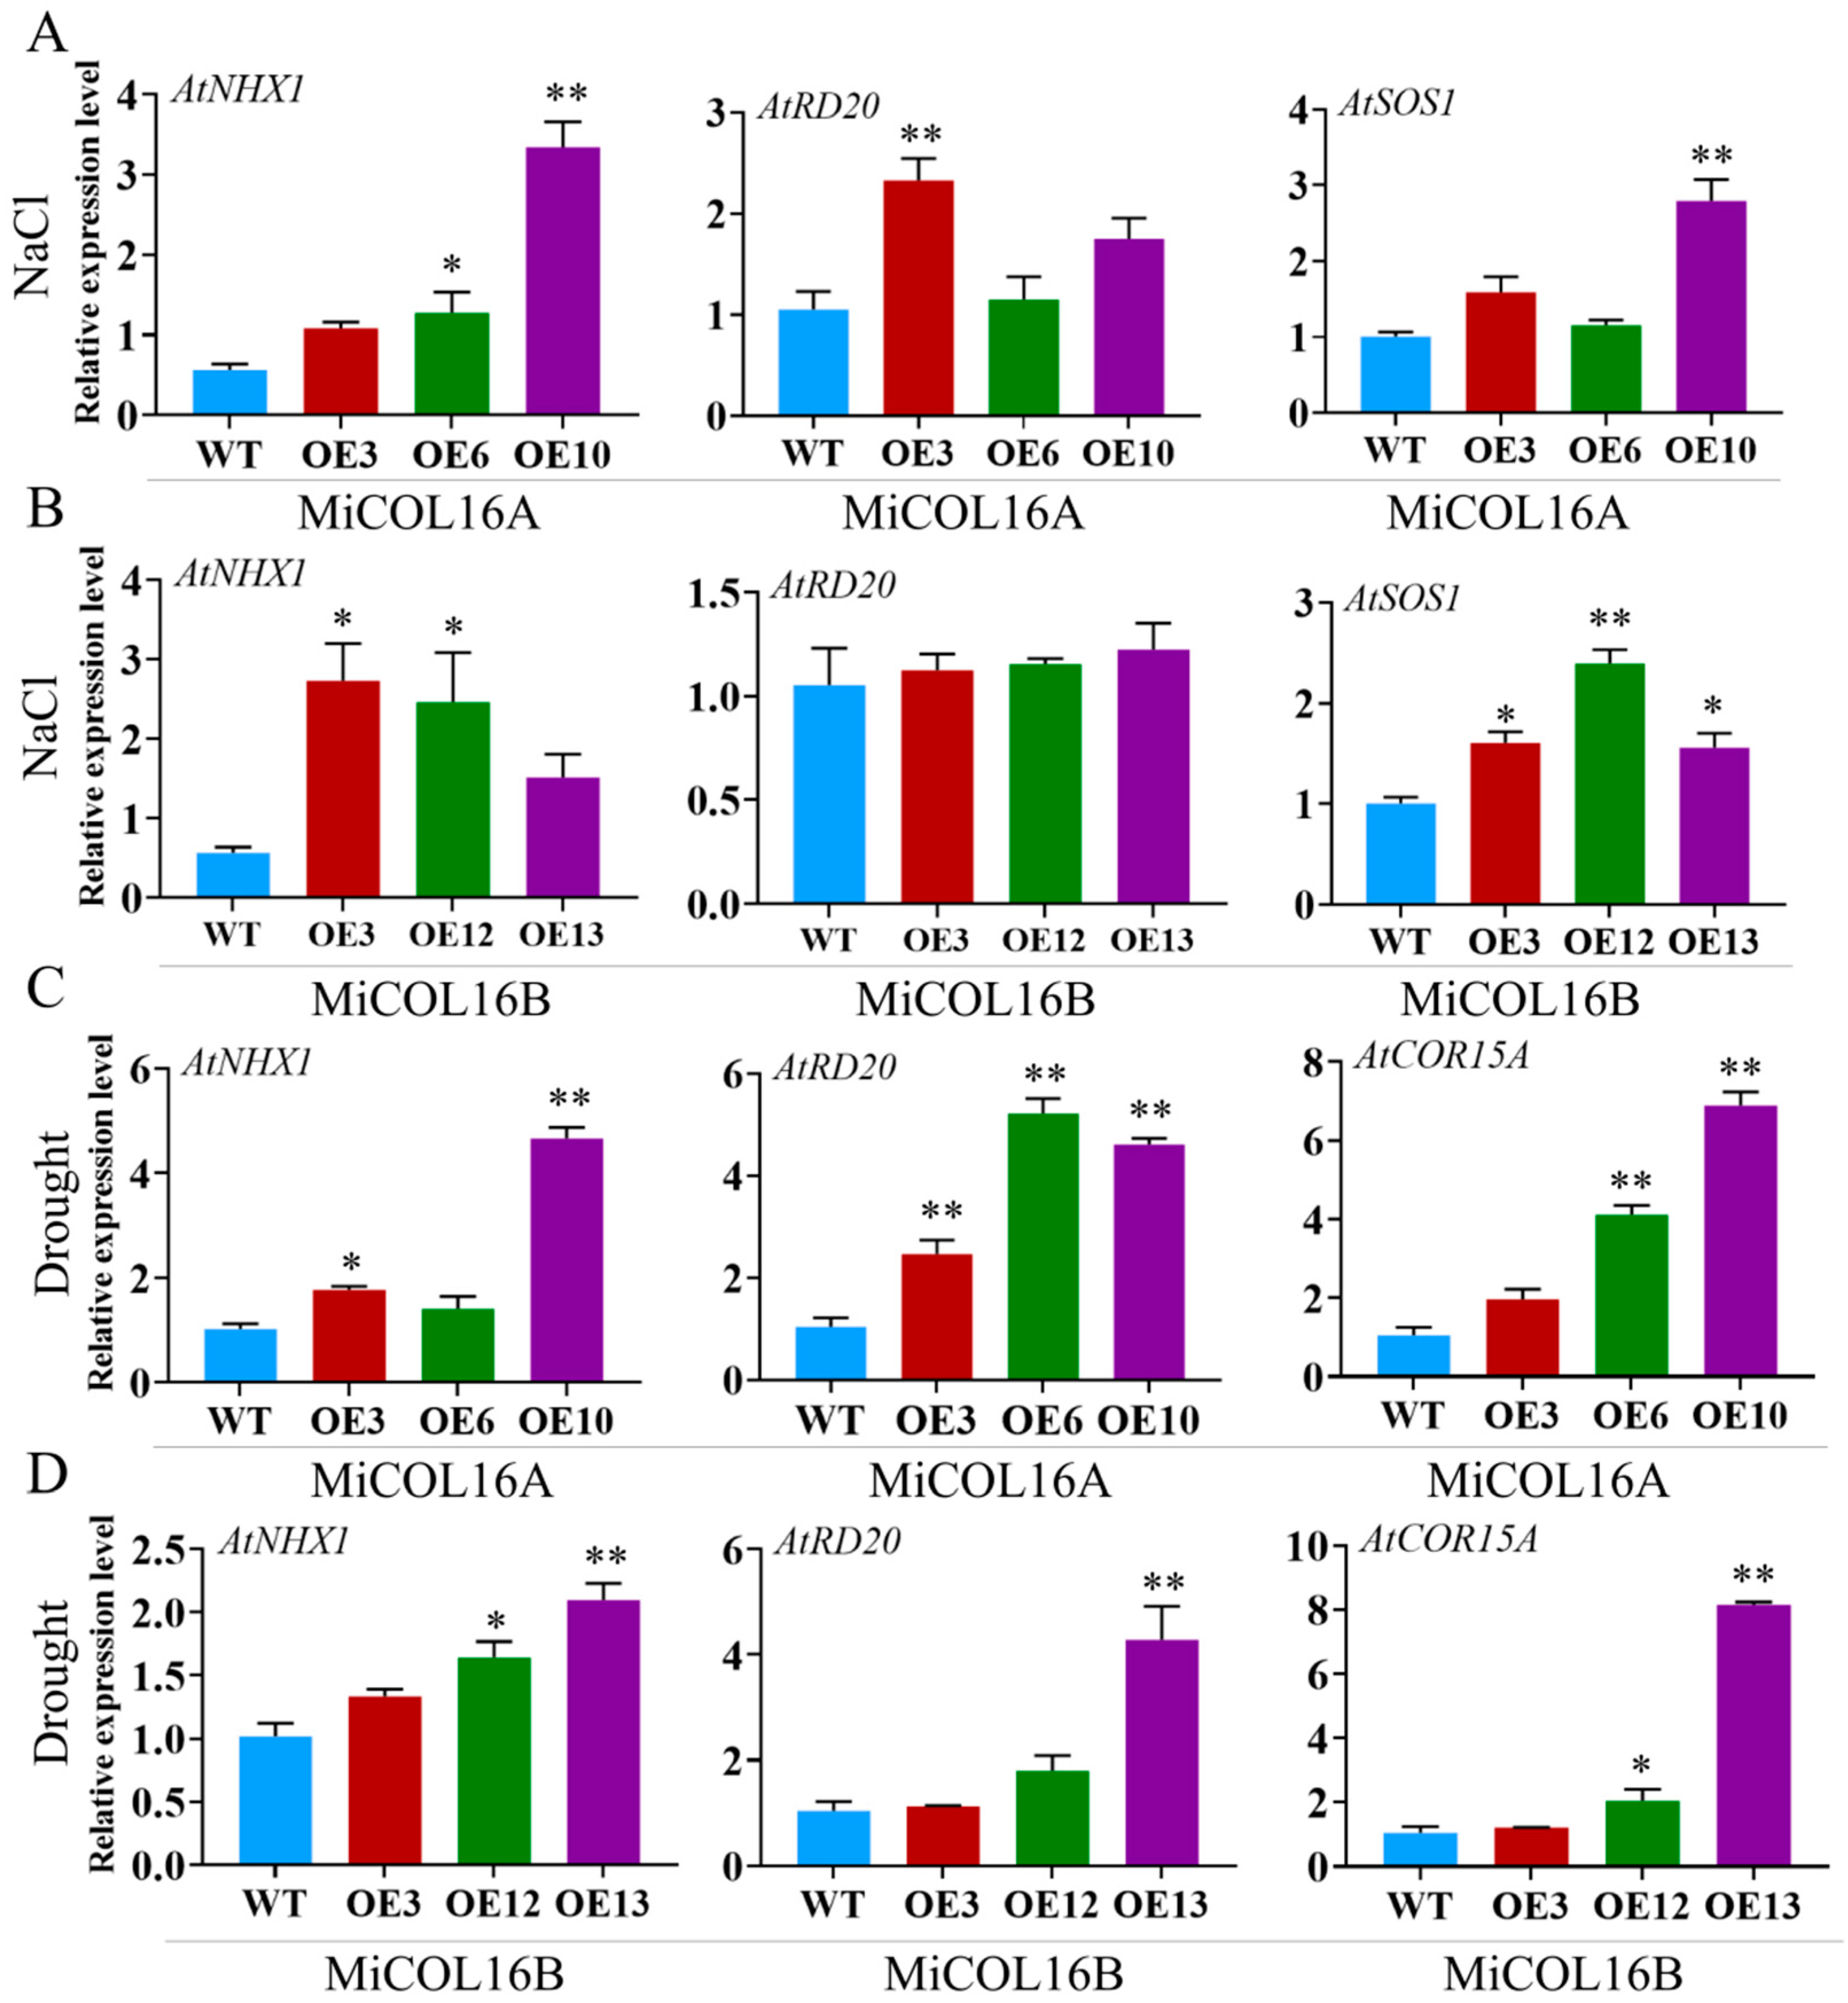
Figure 11. Expression patterns of stress-responsive genes in WT and MiCOL16A and MiCOL16B transgenic lines. (A,B) Salt stress conditions. Expression levels of the AtNHX1, AtRD20 and AtSOS1 genes in MiCOL16A (A) and MiCOL16B (B) transgenic lines. (C,D) Drought stress conditions. Expression levels of the AtNHX1, AtRD20 and AtCOR15A genes in the MiCOL16A (C) and MiCOL16B (D) transgenic lines. Significant differences among the samples were assessed at the p < 0.05 (*) and p < 0.01 (**) levels by Student’s t tests.
References
- Okamuro, J.K.; Szeto, W.; Lotys-Prass, C.; Jofuku, K.D. Photo and hormonal control of meristem identity in the Arabidopsis flower mutants apetala2 and apetala1. Plant Cell 1997, 9, 37–47.
- Wu, G.; Park, M.Y.; Conway, S.R.; Wang, J.W.; Weigel, D.; Poethig, R.S. The sequential action of miR156 and miR172 regulates developmental timing in Arabidopsis. Cell 2009, 138, 750–759.
- Blazquez, M.A.; Green, R.; Nilsson, O.; Sussman, M.R.; Weigel, D. Gibberellins promote flowering of Arabidopsis by activating the LEAFY promoter. Plant Cell 1998, 10, 791–800.
- Huang, G.W.; Ma, J.H.; Han, Y.Z.; Chen, X.J.; Fu, Y.F. Cloning and expression analysis of the soybean CO-like gene GmCOL9. Plant Mol. Biol. Rep. 2010, 29, 352–359.
- Komeda, Y. Genetic regulation of time to flower in Arabidopsis thaliana. Annu. Rev. Plant Biol. 2004, 55, 521–553.
- Putterill, J.; Robson, F.; Lee, K.; Simon, R.; Coupland, G. The CONSTANS gene of Arabidopsis promotes flowering and encodes a protein showing similarities to zinc finger transcription factors. Cell 1995, 80, 847–857.
- Griffiths, S.; Dunford, R.P.; Coupland, G.; Laurie, D.A. The evolution of CONSTANS-like gene families in barley, rice, and Arabidopsis. Plant Physiol. 2003, 131, 1855–1867.
- Yano, M.; Katayose, Y.; Ashikari, M.; Yamanouchi, U.; Monna, L.; Fuse, T.; Baba, T.; Yamamoto, K.; Umehara, Y.; Nagamura, Y.; et al. Hd1, a major photoperiod sensitivity quantitative trait locus in rice, is closely related to the Arabidopsis flowering time gene CONSTANS. Plant Cell 2000, 12, 2473–2484.
- Serrano, G.; Herrera-Palau, R.; Romero, J.M.; Serrano, A.; Coupland, G.; Valverde, F. Chlamydomonas CONSTANS and the evolution of plant photoperiodic signaling. Curr. Biol. 2009, 19, 359–368.
- Imaizumi, T.; Schultz, T.F.; Harmon, F.G.; Ho, L.A.; Kay, S.A. FKF1 F-box protein mediates cyclic degradation of a repressor of CONSTANS in Arabidopsis. Science 2005, 309, 293–297.
- Sawa, M.; Nusinow, D.A.; Kay, S.A.; Imaizumi, T. FKF1 and GIGANTEA complex formation is required for day-length measurement in Arabidopsis. Science 2007, 318, 261–265.
- Imaizumi, T.; Kay, S.A. Photoperiodic control of flowering: Not only by coincidence. Trends Plant Sci. 2006, 11, 550–558.
- Wigge, P.A.; Kim, M.C.; Jaeger, K.E.; Busch, W.; Schmid, M.; Lohmann, J.U.; Weigel, D. Integration of spatial and temporal information during floral induction in Arabidopsis. Science 2005, 309, 1056–1059.
- Shogo, I.; Young, H.S.; Anna, R.J.; Ryan, J.M.; Ghislain, B.; Richard, G.O.; Takato, I. FLOWERING BHLH transcriptional activators control expression of the photoperiodic flowering regulator CONSTANS in Arabidopsis. Proc. Natl. Acad. Sci. USA 2012, 109, 3582–3587.
- Sun, J.J.; Lu, J.; Bai, M.J.; Chen, Y.Q.; Wang, W.N.; Fan, C.G.; Liu, J.Y.; Ning, G.G.; Wang, C.Q. Phytochrome-interacting factors interact with transcription factor CONSTANS to suppress flowering in rose. Plant Physiol. 2021, 186, 1186–1201.
- Ana, L.; Federico, V.; Manuel, P.; Jose, A.J. The Arabidopsis E3 ubiquitin ligase HOS1 negatively regulates CONSTANS abundance in the photoperiodic control of flowering. Plant Cell 2012, 24, 982–999.
- Liu, L.J.; Zhang, Y.C.; Li, Q.H.; Sang, Y.; Mao, J.; Lian, H.L.; Wang, L.; Yang, H.Q. COP1-Mediated ubiquitination of CONSTANS is implicated in cryptochrome regulation of flowering in Arabidopsis. Plant Cell 2008, 20, 292–306.
- Yang, N.; Cong, Q.; Cheng, L.J. BBX transcriptional factors family in plants-a review. Chin. J. Biotechnol. 2019, 36, 666–677.
- Ledger, S.; Strayer, C.; Ashton, F.; Kay, S.A.; Putterill, J. Analysis of the function of two circadian-regulated CONSTANS-LIKE genes. Plant J. 2001, 26, 15–22.
- Graeff, M.; Straub, D.; Eguen, T.; Dolde, U.; Rodrigues, V.; Brandt, R.; Wenkel, S. Microprotein-mediated recruitment of CONSTANS into a topless trimeric complex represses flowering in Arabidopsis. PLoS Genet. 2016, 12, e1005959.
- Wang, H.G.; Zhang, Z.L.; Li, H.Y.; Zhao, X.Y.; Liu, X.M.; Ortiz, M.; Lin, C.T.; Liu, B. CONSTANS-LIKE 7 regulates branching and shade avoidance response in Arabidopsis. J. Exp. Bot. 2013, 64, 1017–1024.
- Takase, T.; Kakikubo, Y.; Nakasone, A.; Nishiyama, Y.; Yasuhara, M.; Yoko, T.; Kiyosue, T. Characterization and transgenic study of CONSTANS-LIKE8 (COL8) gene in Arabidopsis thaliana: Expression of 35S:COL8 delays flowering under long-day conditions. Plant Biotechnol. 2011, 28, 439–446.
- Tsuji, H.; Taoka, K.; Shimamoto, K. Regulation of flowering in rice: Two florigen genes, a complex gene network, and natural variation. Curr. Opin. Plant Biol. 2011, 14, 45–52.
- Wu, W.X.; Zheng, X.M.; Chen, D.B.; Zhang, Y.X.; Ma, W.W.; Zhang, H.; Sun, L.P.; Yang, Z.F.; Zhao, C.D.; Zhan, X.D.; et al. OsCOL16, encoding a CONSTANS-like protein, represses flowering by upregulating Ghd7 expression in rice. Plant Sci. 2017, 260, 60–69.
- Gonzalez-Schain, N.D.; Dıaz-Mendoza, M.; Zurczak, M.; Suárez-López, P. Potato CONSTANS is involved in photoperiodic tuberization in a graft-transmissible manner. Plant J. 2012, 70, 678–690.
- Jeong, D.H.; Sung, S.K.; An, G. Molecular cloning and characterization of CONSTANS-like cDNA clones of the Fuji apple. J Plant Biol. 1999, 42, 23–31.
- Luo, C.; Yu, H.X.; Fan, Y.; Zhang, X.J.; He, X.H. Research advance on the flowering mechanism of mango. Acta Hortic. 2019, 1244, 2.
- Fan, Z.Y.; He, X.H.; Fan, Y.; Yu, H.X.; Wang, Y.H.; Xie, X.J.; Liu, Y.; Mo, X.; Wang, J.Y.; Luo, C. Isolation and functional characterization of three MiFTs genes from mango. Plant Physiol. Biochem. 2020, 155, 169–176.
- Wei, J.Y.; Liu, D.B.; Liu, G.Y.; Tang, J.; Chen, Y.Y. Molecular cloning, characterization, and expression of MiSOC1: A homolog of the flowering gene SUPPRESSOR OF overexpression OF CONSTANS1 from mango (Mangifera indica L). Front. Plant Sci. 2016, 7, 1758.
- Yu, H.X.; Luo, C.; Fan, Y.; Zhang, X.J.; Huang, F.; Li, M.; He, X.H. Isolation and characterization of two APETALA1-Like genes from mango (Mangifera indica L.). Sci. Hortic. 2020, 259, 108814.
- Liu, Y.; Luo, C.; Zhang, X.J.; Lu, X.X.; Yu, H.X.; Xie, X.J.; Fan, Z.Y.; Mo, X.; He, X.H. Overexpression of the mango MiCO gene delayed flowering time in transgenic Arabidopsis. Plant Cell Tissue Organ Cult. 2020, 143, 219–228.
- Tan, J.J.; Jin, M.N.; Wang, J.C.; Wu, F.Q.; Sheng, P.K.; Cheng, Z.J.; Wang, J.L.; Zheng, X.M.; Chen, L.P.; Wang, M.; et al. OsCOL10, a CONSTANS-Like gene, functions as a flowering time repressor downstream of Ghd7 in rice. Plant Cell Physiol. 2016, 57, 798–812.
- Wu, W.X.; Zhang, Y.X.; Zhang, M.; Zhan, X.D.; Shen, X.H.; Yu, P.; Chen, D.B.; Liu, Q.E.; Sinumporn, S.; Hussain, K.; et al. The rice CONSTANS-like protein OsCOL15 suppresses flowering by promoting Ghd7 and repressing RID1. Biochem. Biophys. Res. Commun. 2018, 495, 1349–1355.
More
Information
Subjects:
Agriculture, Dairy & Animal Science
Contributor
MDPI registered users' name will be linked to their SciProfiles pages. To register with us, please refer to https://encyclopedia.pub/register
:
View Times:
788
Revisions:
2 times
(View History)
Update Date:
16 Mar 2022
Table of Contents


Notice
You are not a member of the advisory board for this topic. If you want to update advisory board member profile, please contact office@encyclopedia.pub.
OK
Confirm
Only members of the Encyclopedia advisory board for this topic are allowed to note entries. Would you like to become an advisory board member of the Encyclopedia?
Yes
No
${ textCharacter }/${ maxCharacter }
Submit
Cancel
Back
Comments
${ item }
|
${ item.createdUser.fullName }
${ item.createdAt }
${ item.vote }
${ item.reply }
Delete
${ reply.createdUser.fullName }
${ reply.createdAt }
${ reply.vote }
Delete
There is no reply to this comment~
${ item.replyTextCharacter }/${ item.replyMaxCharacter }
Submit
Cancel
More
No more~
There is no comment~
${ textCharacter }/${ maxCharacter }
Submit
Cancel
${ selectedItem.replyTextCharacter }/${ selectedItem.replyMaxCharacter }
Submit
Cancel
Confirm
Are you sure to Delete?
Yes
No