Your browser does not fully support modern features. Please upgrade for a smoother experience.
Submitted Successfully!
 +1 credit
Thank you for your contribution! You can also upload a video entry or images related to this topic.
For video creation, please contact our Academic Video Service.
| Version | Summary | Created by | Modification | Content Size | Created at | Operation |
|---|---|---|---|---|---|---|
| 1 | Evgenii Mareev | + 1889 word(s) | 1889 | 2022-02-24 04:44:33 | | | |
| 2 | Rita Xu | + 601 word(s) | 2490 | 2022-03-04 03:13:42 | | |
Video Upload Options
We provide professional Academic Video Service to translate complex research into visually appealing presentations. Would you like to try it?
Cite
If you have any further questions, please contact Encyclopedia Editorial Office.
Mareev, E. Ultrafast Phase Transitions in (001) Si. Encyclopedia. Available online: https://encyclopedia.pub/entry/20164 (accessed on 23 July 2026).
Mareev E. Ultrafast Phase Transitions in (001) Si. Encyclopedia. Available at: https://encyclopedia.pub/entry/20164. Accessed July 23, 2026.
Mareev, Evgenii. "Ultrafast Phase Transitions in (001) Si" Encyclopedia, https://encyclopedia.pub/entry/20164 (accessed July 23, 2026).
Mareev, E. (2022, March 03). Ultrafast Phase Transitions in (001) Si. In Encyclopedia. https://encyclopedia.pub/entry/20164
Mareev, Evgenii. "Ultrafast Phase Transitions in (001) Si." Encyclopedia. Web. 03 March, 2022.
Copy Citation
Researchers demonstrate an ultrafast (<0.1 ps) reversible phase transition in silicon (Si) under ultrafast pressure loading using molecular dynamics. Si changes its structure from cubic diamond to β-Sn on the shock-wave front. The phase transition occurs when the shock-wave pressure exceeds 11 GPa.
phase transitions
molecular dynamics
shock waves
1. Introduction
Silicon is the most studied semiconductor; however, its high-pressure phases due to new theoretical and experimental techniques have only been actively examined in recent years [1][2][3][4]. Nowadays, it is possible to accurately investigate the high-pressure behavior of materials, such as structural properties, solid-to-solid phase transitions, and dynamical properties. Si under static pressure transforms from the diamond (Si-I) to the metallic β-Sn (Si-II) structure at around 11 GPa. Under higher pressure, the hexagonal close-packed (hcp-Si-VII), face-centered cubic (fcc-Si-X) and other structures have been examined as possible high-pressure phases of Si [2][5][6][7][8]. To summarize, silicon has eleven (or even more) distinct stable and metastable crystalline phases at high pressures. Numerical calculations have predicted the structural phase transition from cubic diamond to β-Sn (~11 GPa) and from β-Sn to hcp for Si (about 40 GPa) [3][5][9][10][11]. The hcp phase of Si is stable at about 40 GPa in diamond-cell experiments [2]. However, despite being reasonably well-understood under hydrostatic conditions, under dynamic loading, the phase transitions in Si remain a subject of debate [12]. Moreover, depending on the amplitude and time duration of loading, the final phase of Si is varied from amorphous to Ibam, BC8, hex. diamond (Si-IX), etc. [13][14]. The presumptive tree of phase transitions in Si primarily depends on the velocity of pressure release and do not take into account the role of temperature that would probably arise in the experiments, both in the case of laser ablation (when the laser pulse is directly focused onto the sample’s surface [15][16]) or shock-wave impact. Under such conditions, the phase transitions may be masked by the melting of Si and could not be detected post-mortem. Nowadays the time-resolved method that is applicable to the direct detection of phase transitions is limited by the time-resolved Raman scattering and X-ray diagnostics [17][18]. Recent progress in the generation of X-rays, both from free-electron lasers (FEL) and laser plasma, or from the high harmonic generation, which allows for the retrieval of the ultrafast dynamics of phase transitions [19][20][21]. Using such sources, the time-resolved experiments were successfully applied to the study of lattice dynamics [22][23], phase transitions [24][25], and phonon dynamics [26]. However, the experiments did not provide direct information about structural dynamics and atom motion. To “build a bridge” between observations in the experimental macroscopic parameters (such as Raman or XRD spectra) and the microstructure of the investigated sample, a numerical simulation is commonly applied [27]. Therefore, it is extremely important to perform numerical simulations to reveal the lattice dynamics that occurred between the start of the process and the formation of the final phase.
Under static conditions, the phase transitions in Si are widely investigated using the ab initio total-energy-pseudopotential method [5]; however, this method is not applicable to dynamical phase conditions. Recently, molecular dynamics were used to investigate the phase transitions induced by the shock wave in Si [11]. The authors demonstrated that the shear stress is relieved by an inelastic response associated with a partial transformation to a new high-pressure phase, where both the new phase and the original cubic-diamond phase are under close hydrostatic conditions. However, the dynamics of the phase transition were not investigated. In experiments, the multi-megabar pressures are usually achieved by high-intensity, ultrashort laser pulses [28][29][30]. For example, by combining a free-electron-laser (FEL)-based X-ray-diffraction geometry with laser-driven compression, the lowering of the hydrostatic phase boundary in elemental silicon was demonstrated [4]. The authors demonstrated melting above 14 GPa, which was previously ascribed to a solid-to-solid phase transition. For example, it is possible to achieve such pressures in laser shock peening experiments [31]. In the framework of the approach, the shock wave is generated in a buffer media (for example, water), and this shock wave affects the Si sample. This leads to the increase in the interaction region, which simplifies the X-ray-diffraction (XRD) experiments [31].
2. Stationary Conditions
The first set of simulations was performed under hydrostatic conditions. The simulations were performed with a 5 GPa step far from the phase-transition pressure and a 0.5 GPa step in the vicinity of the presumptive transition pressure. These simulations aimed to retrieve the atomic volume, XRD spectrum, and centrosymmetric parameter for different phases of Si. It was determined that Si is transformed from cubic diamond (atomic volume: 20 A3) to the β-Sn phase under the pressure of about 11 GPa. The phase is stable until reaching 45 GPa. At this pressure, the structure of Si is transformed to hcp (see Figure 1). The obtained data is in good agreement with the literature data [2]. The cross-section along the z-direction demonstrates that the structure of Si changes (shown by lines in Figure 1b). The non-symmetric nature of the structure change is raised because the phase transition starts from the inhomogeneities in the structure (no phase transitions were observed in the simulations of the ideal Si crystal). Therefore, the directions of the crystallites are random. This leads to a decrease in the peaks’ intensities in the XRD spectrum.
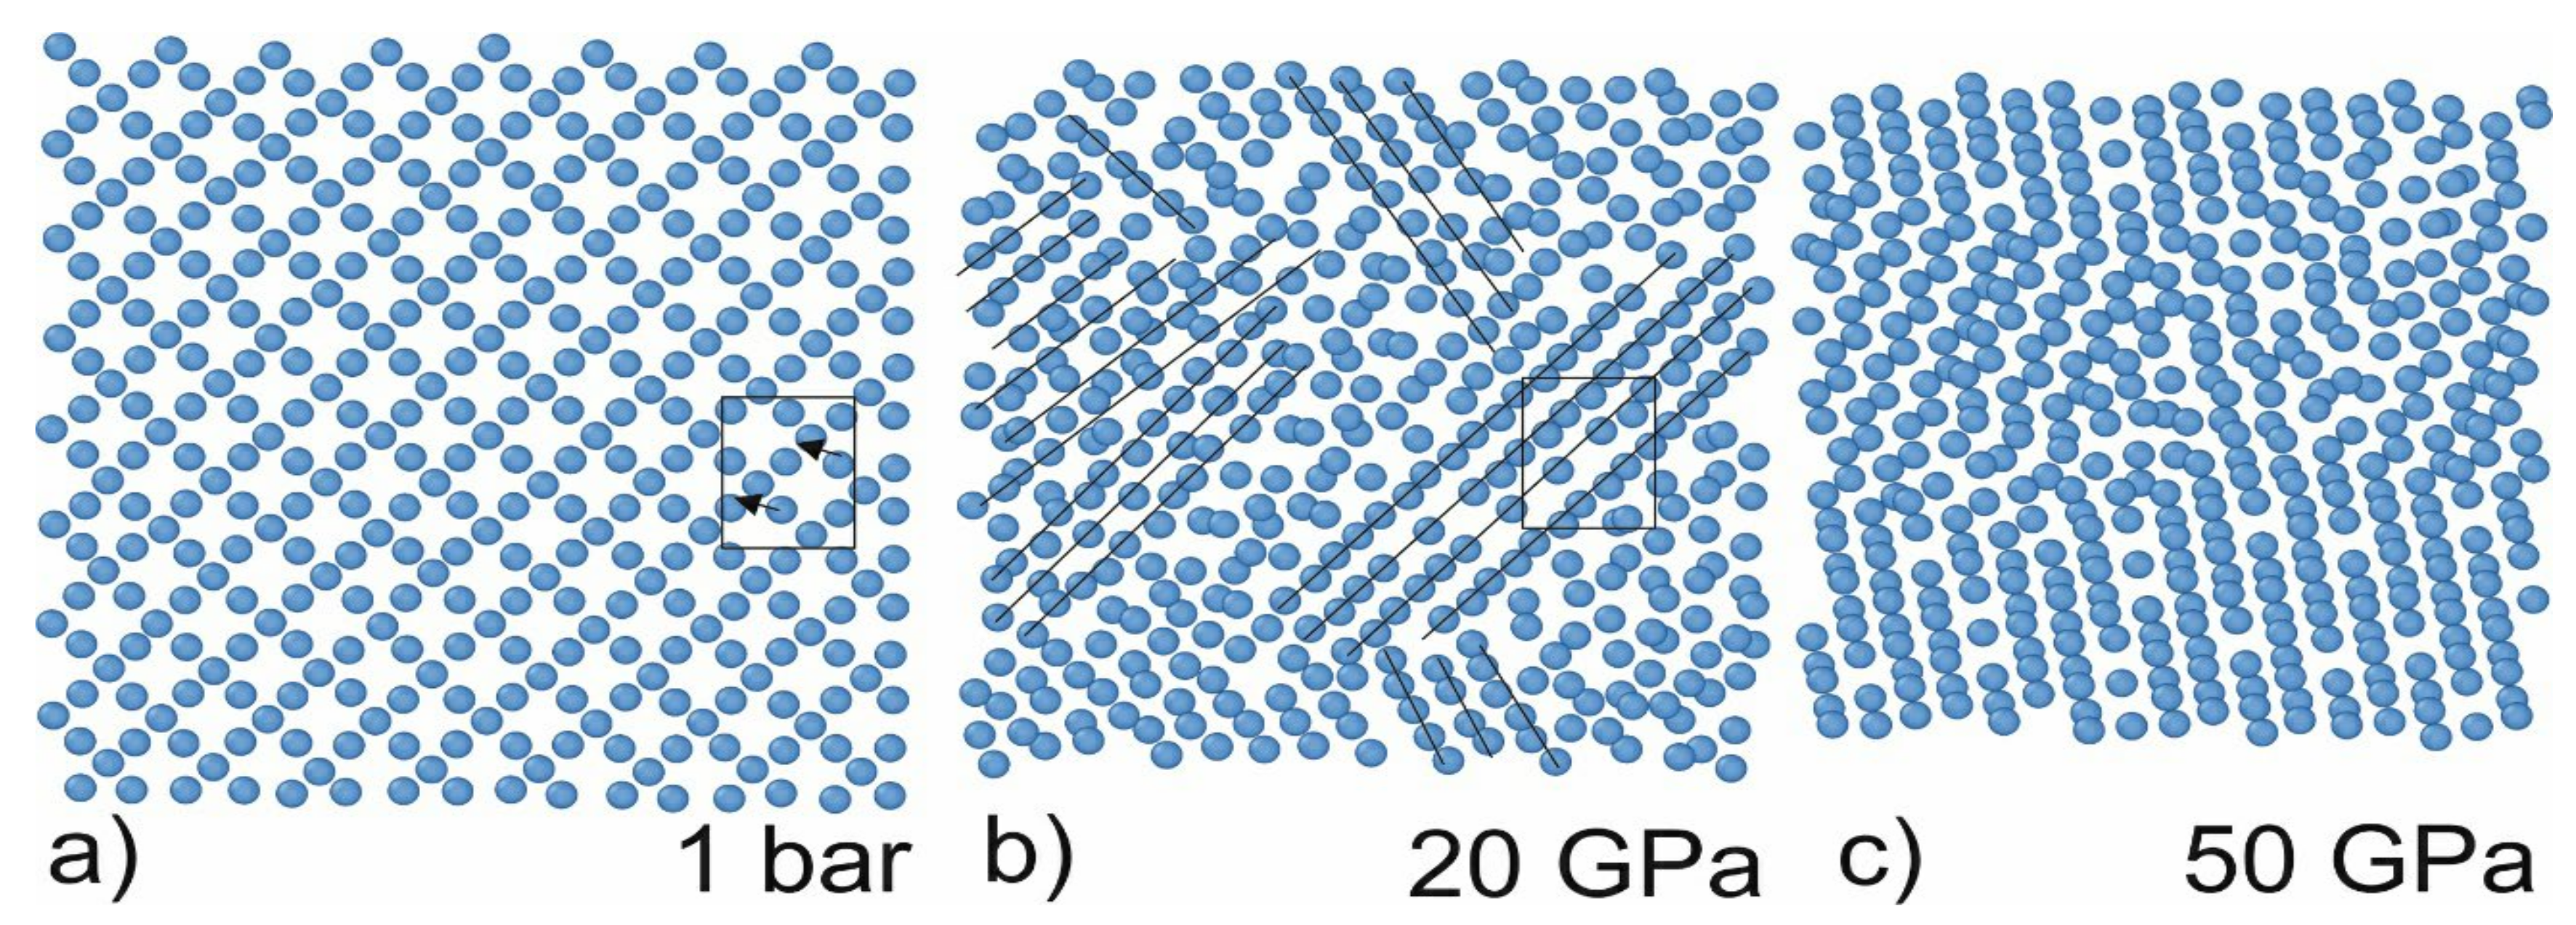
Figure 1. Cross-sections of the simulation cell along the z-axis under different pressures. The height of the layer is 4A (two atomic layers). The arrows indicate atom shifts during phase transition: under hydrostatic pressure, central atom shifts (arrows show the shift direction) and form a new lattice. The new phases arise in the vicinity of the defect; therefore, the direction of the lattice is random. The black lines indicate the rows in the same direction. (a) α-diamond phase (b) β-Sn phase (c) hcp phase.
The phase transition in Si leads to the jump in the atomic volume, centrosymmetry parameter, and XRD spectrum. In the other cases, smooth changes in these parameters occur. For example, under normal conditions, the atomic volume of Si is about 20 A3, as shown in the histogram presented in Figure 2a. The phase transition occurred under pressure of about 11 ± 1 GPa, leading to the jump in atomic volume (~16 A3) as shown in Figure 2a. The phase transition leads to the change in the centrosymmetric parameter: new peaks in the histogram appear (see Figure 2b). Moreover, the XRD spectrum is significantly changed: the amplitude of all peaks is decreased, and new peaks (for example, at 35°) appear. The following pressure increase does not lead to the jump in the atomic volume or centrosymmetry parameter (until reaching 45 GPa). The mean value of the atomic volume is smoothly shifted toward lower values. The histogram of the centrosymmetry parameter transforms from a one-peak structure in the cubic-diamond phase to the three-peak structure in the β-Sn phase. The most contrasting picture of a three-peak structure is observed under 30 GPa pressure. The β-Sn phase is stable under pressures below 45 GPa; the atomic volume in this phase can be as low as 14 A3. Therefore, the change in Si structure leads to the jump in atomic volume, as well as the changes in the centrosymmetry parameter and XRD spectrum. The latter is the most important because it can be observed experimentally.
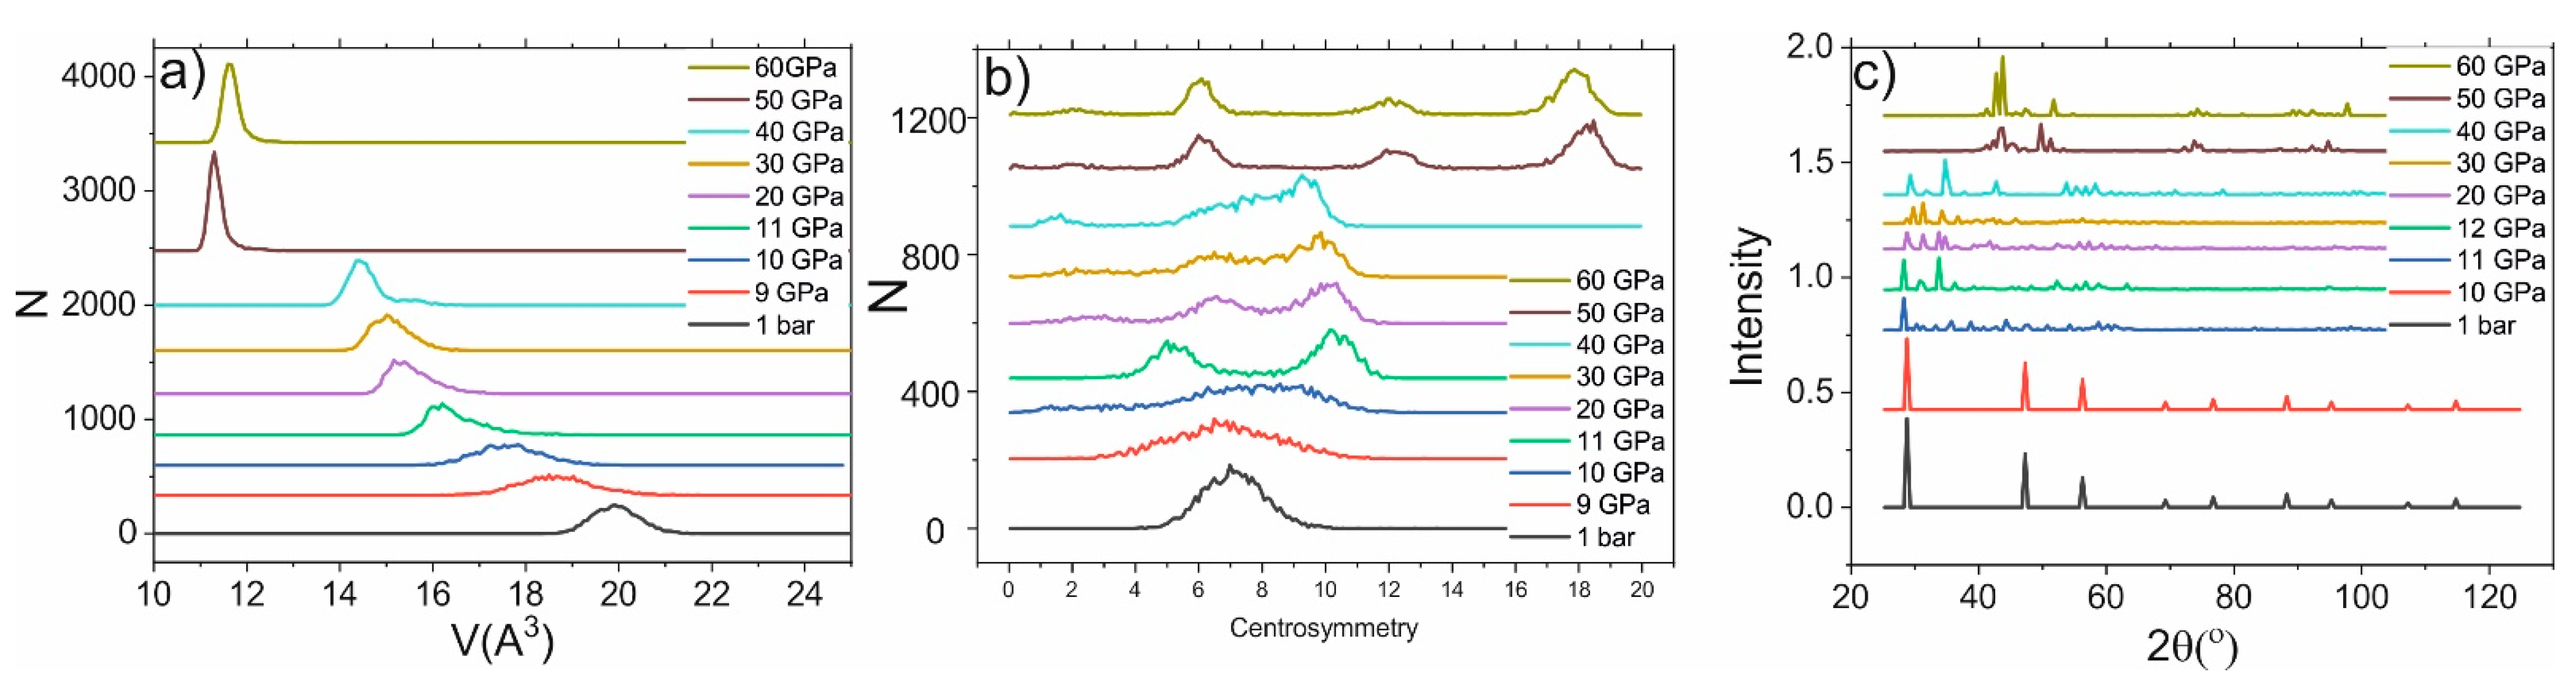
Figure 2. (a) Histogram of atomic-volume distribution under different pressures. (b) Histogram of centrosymmetry-parameter distribution under different pressures (c) XRD spectra under different pressures.
3. Non-Stationary Conditions
The next series of simulations were performed in order to retrieve the ultrafast dynamics of the phase transition induced by the shock impact, which is demonstrated in Figure 3. From the previous simulation, it was observed observed that the transition to the β-Sn phase is accompanied by a jump in the atomic volume to 16 A3 (see Figure 3a,b), a change in centrosymmetry parameter, and new peaks in the XRD spectrum. First, researchers obtained the profile of the particle-velocity (the velocity of Particle A in a medium as it transmits a wave) z-component and atomic volume for the piston velocities of 3 km/s and 1 km/s (Figure 3c,d). Under the impact of a 3 km/s piston, the profiles demonstrate a jump in the atomic volume up to 14.5 A3. The volume reaches this level on the shock-wave front. After passing the shock-wave front, the volume relaxes to 20 A3. Thereby, a running along the z-axis region of the β-Sn phase arises (see Figure 3). The amount of new phase growth during shock-wave propagation is due to the broadening of the shock-wave front. Under 1 km/s piston speed, the amplitude of the shock wave is not enough to achieve β-Sn phase (there is no jump to 16 A3 atomic volume).
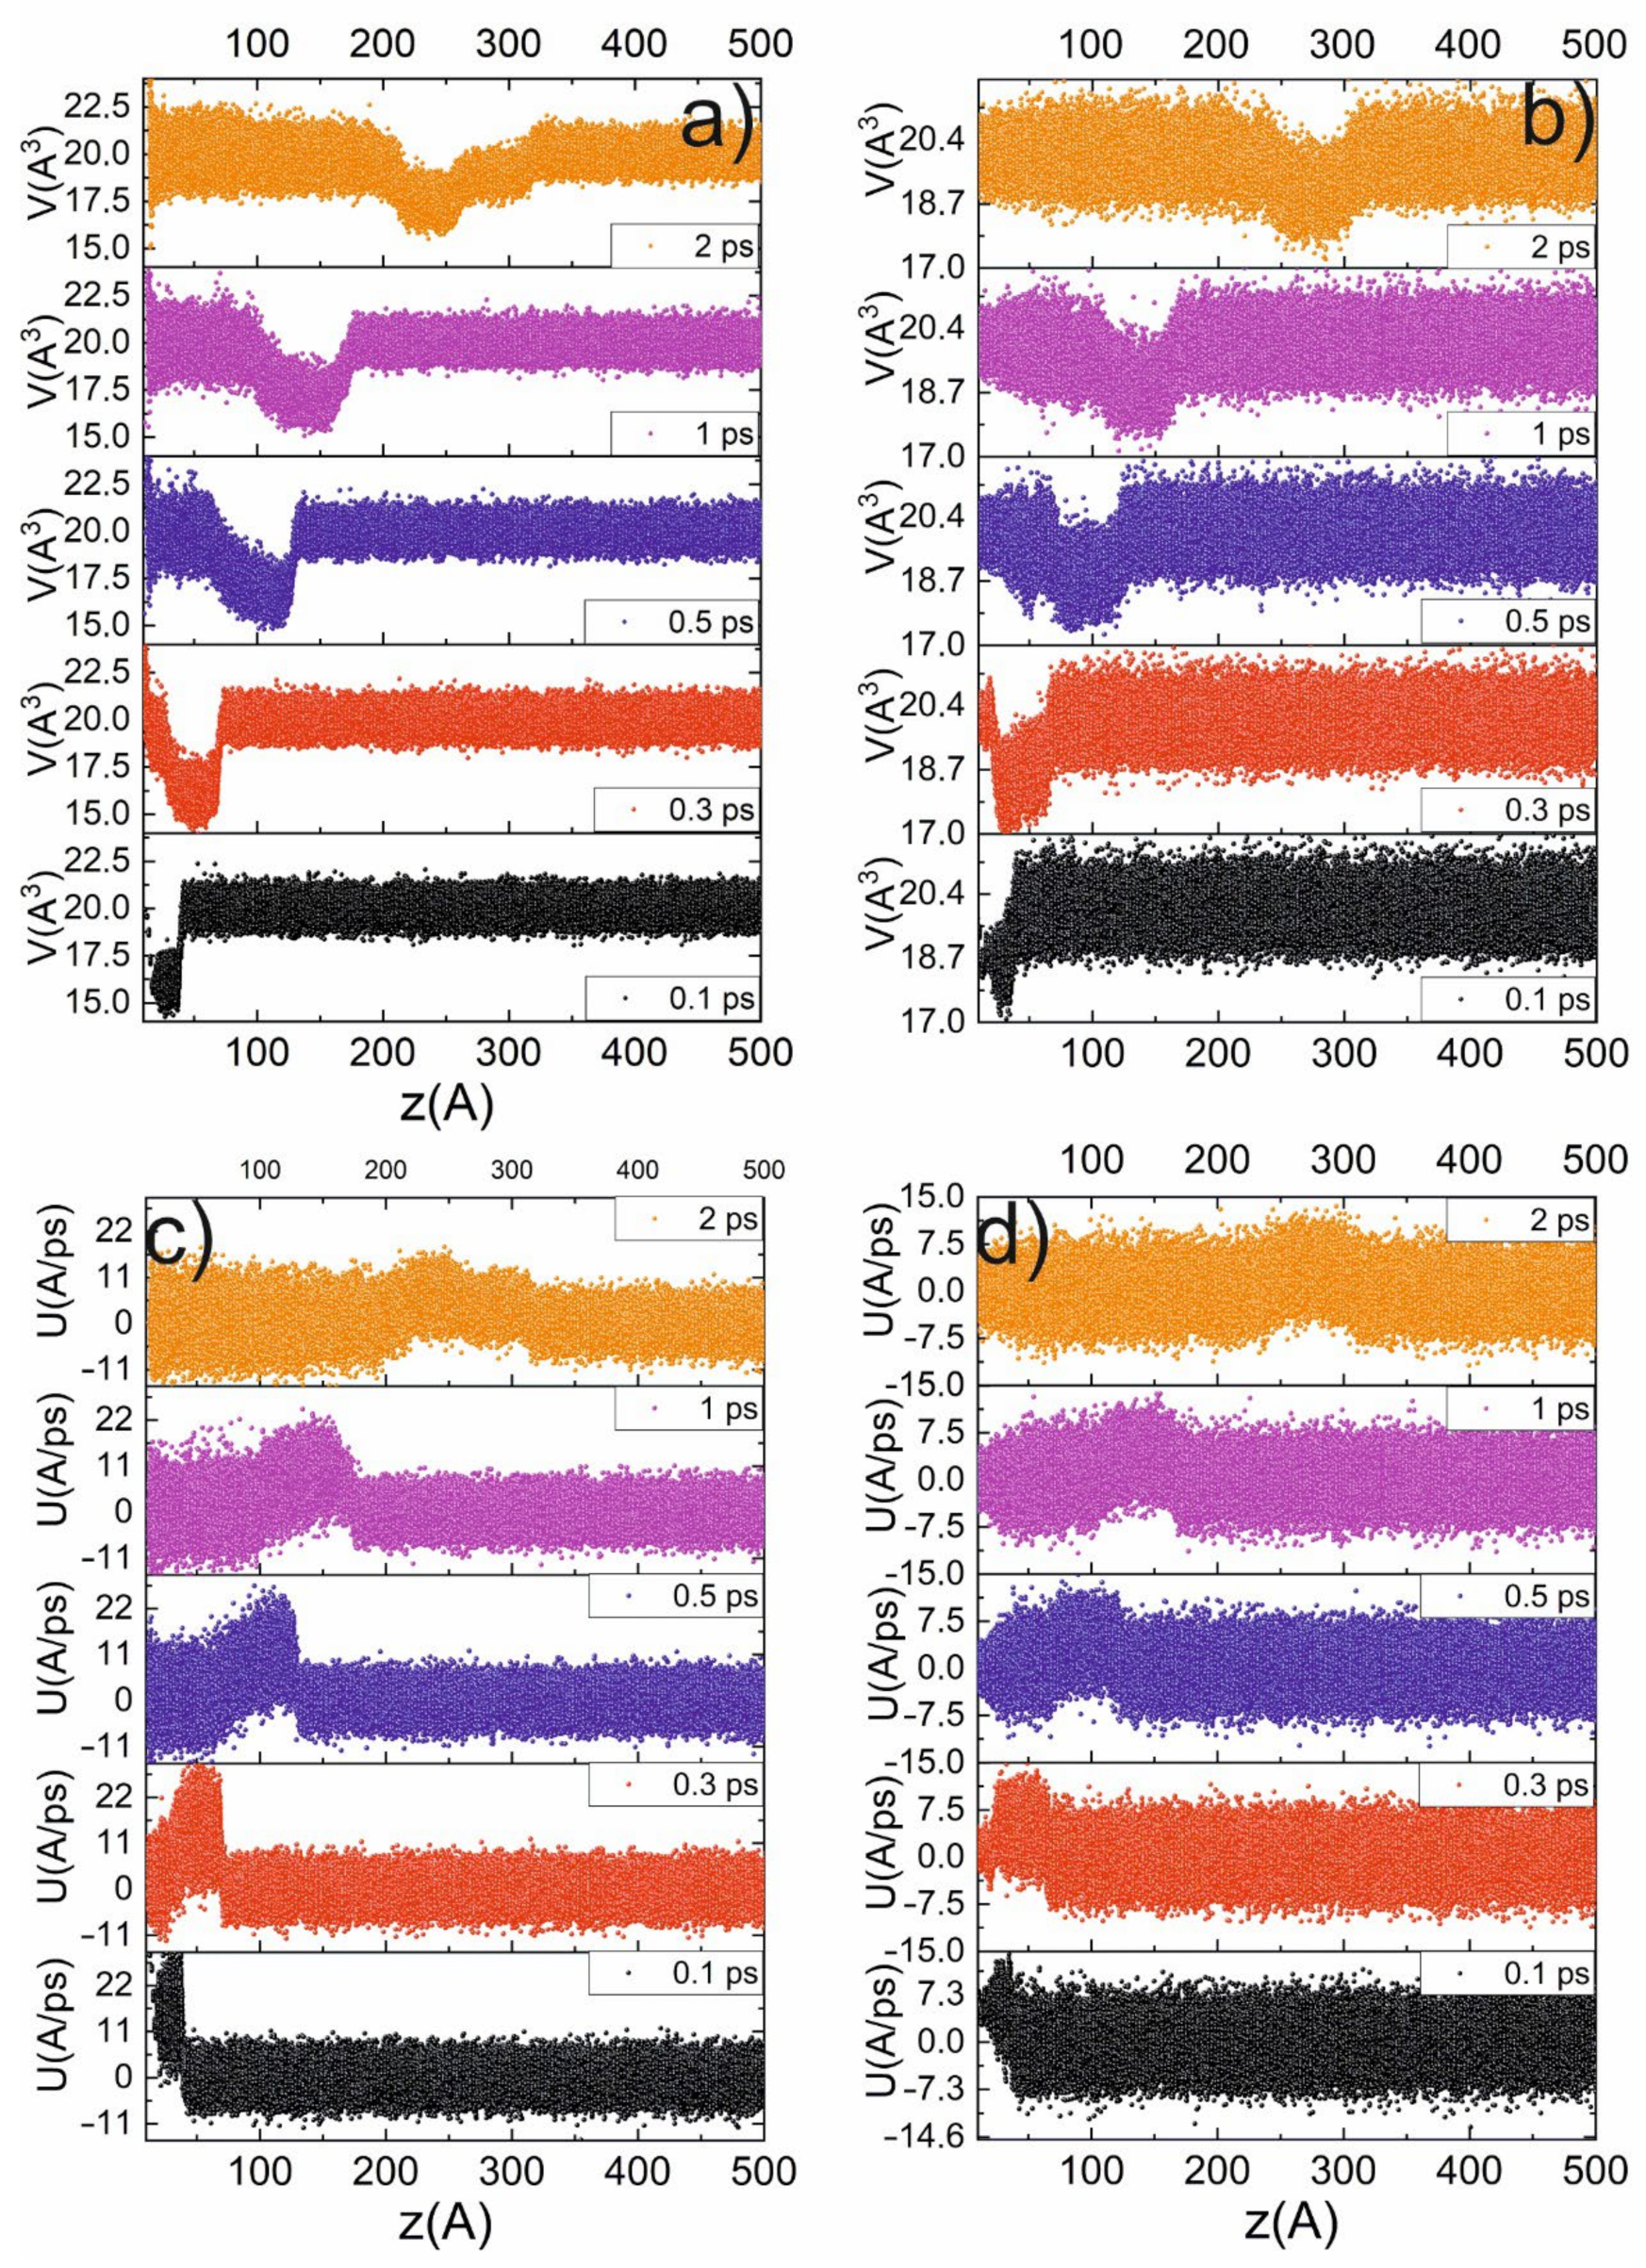
Figure 3. Profiles (along z-axis) of atomic volume (a,b) and particle velocity (c,d) at different time delays for 3 km/s (a,c) and 1 km/s (b,d) piston velocities.
During propagation, the amplitude of the shock wave drops and the width of the shock-wave front is increased. The peak shock-wave velocity is about 15 km/s, which is similar to the results obtained for (111) Si [32]. The shock-wave velocity rapidly (about 2–3 ps) decays and the shock wave loses about 75% of its energy, and the corresponding particle velocity decays similarly (see Figure 4). The phase transition mainly occurs during this time interval (when the shock wave loses 75% energy). The dependence between shock and particle velocity is presented in Figure 4 (see inset) and represents its shock adiabat [32].
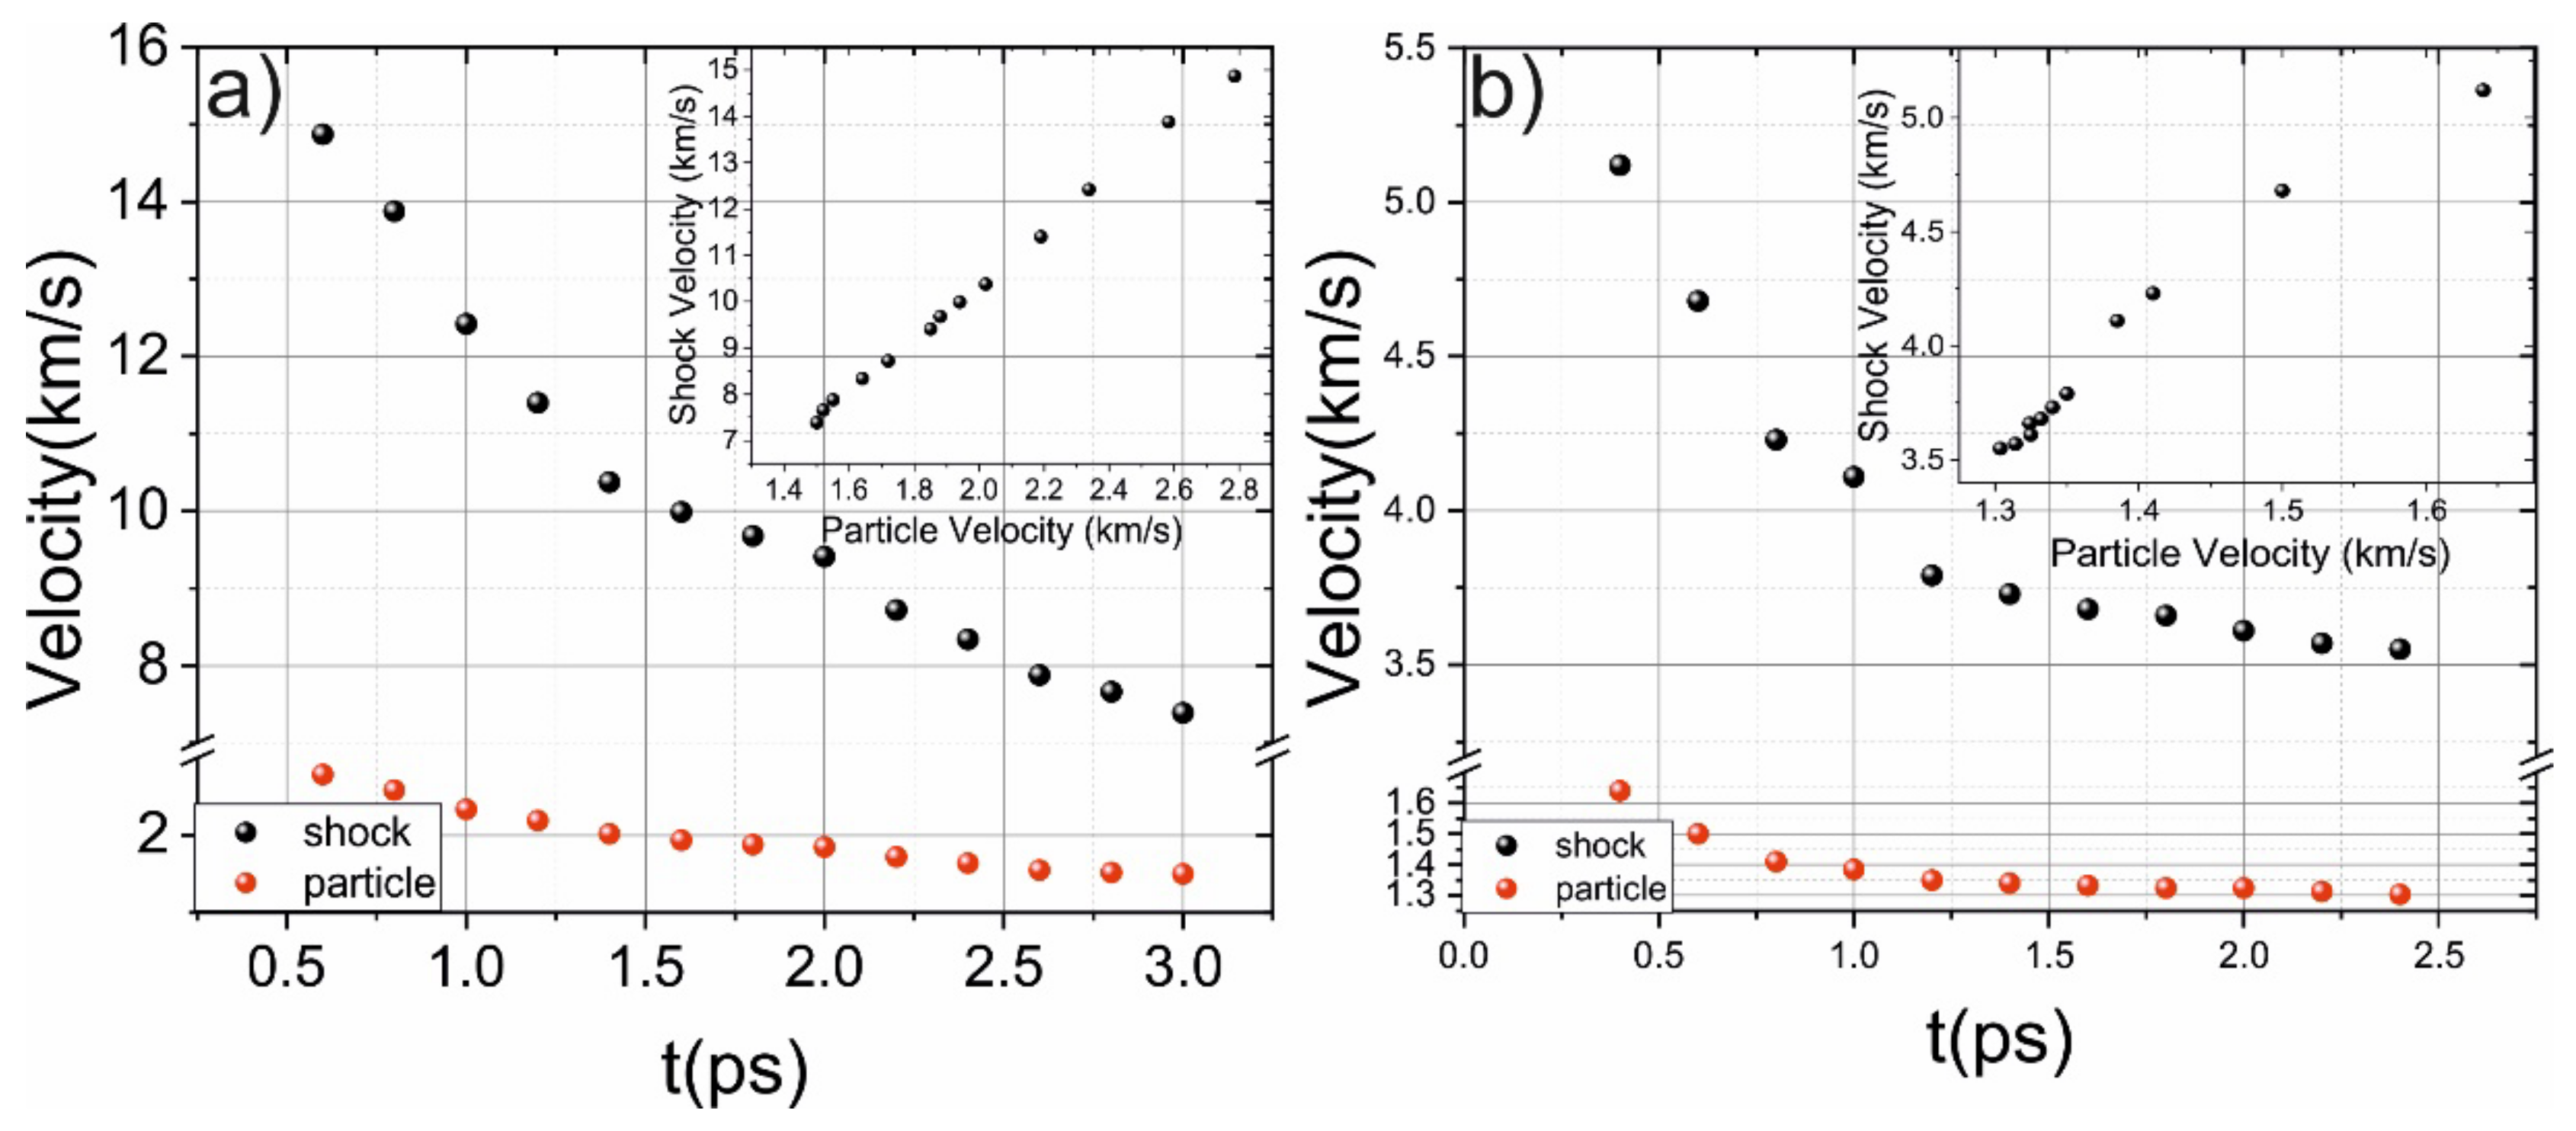
Figure 4. (a) Evolution of shock (black dots) and particle velocity for 3 km/s piston velocity (a) and 1 km/s piston velocity (b). The insets demonstrate dependence between shock and particle velocity.
Under pressures achieved under such an impact, a compression of Si becomes inelastic and exhibits the “anomalous” elastic waves [33]. The additional increase in piston velocity leads to the destruction of the first several layers of the sample. The appearance of these waves could be a result of ultrafast phase transitions to the β-Sn phase, which exists only on the shock-wave front. After passing about 30μm, the amplitude on the shock-wave front is not enough to induce a transition to the β-Sn phase; therefore, the phase transition occurs only in the vicinity of the sample boundary. Under the impact of a 1 km/s shock wave, the shock-wave pressure is not enough to induce the transition of the detectable volume of Si (~10–20 atoms are in β-Sn phase). Such a small amount of material in a new phase demonstrates the extremely small probability of transition to the β-Sn phase (under 1 km/s particle velocity) and to their knowledge, there are no experimental techniques able to detect this new phase. Therefore, it could be said that the phase transition to the β-Sn phase could not occur under such conditions.
Moreover, the histograms of the atomic-volume distributions, the distribution of the centrosymmetry parameter, and the XRD spectrum of the volume affected by the shock wave (30 × 30 × 50-unit cells i.e., a layer containing 50 atom layers) were retrieved. The evolution of these distributions is presented in Figure 5. It demonstrates that the shock wave perturbates the initially Gaussian distribution of the atomic volume. The propagation of the shock wave (see Figure 5) is accompanied by the appearance of a second peak in the vicinity of 16 A3. The peak at 20 A3 rapidly transforms to 16 A3. It indicates the phase transition to the β-Sn phase, and the first peak shows that the cubic-diamond structure of Si vanishes. A beginning of the transformation to the beta-Sn phase after 200 fs is observed. The change in the centrosymmetry parameter (CSP), atomic volume, and XRD spectrum associated with the transition to the β-Sn phase is obtained during propagation of the shock wave (see Figure 5).
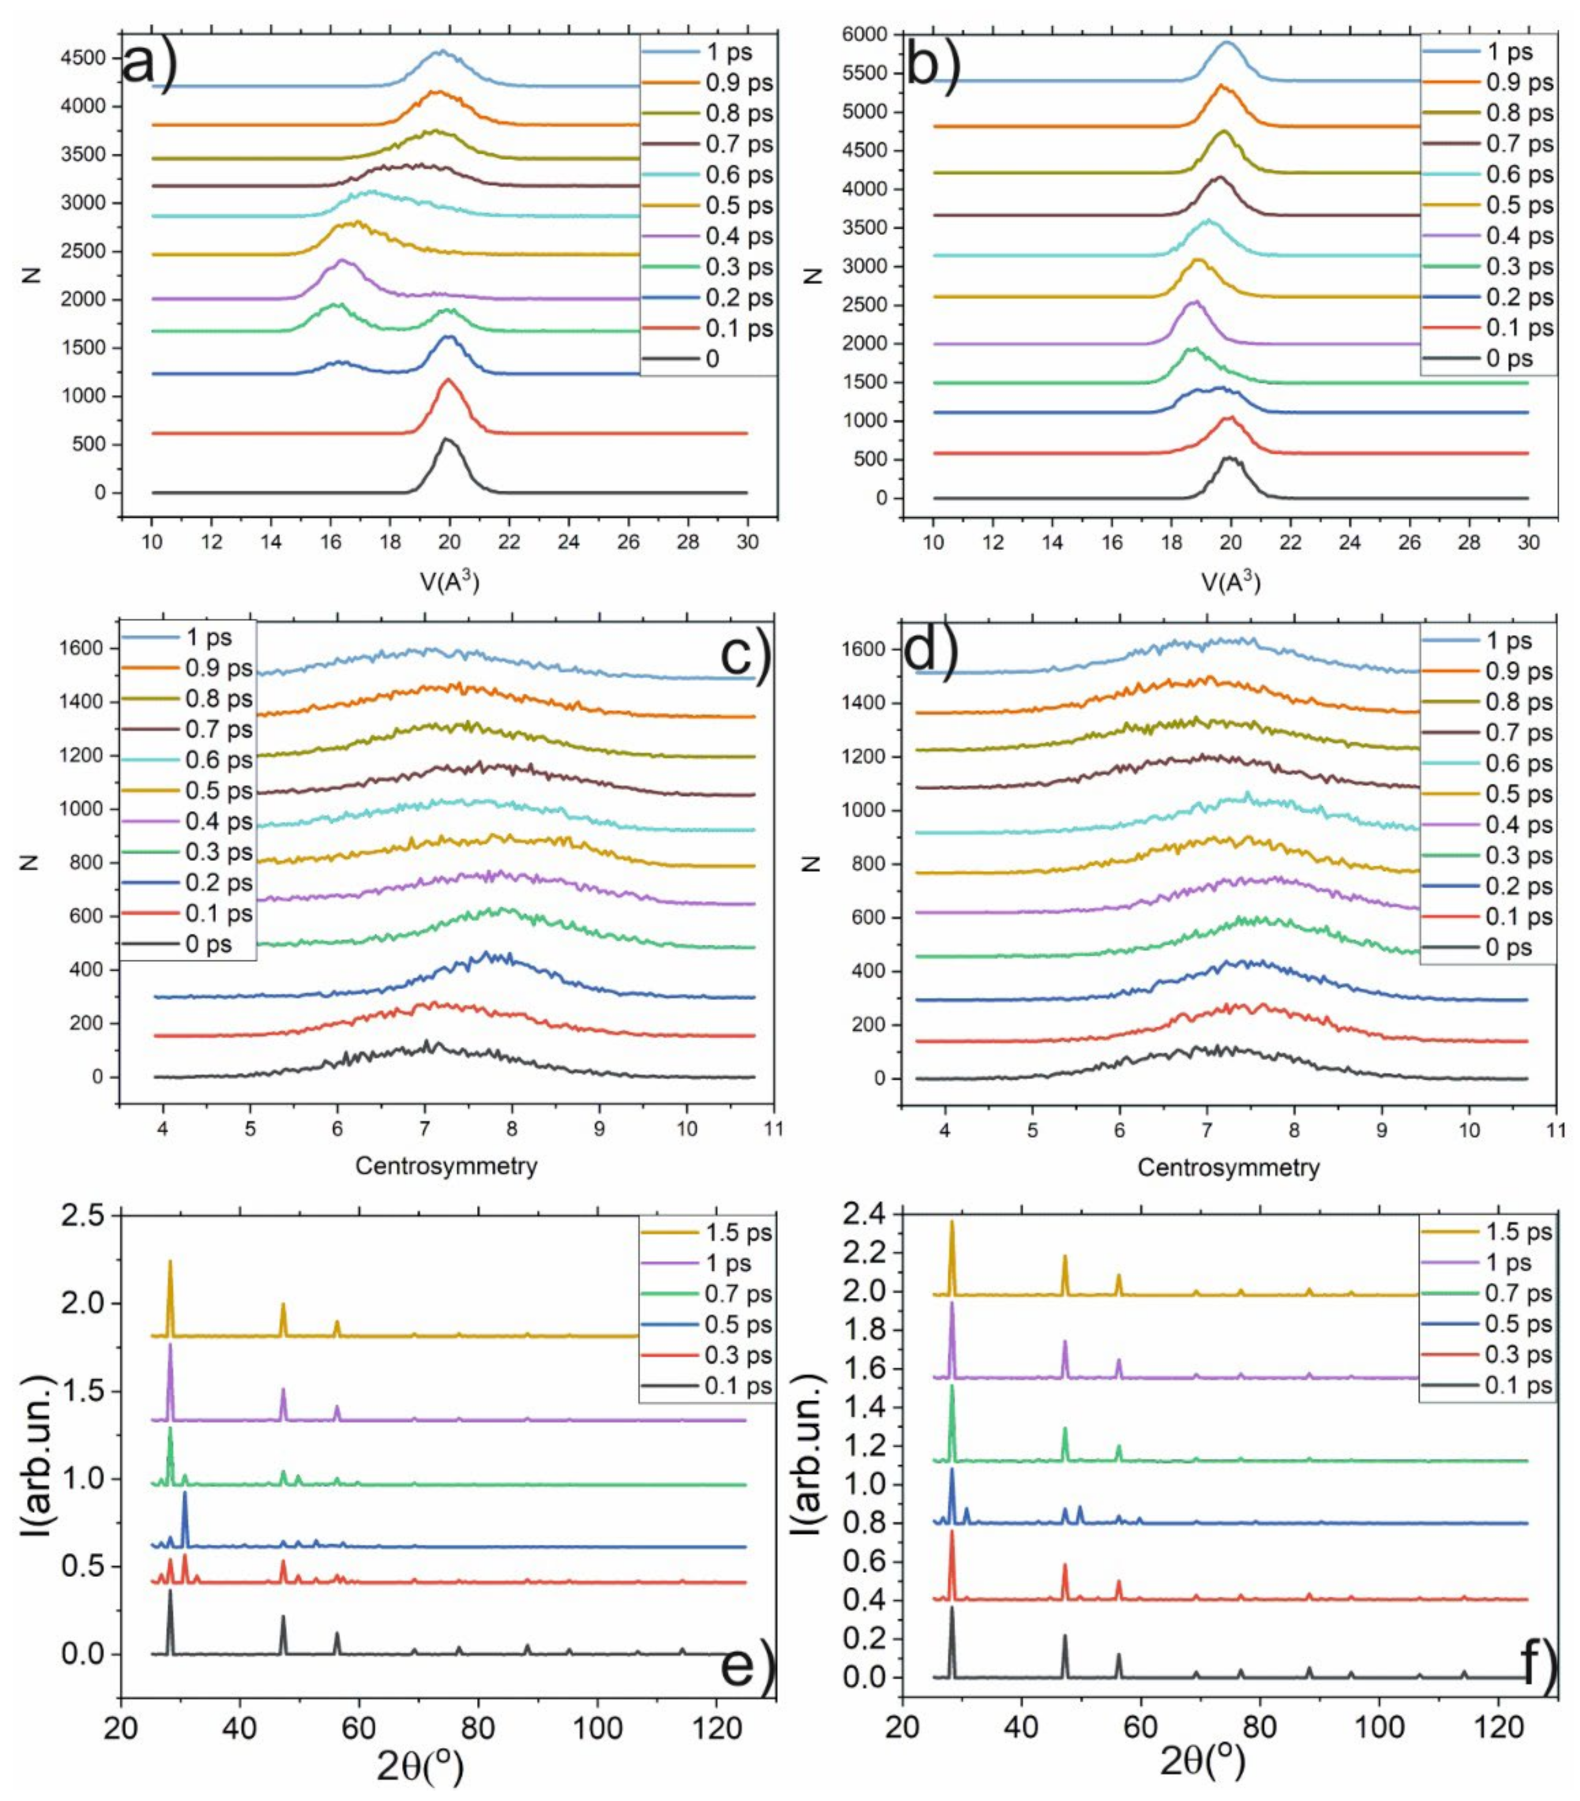
Figure 5. Evolution of the atomic volume distribution (a,b), distribution of CSP (c,d) and XRD spectrum in the case of 3 km/s piston velocity (a,c,e) and 1 km/s piston velocity (b,d,f) in the volume affected by shock wave (30 × 30 × 50 unit cells).
As the last part of the analysis, researchers obtained the intensity (z-t) maps of the shock-wave velocity, shock-wave pressure, and atomic volume (see Figure 6) in order to better localize the phase transition in the time-and-space domain. The intensity maps show that a phase transition could occur only in small regions in the z-t diagram. The maximal achieved pressure is 27.4 GPa for 3 km/s piston velocity and 8.1 GPa for 1 km/s. The areas marked as red and orange in Figure 6c,d indicate the transition to the new phase with an atomic volume of about 10 A3. The pressure necessary for the transition is about 11 GPa, which is in good agreement with the threshold pressure obtained under stationary conditions. As can be seen from Figure 6, the area of the phase transition is increased with time as a result of shock-wave-front broadening. However, when the pressure drops below the threshold value, the phase transition will not occur. It is important to note that an increase in initial perturbation (from δ-function to a Heaviside or exponential-decay function) does not significantly change the observed phenomena. It will increase the phase-transition region due to the increase in the shock-wave front.
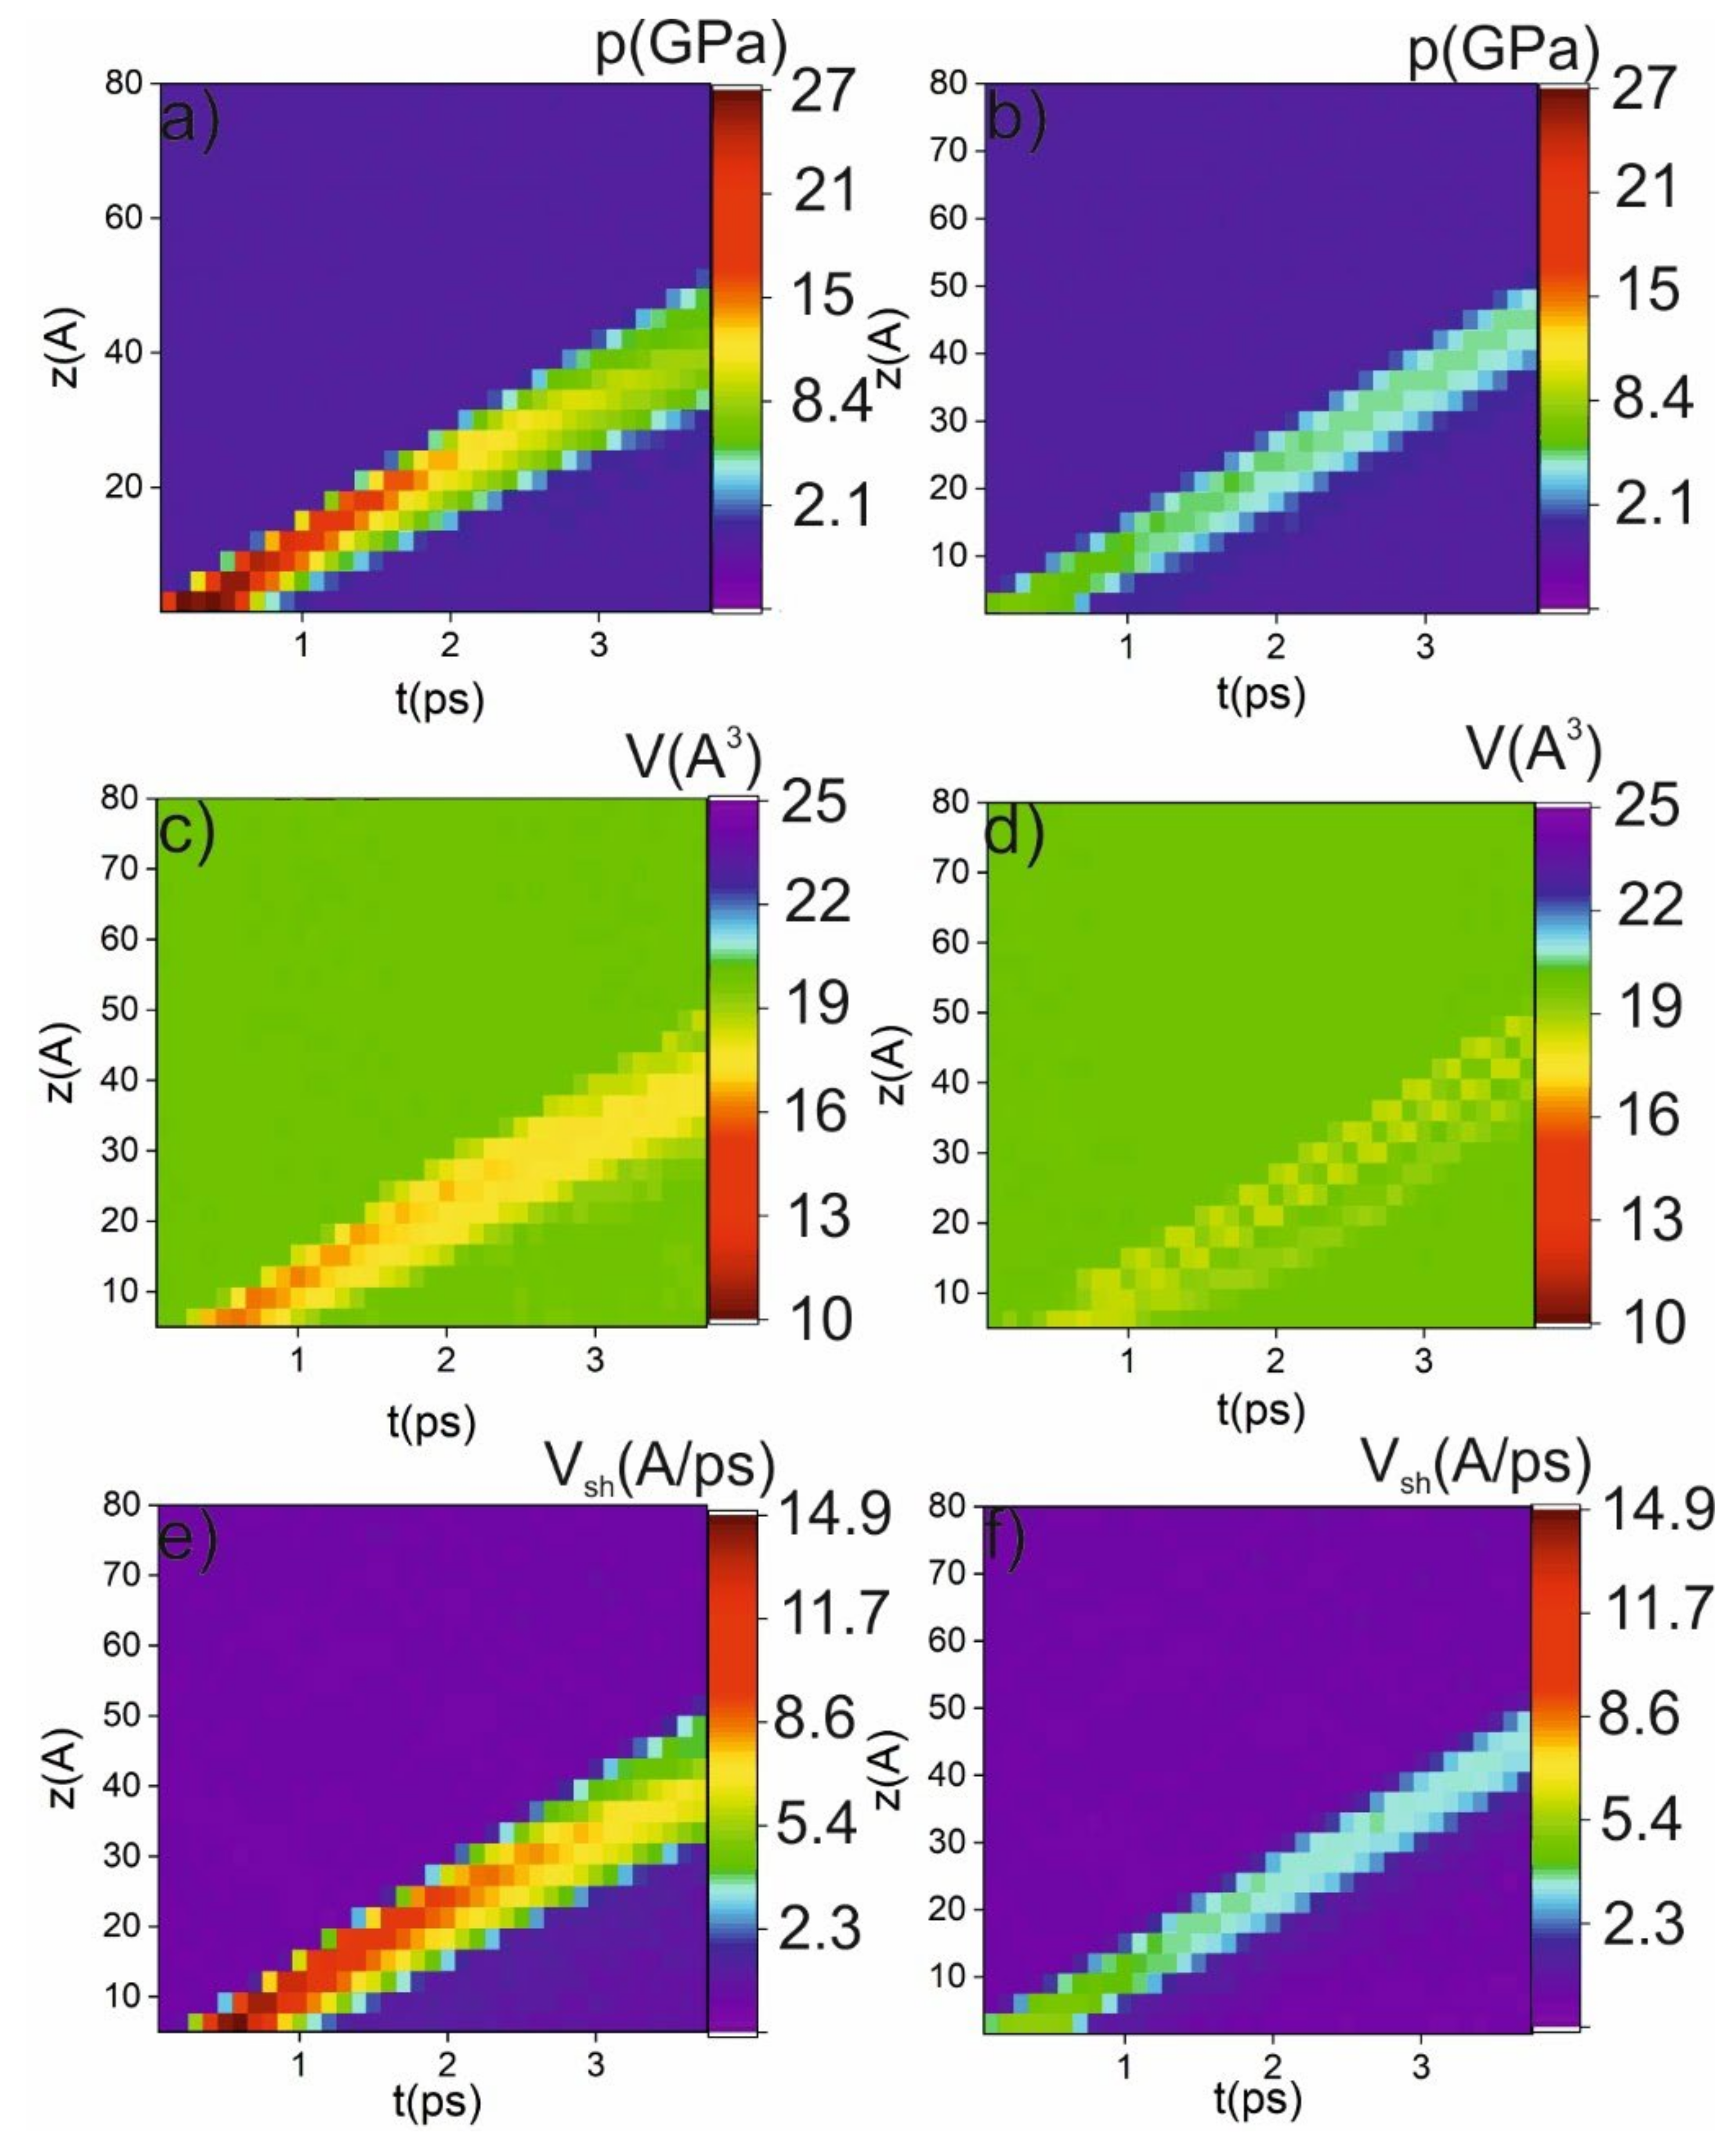
Figure 6. Intensity maps of pressure (a,b), atomic volume (c,d) and shock-wave velocity (e,f) in the case of 3 km/s piston velocity (a,c,e) and 1 km/s piston velocity (b,d,f).
MD shows that the further growth of the piston velocity (above 3 km/s) will lead to the destruction of the Si lattice, and the structure in the thin layer will not relax to the initial state. The relaxation velocity depends on the initial amplitude of the shock wave and the width of the shock-wave front. An increase of the piston velocity above 3 km/s (or the width of the shock-wave front) leads to the destruction of the Si lattice and amorphous Si is formed (at least at the several microseconds time interval). The amorphous region for 4 km/s piston velocity is about 20 A deep. This region is presented in Figure 7c as a growing laser with a temperature (a measure of the kinetic energy of molecules) ~ melting temperature. On a microsecond timescale and under such conditions, the phase transition becomes irreversible, and it can be detected post-mortem.
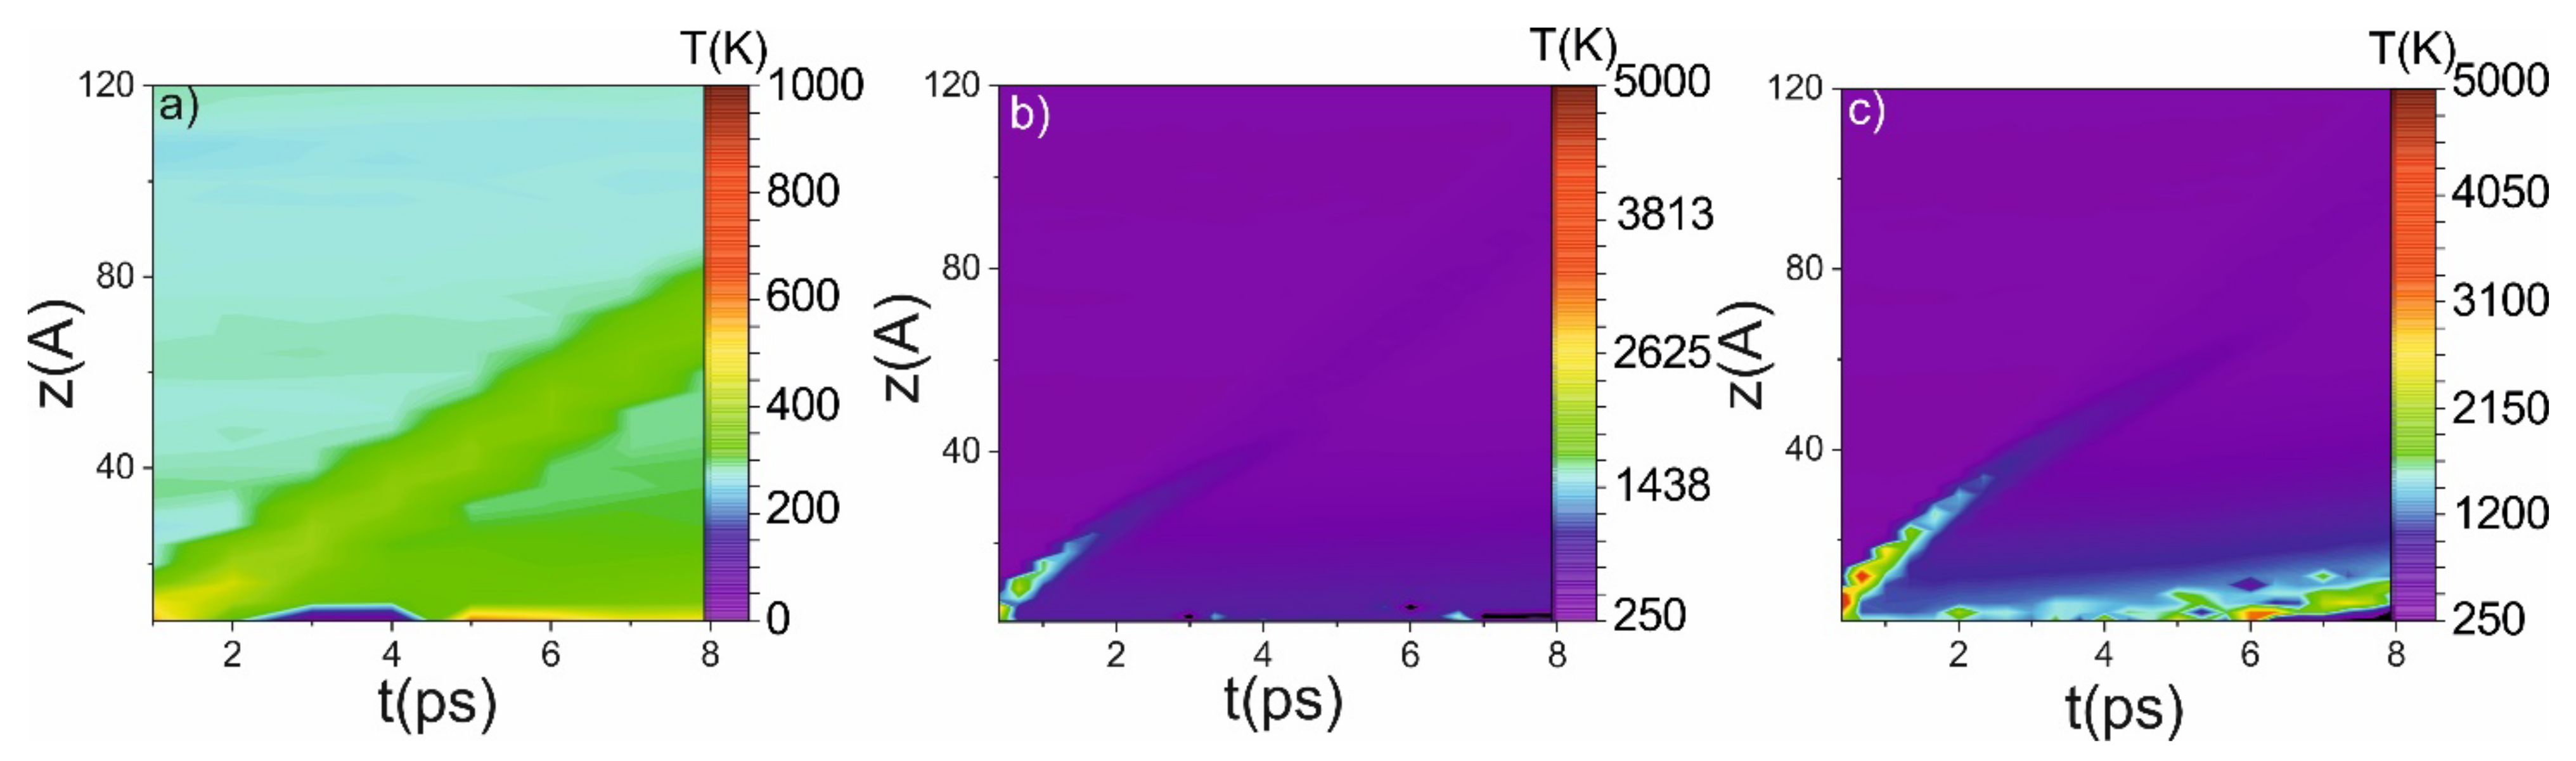
Figure 7. Intensity maps of temperature in the case of 1 km/s (a), 3 km/s (b) and 4 km/s (c) piston velocity. The initial temperature is 305 K, the melting temperature is 1683 K.
The possible source of the lattice destruction could be its overheating (temperature above the melting temperature of 1683 K). The temperature of the shock front grows due to the adiabatic compression of the material. Both in the cases of 3 km/s and 4 km/s of piston velocity, the temperature on the shock front overcomes the melting threshold (see Figure 7). Nevertheless, the instantaneous temperature itself does not lead to the melting of the material because the process of the lattice destruction could not occur on the sub-ps timescale while the temperature of the lattice has to be higher than the melting point of the material. It takes place when the piston velocity is 4 km/s. In this case, under the shock impact, the temperature of several boundary layers is higher during all simulation periods (see Figure 7c), which naturally leads to the amorphization of the Si, which can be detected post-mortem.
References
- Katzke, H.; Bismayer, U.; Tolédano, P. Theory of the high-pressure structural phase transitions in Si, Ge, Sn, and Pb. Phys. Rev. B 2006, 73, 134105.
- Budnitzki, M.; Kuna, M. Stress induced phase transitions in silicon. J. Mech. Phys. Solids 2016, 95, 64–91.
- Cheng, C. Uniaxial phase transition in Si:Ab initiocalculations. Phys. Rev. B 2003, 67, 134109.
- Sundaram, S.K.; Mazur, E. Inducing and probing non-thermal transitions in semiconductors using femtosecond laser pulses. Nat. Mater. 2002, 1, 217–224.
- Lee, I.-H.; Jeong, J.-W.; Chang, K.J. Invariant-molecular-dynamics study of the diamond-to-Β-Sn transition in Si under hydrostatic and uniaxial compressions. Phys. Rev. B 1997, 55, 5689–5693.
- Hanfland, M.; Schwarz, U.; Syassen, K.; Takemura, K. Crystal Structure of the High-Pressure Phase Silicon VI. Phys. Rev. Lett. 1999, 82, 1197–1200.
- Jeong, S.-M.; Kitamura, T. Atomistic Simulation on the Phase Transformation of Silicon under Nonhydrostatic Stress. Jpn. J. Appl. Phys. 2007, 46, 5924–5929.
- Chang, K.J.; Cohen, M.L. Solid-solid phase transitions and soft phonon modes in highly condensed Si. Phys. Rev. B 1985, 31, 7819–7826.
- Erhart, P.; Albe, K. Analytical potential for atomistic simulations of silicon, carbon, and silicon carbide. Phys. Rev. B 2005, 71, 035211.
- Daisenberger, D.; Wilson, M.; McMillan, P.F.; Cabrera, R.Q.; Wilding, M.C.; Machon, D. High-pressure x-ray scattering and computer simulation studies of density-induced polyamorphism in silicon. Phys. Rev. B 2007, 75, 224118.
- Mogni, G.; Higginbotham, A.; Gaál-Nagy, K.; Park, N.; Wark, J. Molecular dynamics simulations of shock-compressed single-crystal silicon. Phys. Rev. B 2014, 89, 1–10.
- Mujica, A.; Rubio, A.; Muñoz, A.; Needs, R.J. High-pressure phases of group-IV, III–V, and II–VI compounds. Rev. Mod. Phys. 2003, 75, 863–912.
- Wippermann, S.; He, Y.; Vörös, M.; Galli, G. Novel silicon phases and nanostructures for solar energy conversion. Appl. Phys. Rev. 2016, 3, 040807.
- Pashaev, E.M.; Korchuganov, V.N.; Subbotin, I.A.; Likhachev, I.A.; Borisov, M.M.; Mareev, E.I.; Potemkin, F.V. Formation of Metastable Phase Si(III) in Silicon Exposed to Femtosecond Laser Radiation. Crystallogr. Rep. 2021, 66, 920–922.
- Naghilou, A.; Armbruster, O.; Kautek, W. Femto- and nanosecond pulse laser ablation dependence on irradiation area: The role of defects in metals and semiconductors. Appl. Surf. Sci. 2017, 418, 487–490.
- Norman, G.E.; Starikov, S.V.; Stegailov, V.V.; Saitov, I.M.; Zhilyaev, P.A. Atomistic Modeling of Warm Dense Matter in the Two-Temperature State. Contrib. Plasma Phys. 2013, 53, 129–139.
- Smith, M.J.; Lin, Y.-T.; Sher, M.-J.; Winkler, M.T.; Mazur, E.; Gradečak, S. Pressure-induced phase transformations during femtosecond-laser doping of silicon. J. Appl. Phys. 2011, 110, 053524.
- McBride, E.E.; Krygier, A.; Ehnes, A.; Galtier, E.; Harmand, M.; Konôpková, Z.; Lee, H.J.; Liermann, H.-P.; Nagler, B.; Pelka, A.; et al. Phase transition lowering in dynamically compressed silicon. Nat. Phys. 2018, 15, 89–94.
- Weisshaupt, J.; Juvé, V.; Holtz, M.; Ku, S.; Woerner, M.; Elsaesser, T.; Ališauskas, S.; Pugzlys, A.; Baltuška, A. High-brightness table-top hard X-ray source driven by sub-100-femtosecond mid-infrared pulses. Nat. Photon. 2014, 8, 927–930.
- Johnson, A.S.; Avni, T.; Larsen, E.W.; Austin, D.R.; Marangos, J.P. Attosecond soft X-ray high harmonic generation. Philos. Trans. R. Soc. London. Ser. A Math. Phys. Eng. Sci. 2019, 377, 20170468.
- Murnane, M.M.; Kapteyn, H.C.; Rosen, M.D.; Falcone, R.W. Ultrafast X-ray Pulses from Laser-Produced Plasmas. Science 1991, 251, 531–536.
- Lindenberg, A.M.; Johnson, S.L.; Reis, D.A. Visualization of Atomic-Scale Motions in Materials via Femtosecond X-Ray Scattering Techniques. Annu. Rev. Mater. Sci. 2017, 47, 425–449.
- Lindenberg, A.M.; Larsson, J.; Sokolowski-Tinten, K.; Gaffney, K.J.; Blome, C.; Synnergren, O.; Sheppard, J.; Caleman, C.; MacPhee, A.G.; Weinstein, D.; et al. Atomic-Scale Visualization of Inertial Dynamics. Science 2005, 308, 392–395.
- Wittenberg, J.S.; Miller, T.A.; Szilagyi, E.; Lutker, K.; Quirin, F.; Lu, W.; Lemke, H.T.; Zhu, D.; Chollet, M.; Robinson, J.; et al. Real-Time Visualization of Nanocrystal Solid–Solid Transformation Pathways. Nano Lett. 2014, 14, 1995–1999.
- Xiong, Q.-L.; Kitamura, T.; Li, Z. Transient phase transitions in single-crystal coppers under ultrafast lasers induced shock compression: A molecular dynamics study. J. Appl. Phys. 2019, 125, 194302.
- Sokolowski-Tinten, K.; Blome, C.; Blums, J.; Cavalleri, A.; Dietrich, C.; Tarasevitch, A.; Uschmann, I.; Förster, E.; Kammler, M.; Horn-Von-Hoegen, M.; et al. Femtosecond X-ray measurement of coherent lattice vibrations near the Lindemann stability limit. Nature 2003, 422, 287–289.
- Plimpton, S. Fast Parallel Algorithms for Short-Range Molecular Dynamics. J. Comput. Phys. 1995, 117, 1–19.
- Schaffer, C.B.; Brodeur, A.; Mazur, E. Laser-induced breakdown and damage in bulk transparent materials induced by tightly focused femtosecond laser pulses. Meas. Sci. Technol. 2001, 12, 1784–1794.
- Vailionis, A.; Gamaly, E.G.; Mizeikis, V.; Yang, W.; Rode, A.; Juodkazis, S. Evidence of superdense aluminium synthesized by ultrafast microexplosion. Nat. Commun. 2011, 2, 445.
- Potemkin, F.; Mareev, E.; Bezsudnova, Y.; Platonenko, V.; Bravy, B.; Gordienko, V. Controlled energy deposition and void-like modification inside transparent solids by two-color tightly focused femtosecond laser pulses. Appl. Phys. Lett. 2017, 110, 163903.
- Mareev, E.I.; Rumiantsev, B.V.; Potemkin, F.V. Study of the Parameters of Laser-Induced Shock Waves for Laser Shock Peening of Silicon. J. Exp. Theor. Phys. Lett. 2020, 112, 739–744.
- Oleynik, I.I.; Zybin, S.V.; Elert, M.L.; White, C.T. Nanoscale Molecular Dynamics Simulaton of Shock Compression of Silicon. AIP Conf. Proc. 2006, 845, 413–416.
- Higginbotham, A.; Stubley, P.G.; Comley, A.J.; Eggert, J.H.; Foster, J.M.; Kalantar, D.H.; McGonegle, D.; Patel, S.; Peacock, L.J.; Rothman, S.D.; et al. Inelastic response of silicon to shock compression. Sci. Rep. 2016, 6, 24211.
More
Information
Subjects:
Chemistry, Physical
Contributor
MDPI registered users' name will be linked to their SciProfiles pages. To register with us, please refer to https://encyclopedia.pub/register
:
View Times:
698
Revisions:
2 times
(View History)
Update Date:
04 Mar 2022
Table of Contents


Notice
You are not a member of the advisory board for this topic. If you want to update advisory board member profile, please contact office@encyclopedia.pub.
OK
Confirm
Only members of the Encyclopedia advisory board for this topic are allowed to note entries. Would you like to become an advisory board member of the Encyclopedia?
Yes
No
${ textCharacter }/${ maxCharacter }
Submit
Cancel
Back
Comments
${ item }
|
${ item.createdUser.fullName }
${ item.createdAt }
${ item.vote }
${ item.reply }
Delete
${ reply.createdUser.fullName }
${ reply.createdAt }
${ reply.vote }
Delete
There is no reply to this comment~
${ item.replyTextCharacter }/${ item.replyMaxCharacter }
Submit
Cancel
More
No more~
There is no comment~
${ textCharacter }/${ maxCharacter }
Submit
Cancel
${ selectedItem.replyTextCharacter }/${ selectedItem.replyMaxCharacter }
Submit
Cancel
Confirm
Are you sure to Delete?
Yes
No