Your browser does not fully support modern features. Please upgrade for a smoother experience.
Please note this is an old version of this entry, which may differ significantly from the current revision.
Subjects:
Chemistry, Physical
Researchers demonstrate an ultrafast (<0.1 ps) reversible phase transition in silicon (Si) under ultrafast pressure loading using molecular dynamics. Si changes its structure from cubic diamond to β-Sn on the shock-wave front. The phase transition occurs when the shock-wave pressure exceeds 11 GPa.
- phase transitions
- molecular dynamics
- shock waves
1. Introduction
Silicon is the most studied semiconductor; however, its high-pressure phases due to new theoretical and experimental techniques have only been actively examined in recent years [1,2,3,4]. Nowadays, it is possible to accurately investigate the high-pressure behavior of materials, such as structural properties, solid-to-solid phase transitions, and dynamical properties. Si under static pressure transforms from the diamond (Si-I) to the metallic β-Sn (Si-II) structure at around 11 GPa. Under higher pressure, the hexagonal close-packed (hcp-Si-VII), face-centered cubic (fcc-Si-X) and other structures have been examined as possible high-pressure phases of Si [2,5,6,7,8]. To summarize, silicon has eleven (or even more) distinct stable and metastable crystalline phases at high pressures. Numerical calculations have predicted the structural phase transition from cubic diamond to β-Sn (~11 GPa) and from β-Sn to hcp for Si (about 40 GPa) [3,5,9,10,11]. The hcp phase of Si is stable at about 40 GPa in diamond-cell experiments [2]. However, despite being reasonably well-understood under hydrostatic conditions, under dynamic loading, the phase transitions in Si remain a subject of debate [12]. Moreover, depending on the amplitude and time duration of loading, the final phase of Si is varied from amorphous to Ibam, BC8, hex. diamond (Si-IX), etc. [13,14]. The presumptive tree of phase transitions in Si primarily depends on the velocity of pressure release and do not take into account the role of temperature that would probably arise in the experiments, both in the case of laser ablation (when the laser pulse is directly focused onto the sample’s surface [15,16]) or shock-wave impact. Under such conditions, the phase transitions may be masked by the melting of Si and could not be detected post-mortem. Nowadays the time-resolved method that is applicable to the direct detection of phase transitions is limited by the time-resolved Raman scattering and X-ray diagnostics [17,18]. Recent progress in the generation of X-rays, both from free-electron lasers (FEL) and laser plasma, or from the high harmonic generation, which allows for the retrieval of the ultrafast dynamics of phase transitions [19,20,21]. Using such sources, the time-resolved experiments were successfully applied to the study of lattice dynamics [22,23], phase transitions [24,25], and phonon dynamics [26]. However, the experiments did not provide direct information about structural dynamics and atom motion. To “build a bridge” between observations in the experimental macroscopic parameters (such as Raman or XRD spectra) and the microstructure of the investigated sample, a numerical simulation is commonly applied [27]. Therefore, it is extremely important to perform numerical simulations to reveal the lattice dynamics that occurred between the start of the process and the formation of the final phase.
Under static conditions, the phase transitions in Si are widely investigated using the ab initio total-energy-pseudopotential method [5]; however, this method is not applicable to dynamical phase conditions. Recently, molecular dynamics were used to investigate the phase transitions induced by the shock wave in Si [11]. The authors demonstrated that the shear stress is relieved by an inelastic response associated with a partial transformation to a new high-pressure phase, where both the new phase and the original cubic-diamond phase are under close hydrostatic conditions. However, the dynamics of the phase transition were not investigated. In experiments, the multi-megabar pressures are usually achieved by high-intensity, ultrashort laser pulses [28,29,30]. For example, by combining a free-electron-laser (FEL)-based X-ray-diffraction geometry with laser-driven compression, the lowering of the hydrostatic phase boundary in elemental silicon was demonstrated [4]. The authors demonstrated melting above 14 GPa, which was previously ascribed to a solid-to-solid phase transition. For example, it is possible to achieve such pressures in laser shock peening experiments [31]. In the framework of the approach, the shock wave is generated in a buffer media (for example, water), and this shock wave affects the Si sample. This leads to the increase in the interaction region, which simplifies the X-ray-diffraction (XRD) experiments [31].
2. Stationary Conditions
The first set of simulations was performed under hydrostatic conditions. The simulations were performed with a 5 GPa step far from the phase-transition pressure and a 0.5 GPa step in the vicinity of the presumptive transition pressure. These simulations aimed to retrieve the atomic volume, XRD spectrum, and centrosymmetric parameter for different phases of Si. It was determined that Si is transformed from cubic diamond (atomic volume: 20 A3) to the β-Sn phase under the pressure of about 11 GPa. The phase is stable until reaching 45 GPa. At this pressure, the structure of Si is transformed to hcp (see Figure 1). The obtained data is in good agreement with the literature data [2]. The cross-section along the z-direction demonstrates that the structure of Si changes (shown by lines in Figure 1b). The non-symmetric nature of the structure change is raised because the phase transition starts from the inhomogeneities in the structure (no phase transitions were observed in the simulations of the ideal Si crystal). Therefore, the directions of the crystallites are random. This leads to a decrease in the peaks’ intensities in the XRD spectrum.
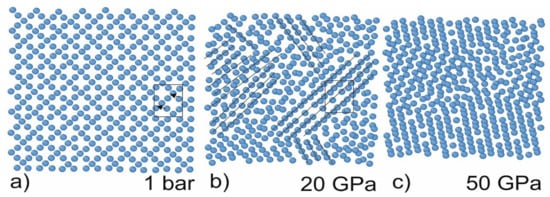
Figure 1. Cross-sections of the simulation cell along the z-axis under different pressures. The height of the layer is 4A (two atomic layers). The arrows indicate atom shifts during phase transition: under hydrostatic pressure, central atom shifts (arrows show the shift direction) and form a new lattice. The new phases arise in the vicinity of the defect; therefore, the direction of the lattice is random. The black lines indicate the rows in the same direction. (a) α-diamond phase (b) β-Sn phase (c) hcp phase.
The phase transition in Si leads to the jump in the atomic volume, centrosymmetry parameter, and XRD spectrum. In the other cases, smooth changes in these parameters occur. For example, under normal conditions, the atomic volume of Si is about 20 A3, as shown in the histogram presented in Figure 2a. The phase transition occurred under pressure of about 11 ± 1 GPa, leading to the jump in atomic volume (~16 A3) as shown in Figure 2a. The phase transition leads to the change in the centrosymmetric parameter: new peaks in the histogram appear (see Figure 2b). Moreover, the XRD spectrum is significantly changed: the amplitude of all peaks is decreased, and new peaks (for example, at 35°) appear. The following pressure increase does not lead to the jump in the atomic volume or centrosymmetry parameter (until reaching 45 GPa). The mean value of the atomic volume is smoothly shifted toward lower values. The histogram of the centrosymmetry parameter transforms from a one-peak structure in the cubic-diamond phase to the three-peak structure in the β-Sn phase. The most contrasting picture of a three-peak structure is observed under 30 GPa pressure. The β-Sn phase is stable under pressures below 45 GPa; the atomic volume in this phase can be as low as 14 A3. Therefore, the change in Si structure leads to the jump in atomic volume, as well as the changes in the centrosymmetry parameter and XRD spectrum. The latter is the most important because it can be observed experimentally.
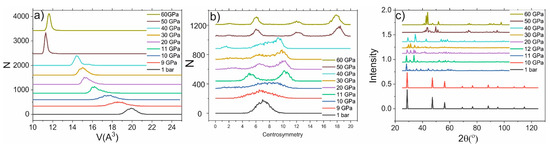
Figure 2. (a) Histogram of atomic-volume distribution under different pressures. (b) Histogram of centrosymmetry-parameter distribution under different pressures (c) XRD spectra under different pressures.
3. Non-Stationary Conditions
The next series of simulations were performed in order to retrieve the ultrafast dynamics of the phase transition induced by the shock impact, which is demonstrated in Figure 3. From the previous simulation, it was observed observed that the transition to the β-Sn phase is accompanied by a jump in the atomic volume to 16 A3 (see Figure 3a,b), a change in centrosymmetry parameter, and new peaks in the XRD spectrum. First, we obtained the profile of the particle-velocity (the velocity of Particle A in a medium as it transmits a wave) z-component and atomic volume for the piston velocities of 3 km/s and 1 km/s (Figure 3c,d). Under the impact of a 3 km/s piston, the profiles demonstrate a jump in the atomic volume up to 14.5 A3. The volume reaches this level on the shock-wave front. After passing the shock-wave front, the volume relaxes to 20 A3. Thereby, a running along the z-axis region of the β-Sn phase arises (see Figure 3). The amount of new phase growth during shock-wave propagation is due to the broadening of the shock-wave front. Under 1 km/s piston speed, the amplitude of the shock wave is not enough to achieve β-Sn phase (there is no jump to 16 A3 atomic volume).
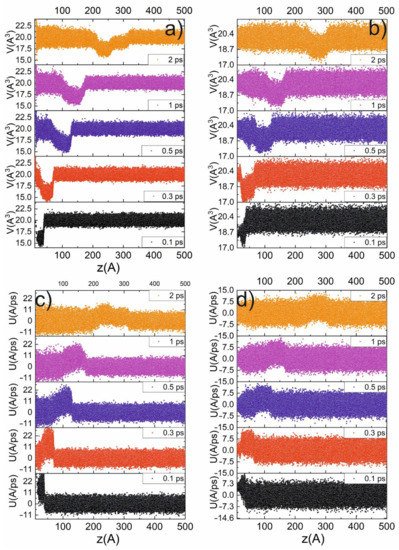
Figure 3. Profiles (along z-axis) of atomic volume (a,b) and particle velocity (c,d) at different time delays for 3 km/s (a,c) and 1 km/s (b,d) piston velocities.
During propagation, the amplitude of the shock wave drops and the width of the shock-wave front is increased. The peak shock-wave velocity is about 15 km/s, which is similar to the results obtained for (111) Si [35]. The shock-wave velocity rapidly (about 2–3 ps) decays and the shock wave loses about 75% of its energy, and the corresponding particle velocity decays similarly (see Figure 4). The phase transition mainly occurs during this time interval (when the shock wave loses 75% energy). The dependence between shock and particle velocity is presented in Figure 4 (see inset) and represents its shock adiabat [35].
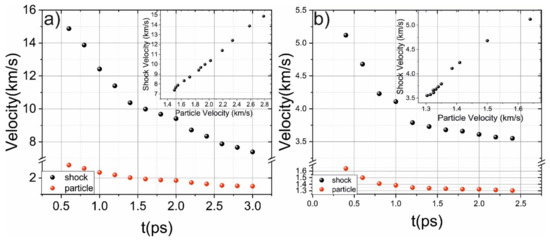
Figure 4. (a) Evolution of shock (black dots) and particle velocity for 3 km/s piston velocity (a) and 1 km/s piston velocity (b). The insets demonstrate dependence between shock and particle velocity.
Under pressures achieved under such an impact, a compression of Si becomes inelastic and exhibits the “anomalous” elastic waves [36]. The additional increase in piston velocity leads to the destruction of the first several layers of the sample. The appearance of these waves could be a result of ultrafast phase transitions to the β-Sn phase, which exists only on the shock-wave front. After passing about 30μm, the amplitude on the shock-wave front is not enough to induce a transition to the β-Sn phase; therefore, the phase transition occurs only in the vicinity of the sample boundary. Under the impact of a 1 km/s shock wave, the shock-wave pressure is not enough to induce the transition of the detectable volume of Si (~10–20 atoms are in β-Sn phase). Such a small amount of material in a new phase demonstrates the extremely small probability of transition to the β-Sn phase (under 1 km/s particle velocity) and to our knowledge, there are no experimental techniques able to detect this new phase. Therefore, it could be said that the phase transition to the β-Sn phase could not occur under such conditions.
Moreover, the histograms of the atomic-volume distributions, the distribution of the centrosymmetry parameter, and the XRD spectrum of the volume affected by the shock wave (30 × 30 × 50-unit cells i.e., a layer containing 50 atom layers) were retrieved. The evolution of these distributions is presented in Figure 5. It demonstrates that the shock wave perturbates the initially Gaussian distribution of the atomic volume. The propagation of the shock wave (see Figure 5) is accompanied by the appearance of a second peak in the vicinity of 16 A3. The peak at 20 A3 rapidly transforms to 16 A3. It indicates the phase transition to the β-Sn phase, and the first peak shows that the cubic-diamond structure of Si vanishes. A beginning of the transformation to the beta-Sn phase after 200 fs is observed. The change in the centrosymmetry parameter (CSP), atomic volume, and XRD spectrum associated with the transition to the β-Sn phase is obtained during propagation of the shock wave (see Figure 5).
This entry is adapted from the peer-reviewed paper 10.3390/ijms23042115
This entry is offline, you can click here to edit this entry!