 +1 credit
Video Upload Options
Sarcopenia, characterized by an aging-related progressive decline of skeletal muscle mass, strength, and physical performance, is frequently encountered in patients undergoing peritoneal dialysis (PD) and is associated with adverse clinical outcomes. However, the best screening tools facilitating the rapid detection of sarcopenia among patients undergoing PD remain unknown.
1. Introduction
2. Sarcopenia Screening among Patients Undergoing Peritoneal Dialysis
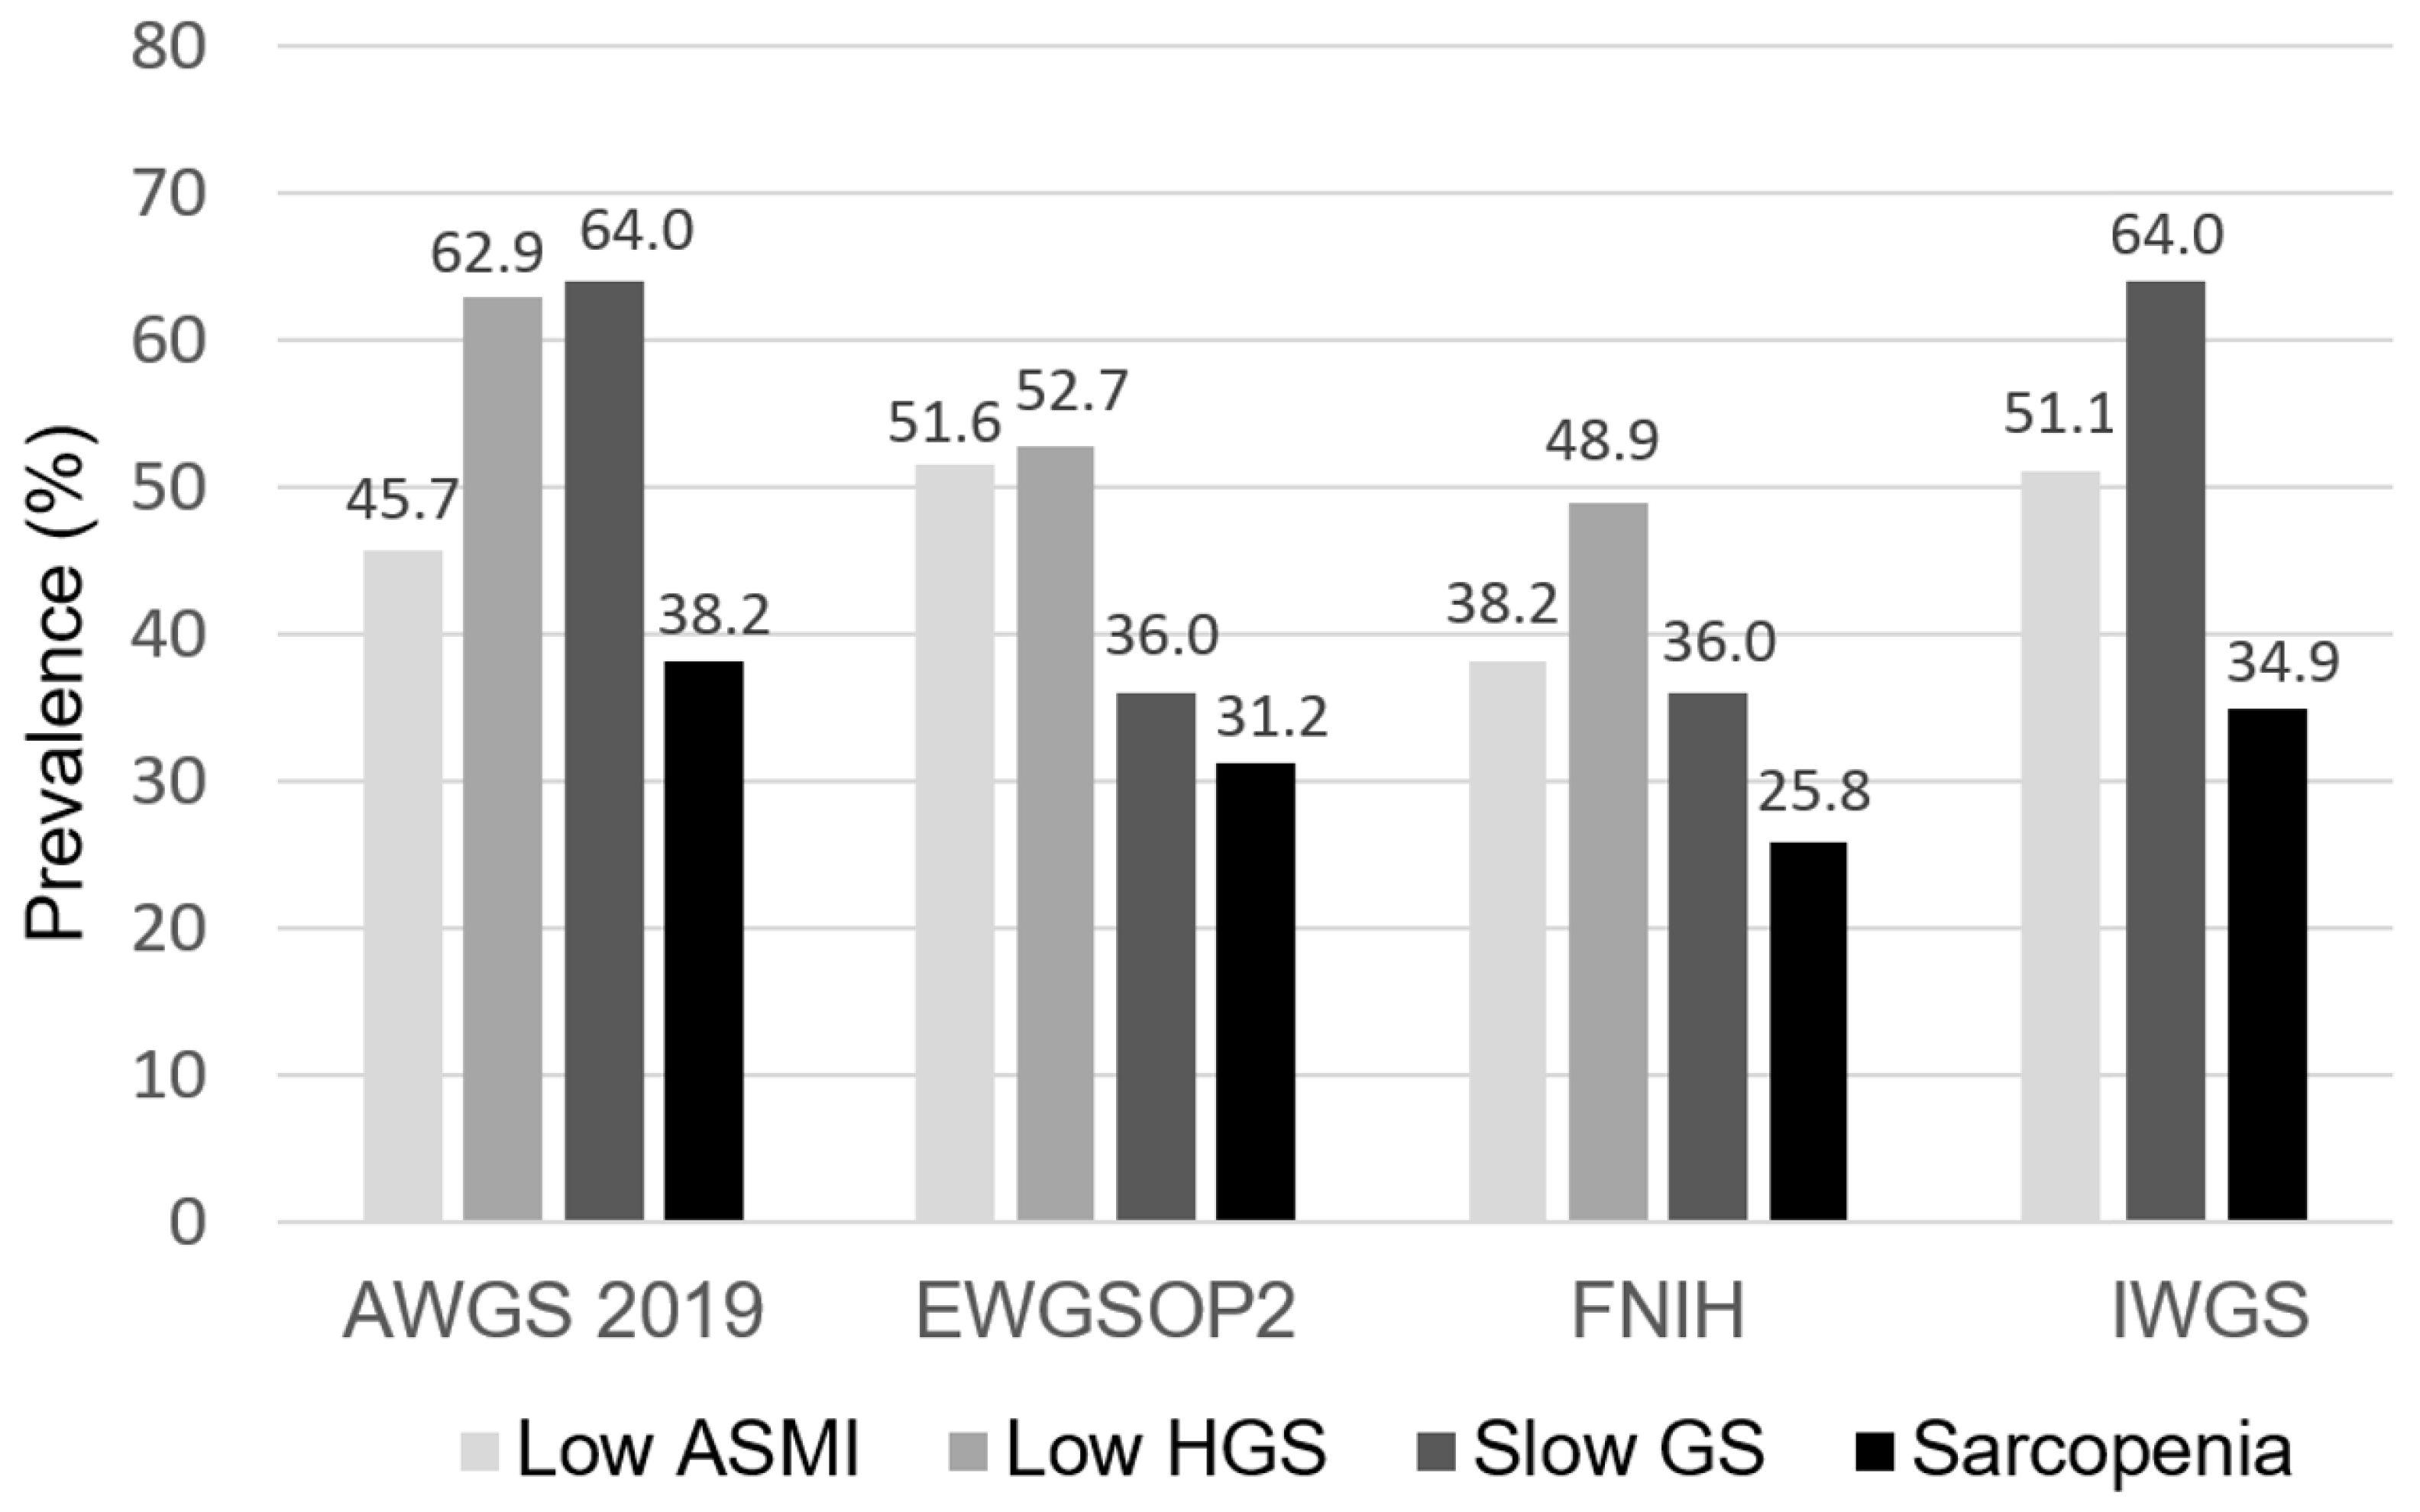 Figure 1. The prevalence of low ASMI, low HGS, slow GS, and sarcopenia across four sarcopenia criteria among patients undergoing PD. ASMI, appendicular skeletal muscle index; HGS, handgrip strength; GS, gait speed; AWGS, Asian Working Group for Sarcopenia; EWGSOP, European Working Group on Sarcopenia in Older People; FNIH, Foundation for the National Institutes of Health; IWGS, International Working Group on Sarcopenia.
Table 1. The correlations of SARC-F, SARC-CalF, and CC with anthropometric and skeletal muscle measurements.
|
Variables |
SARC-F |
|
SARC-CalF |
|
CC |
|||
|
r |
p |
|
r |
p |
|
r |
p |
|
|
Anthropometric measures |
|
|
|
|
|
|
|
|
|
Weight (kg) |
−0.029 |
0.692 |
|
−0.435 |
<0.001* |
|
0.721 |
<0.001* |
|
BMI (kg/m2) |
−0.009 |
0.900 |
|
−0.382 |
<0.001* |
|
0.625 |
<0.001* |
|
WC (cm) |
0.120 |
0.104 |
|
−0.224 |
0.002* |
|
0.436 |
<0.001* |
|
MAMC (cm) |
−0.056 |
0.451 |
|
−0.395 |
<0.001* |
|
0.617 |
<0.001* |
|
FTI (kg/m2) |
0.136 |
0.067 |
|
−0.146 |
0.050* |
|
0.298 |
<0.001* |
|
Skeletal muscle measures |
|
|
|
|
|
|
|
|
|
ASMI (kg/m2) |
−0.125 |
0.090 |
|
−0.421 |
<0.001* |
|
0.683 |
<0.001* |
|
HGS (kg) |
−0.363 |
<0.001* |
|
−0.445 |
<0.001* |
|
0.522 |
<0.001* |
|
GS (m/s)a |
−0.452 |
<0.001* |
|
−0.293 |
<0.001* |
|
0.181 |
0.019* |
Table 2. The diagnostic performance of SARC-F, SARC-CalF, and CC on sarcopenia based on four operational definitions in the overall study population.
|
Definitions |
AUC (95% CI) |
p |
|
AWGS 2019 |
|
|
|
CC |
0.813 (0.749–0.866)a,b |
<0.001* |
|
SARC-CalF |
0.739 (0.670–0.801)a,c |
<0.001* |
|
SARC-F |
0.587 (0.513–0.659)b,c |
0.033* |
|
EWGSOP2 |
|
|
|
CC |
0.776 (0.709–0.834)b |
<0.001* |
|
SARC-CalF |
0.748 (0.679–0.809)c |
<0.001* |
|
SARC-F |
0.625 (0.551–0.695)b,c |
0.003* |
|
FNIH |
|
|
|
CC |
0.652 (0.579–0.721) |
<0.001* |
|
SARC-CalF |
0.648 (0.575–0.717) |
0.002* |
|
SARC-F |
0.587 (0.513–0.659) |
0.063 |
|
IWGS |
|
|
|
CC |
0.750 (0.682–0.811)b |
<0.001* |
|
SARC-CalF |
0.710 (0.639–0.774)c |
<0.001* |
|
SARC-F |
0.621 (0.547–0.691)b,c |
0.004* |
AUC, area under curve; CI, confidence interval; AWGS, Asian Working Group for Sarcopenia; CC, calf circumference; EWGSOP, European Working Group on Sarcopenia in Older People; FNIH, Foundation for the National Institutes of Health; IWGS, International Working Group on Sarcopenia. a p < 0.05 indicates significant difference of AUCs between CC and SARC-CalF. b p < 0.05 indicates significant difference of AUCs between CC and SARC-F. c p < 0.05 indicates significant difference of AUCs between SARC-CalF and SARC-F. *The AUC was significantly different from 0.5.
3. Implications for Clinical Practice
Among the widely used screening tools for sarcopenia, CC and SARC-CalF outperformed SARC-F in the diagnostic accuracy of sarcopenia among patients undergoing PD, and both could serve as optimal screening tools for sarcopenia in clinical settings.
References
- Rosenberg, I.H. Sarcopenia: Origins and clinical relevance. J Nutr 1997, 127, 990S-991S.
- Cruz-Jentoft, A.J.; Baeyens, J.P.; Bauer, J.M.; Boirie, Y.; Cederholm, T.; Landi, F.; Martin, F.C.; Michel, J.P.; Rolland, Y.; Schneider, S.M., et al. Sarcopenia: European consensus on definition and diagnosis: Report of the European Working Group on Sarcopenia in Older People. Age Ageing 2010, 39, 412-423.
- Chen, L.-K.; Liu, L.-K.; Woo, J.; Assantachai, P.; Auyeung, T.-W.; Bahyah, K.S.; Chou, M.-Y.; Chen, L.-Y.; Hsu, P.-S.; Krairit, O. Sarcopenia in Asia: Consensus report of the Asian Working Group for Sarcopenia. J Am Med Dir Assoc 2014, 15, 95-101.
- Fahal, I.H. Uraemic sarcopenia: Aetiology and implications. Nephrol Dial Transplant 2014, 29, 1655-1665.
- Blumenkrantz, M.J.; Gahl, G.M.; Kopple, J.D.; Kamdar, A.V.; Jones, M.R.; Kessel, M.; Coburn, J.W. Protein losses during peritoneal dialysis. Kidney Int 1981, 19, 593-602.
- Malmstrom, T.K.; Morley, J.E. Sarc-f: A simple questionnaire to rapidly diagnose sarcopenia. J Am Med Dir Assoc 2013, 14, 531-532.
- Cruz-Jentoft, A.J.; Bahat, G.; Bauer, J.; Boirie, Y.; Bruyere, O.; Cederholm, T.; Cooper, C.; Landi, F.; Rolland, Y.; Sayer, A.A., et al. Sarcopenia: Revised European consensus on definition and diagnosis. Age Ageing 2019, 48, 16-31.
- Chen, L.K.; Woo, J.; Assantachai, P.; Auyeung, T.W.; Chou, M.Y.; Iijima, K.; Jang, H.C.; Kang, L.; Kim, M.; Kim, S., et al. Asian working group for sarcopenia: 2019 consensus update on sarcopenia diagnosis and treatment. J Am Med Dir Assoc 2020, 21, 300-307 e302.
- Kawakami, R.; Murakami, H.; Sanada, K.; Tanaka, N.; Sawada, S.S.; Tabata, I.; Higuchi, M.; Miyachi, M. Calf circumference as a surrogate marker of muscle mass for diagnosing sarcopenia in Japanese men and women. Geriatr Gerontol Int 2015, 15, 969-976.
- Kim, S.; Kim, M.; Lee, Y.; Kim, B.; Yoon, T.Y.; Won, C.W. Calf circumference as a simple screening marker for diagnosing sarcopenia in older korean adults: The Korean frailty and aging cohort study (KFACS). J Korean Med Sci 2018, 33.
- Chen, C.Y.; Tseng, W.C.; Yang, Y.H.; Chen, C.L.; Lin, L.L.; Chen, F.P.; Wong, A.M.K. Calf circumference as an optimal choice of four screening tools for sarcopenia among ethnic Chinese older adults in assisted living. Clin Interv Aging 2020, 15, 2415-2422.
- Barbosa-Silva, T.G.; Menezes, A.M.; Bielemann, R.M.; Malmstrom, T.K.; Gonzalez, M.C. Enhancing SARC-F: Improving sarcopenia screening in the clinical practice. J Am Med Dir Assoc 2016, 17, 1136-1141.
- Fu, X.; Tian, Z.; Thapa, S.; Sun, H.; Wen, S.; Xiong, H.; Yu, S. Comparing SARC-F with SARC-CalF for screening sarcopenia in advanced cancer patients. Clin Nutr 2020, 39, 3337-3345.
- Bahat, G.; Oren, M.M.; Yilmaz, O.; Kılıç, C.; Aydin, K.; Karan, M.A. Comparing SARC-F with SARC-CalF to screen sarcopenia in community living older adults. J Nutr Health Aging 2018, 22, 1034-1038.
- Yang, M.; Hu, X.; Xie, L.; Zhang, L.; Zhou, J.; Lin, J.; Wang, Y.; Li, Y.; Han, Z.; Zhang, D., et al. Screening sarcopenia in community-dwelling older adults: SARC-F vs SARC-F combined with calf circumference (SARC-CalF). J Am Med Dir Assoc 2018, 19, 277.e271-277.e278.
- Do, J.Y.; Seo, J.H.; Kang, S.H. Validation of the SARC-F for assessing sarcopenia in patients on peritoneal dialysis. J Ren Nutr 2021, 21, S1051-2276.
- Studenski, S.A.; Peters, K.W.; Alley, D.E.; Cawthon, P.M.; McLean, R.R.; Harris, T.B.; Ferrucci, L.; Guralnik, J.M.; Fragala, M.S.; Kenny, A.M., et al. The FNIH sarcopenia project: Rationale, study description, conference recommendations, and final es-timates. J Gerontol A Biol Sci Med Sci 2014, 69, 547-558.
- Fielding, R.A.; Vellas, B.; Evans, W.J.; Bhasin, S.; Morley, J.E.; Newman, A.B.; Abellan van Kan, G.; Andrieu, S.; Bauer, J.; Breuille, D., et al. Sarcopenia: An undiagnosed condition in older adults. Current consensus definition: Prevalence, etiology, and consequences. International working group on sarcopenia. J Am Med Dir Assoc 2011, 12, 249-256.
- Yamamoto, S.; Matsuzawa, R.; Harada, M.; Watanabe, T.; Shimoda, T.; Suzuki, Y.; Kamiya, K.; Osada, S.; Yoshida, A.; Matsunaga, A. SARC-F questionnaire: Rapid and easy tool for identifying physical limitations in hemodialysis patients. JCSM Clinical Reports 2019, 4, 1-12.
- Lin, Y.L.; Hou, J.S.; Lai, Y.H.; Wang, C.H.; Kuo, C.H.; Liou, H.H.; Hsu, B.G. Association of SARC-F questionnaire and mor-tality in prevalent hemodialysis patients. Diagnostics (Basel, Switzerland) 2020, 10, 890.
- Kera, T.; Kawai, H.; Hirano, H.; Kojima, M.; Watanabe, Y.; Motokawa, K.; Fujiwara, Y.; Osuka, Y.; Kojima, N.; Kim, H., et al. Limitations of SARC-F in the diagnosis of sarcopenia in community-dwelling older adults. Arch Gerontol Geriatr 2020, 87, 103959.
- Marini, A.; Perez, D.; Fleuri, J.; Pimentel, G. SARC-F is better correlated with muscle function indicators than muscle mass in older hemodialysis patients. J Nutr Health Aging 2020, 24, 999-1002.
- Gonzalez, M.C.; Mehrnezhad, A.; Razaviarab, N.; Barbosa-Silva, T.G.; Heymsfield, S.B. Calf circumference: Cutoff values from the NHANES 1999–2006. Am J Clin Nutr 2021, 113, 1679-1687.
- Mo, Y.H.; Zhong, J.; Dong, X.; Su, Y.D.; Deng, W.Y.; Yao, X.M.; Liu, B.B.; Wang, X.Q.; Wang, X.H. Comparison of three screening methods for sarcopenia in community-dwelling older persons. J Am Med Dir Assoc 2021, 22, 746-750 e741.
- Nishikawa, H.; Yoh, K.; Enomoto, H.; Iwata, Y.; Sakai, Y.; Kishino, K.; Shimono, Y.; Ikeda, N.; Takashima, T.; Aizawa, N., et al. Calf circumference as a useful predictor of sarcopenia in patients with liver diseases. In Vivo 2020, 34, 2561-2569.
- Inoue, T.; Maeda, K.; Shimizu, A.; Nagano, A.; Ueshima, J.; Sato, K.; Murotani, K. Calf circumference value for sarcopenia screening among older adults with stroke. Arch Gerontol Geriatr 2021, 93, 104290.

