Your browser does not fully support modern features. Please upgrade for a smoother experience.
Submitted Successfully!
 +1 credit
Thank you for your contribution! You can also upload a video entry or images related to this topic.
For video creation, please contact our Academic Video Service.
| Version | Summary | Created by | Modification | Content Size | Created at | Operation |
|---|---|---|---|---|---|---|
| 1 | Chien-Teh Chen | + 2688 word(s) | 2688 | 2022-01-25 07:35:37 | | | |
| 2 | Bruce Ren | + 19 word(s) | 2707 | 2022-02-21 02:36:18 | | |
Video Upload Options
We provide professional Academic Video Service to translate complex research into visually appealing presentations. Would you like to try it?
Cite
If you have any further questions, please contact Encyclopedia Editorial Office.
Chen, C. Growth Enhancement of Camellia sinensis with Biochar. Encyclopedia. Available online: https://encyclopedia.pub/entry/19634 (accessed on 17 June 2026).
Chen C. Growth Enhancement of Camellia sinensis with Biochar. Encyclopedia. Available at: https://encyclopedia.pub/entry/19634. Accessed June 17, 2026.
Chen, Chien-Teh. "Growth Enhancement of Camellia sinensis with Biochar" Encyclopedia, https://encyclopedia.pub/entry/19634 (accessed June 17, 2026).
Chen, C. (2022, February 18). Growth Enhancement of Camellia sinensis with Biochar. In Encyclopedia. https://encyclopedia.pub/entry/19634
Chen, Chien-Teh. "Growth Enhancement of Camellia sinensis with Biochar." Encyclopedia. Web. 18 February, 2022.
Copy Citation
Biochar is a pyrolysis product of biomass and is recommended for soil amendment for improving soil health and increasing crop yield. Biochar application in the agriculture sector is a practical approach to minimize waste and maintain sustainable farming. However, the information regarding biochar application in tea cultivation is limited and especially rare in field research
biochar
field study
soil amendment
sustainable farming
tea production
1. Introduction
The biomass types and pyrolysis conditions were determined by biochar’s structure, nutrient content, pH, and other properties [1][2][3]. The application of biochar in soil remarkably influenced soil properties, such as enhanced soil water retention, soil aggregation, and nutrient turnover [4][5][6][7][8]. In addition, it was proposed as an efficient process to increase soil organic matters (OM) [9][5][10][11]. Moreover, many reports notified that biochar application affected numerous elements’ cycling in the soil, including carbon (C), phosphorus (P), and nitrogen (N) [12][13][14]. The soil N and P were preserved due to the addition of biochar [15][16]. Biochar application enhanced the mineralization of preserved soil P and provided a certain proportion for plant uptake [17].
Tea is a worldwide beverage with a yearly yield of 6.5 MT [18], mainly planted in Asia and Africa. The requirements for tea planting were temperatures ranging from 10 to 30 °C, precipitation higher than 1250 mm annually, acidic soils preferably, and 0.5–10° slopes. Tea production is susceptible to growing seasons and is threatened by extreme climate change. Biochar from the waste of tea drinking has been produced and studied in many reports [19][20][21]. However, using tea twigs for making biochar has never been studied. Tea twigs are one of the waste materials during tea processing in tea factories, which is around 10% of raw materials. This study recycled the tea processing waste by converting it to biochar and used its benefits as a soil amendment in a tea yard to approach sustainable tea cultivation. The limiting factors of sustainable tea cultivation are soil acidification [22], poor soil fertility [23], and low nutrient efficiency [24]. Soil acidity is one of the most significant barriers restraining sustainable tea cultivation [25], even though tea is an acid-soil-tolerant plant. Typically, the soil pH suitable for tea growth is 4.5–5.5 [23]. High soil acidity can decrease tea growth and quality if the tea soil pH is below 4.5 [26]. Liming has been suggested to overcome the problem of soil acidity [27][28]. However, some reports are against liming regarding the increase in greenhouse gas emissions [29] and the decrease in soil P availability [30]. As tea is a calciphobous plant [31], tea growth and quality declines were expected under high soil calcium that usually resulted from inappropriate liming [32].
Therefore, a new appropriate agricultural practice is necessary to remediate soil acidification in tea yards. Poor soil fertility is another limiting factor closely linked to soil acidification. A high-yield tea plantation requires a soil OM above 2.0% and higher available N and P content in the soil [23]. Most tea yards are located in tropical and subtropical areas with highly weathered tropical soils categorized by low nutrient availability [26]. Heavy rainfall is also frequent in these areas, which results in massive losses of soil nutrients by a runoff for leaching [33][34]. Fertilizer applications are commonly used to increase yield or improve quality. Most N and P are lost to the environment via N2O emissions [35][36], and soil N and P leaching [37], which eventually increases costs of production and the risks of pollution [26]. Biochar application to the agricultural sector is a promising strategy to improve soil fertility [6][26][38][39][40]. The positive effects of biochar on crop production have been proven in tropical environments, especially in acid soils with poor nutrients [41], which might be attributed to biochar’s high basic cations and alkalinity [42][43]. In addition, the leaching of nutrients decreased with biochar application [44][45][46]; hence, the levels and availability of nutrients increased [47][48][49][50].
2. Materials and Methods
2.1. Field Experimental Site
Tea plants for this experiment were Camellia sinensis var. Shi-Ji-Chun. The tea plants were planted for more than fifteen years. The tea yard is located in central Taiwan with a latitude of 23°51′3.60″ N and a longitude of 120°40′39.00″ E, where the elevation is 400 m above sea level, the average temperature is 22–25 °C, the soil is sandy loam, and the annual precipitation is 1500–2000 mm. The experiment was conducted from June 2019 to October 2021. The study field occupied approximately 4000 m2. According to tea yield, the experimental site was divided into two sectors (Figure 1): weak growth (Weak) and normal growth (CK) of tea. Each sector contained six plots, three for biochar application (B) and three without biochar (N). The abbreviations for the four treatments were W-B (weak growth with biochar), W-N (weak growth without biochar), CK-B (normal growth with biochar), and CK-N (normal growth without biochar). The first-time biochar application added 20 g m−2 biochar (around 0.03% (w w−1 soil)) on the soil surface in November 2019. Then, the amount of biochar was increased to 80 g m−2 (around 0.12% (w w−1 soil)) for the second-time biochar application in June 2020. The biochar application area for each plot was 1 m long and 0.3 m wide on two sides of the tea tree under the tea canopy. The fertilizer (N:P:K:S:OM = 19:5:9:5:61) applied in the tea yard was three times (February, August, and November) in a year with 0.66 kg m−2 in each time. In general, the pesticides were sprayed 20 days before harvest.
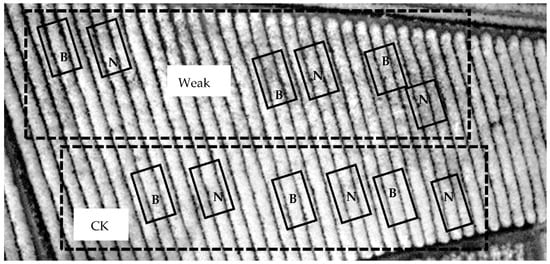
Figure 1. The infrared picture of the tea yard indicates experimental sites for biochar application. The field was divided into weak and normal (CK) sectors according to its tea yield. Six plots were set up in each sector, three with biochar application (B) and three without biochar (N).
2.2. Biochar Production and Characteristics
Biochar is made from tea processing waste, mainly the tea twigs from a tea processing factory. The tea twigs were pyrolyzed with a temperature of 450 °C or 600 °C for one hour in the quartz tuber (2.8 L with a diameter of 10 cm and length of 36 cm) equipped with an electrical wire for multiple heating processions and nitrogen gas passing for oxygen depletion. The properties of all biochars used in this study are shown in Table 1. Properties of biochar were determined by an Element Analyzer (EL CHNOS Rapid F002, ElmenterVario, Langenselbold, Germany) and Thermogravimetric Analyzer (Perkin-Elmer STA 6000, Waltham, MA, USA). The characteristic of biochar (Table 1) was measured by the minerals contained in biochar powder (40–60 mesh). The measurements were expressed as the C (wt. %), H (wt. %), N (wt. %), O (wt. %), S (wt. %), water content (wt. %), volatile compound (wt. %), fixed carbon (wt. %), and ash (wt. %). Biochar pH and EC were measured by a meter (Microcomputer pH/Conductivity/Temperature Meter 6307, JENCO, Instruments Inc., San Diego, CA, USA) with a ratio of 1:30 and 1:20 to water, respectively. The surface area (m2 g−1) was measured with the specific area/pore size distribution using the volumetric gas adsorption technique (Belsorp mini X, BEL Japan, Inc., Osaka, Japan).
Table 1. Biochar characteristics.
| Pyrolysis Temperature | 450 °C | 600 °C |
|---|---|---|
| pH | 9.1 | 10.3 |
| Surface area (m2 g−1) | 12.1 | 8.9 |
| Water content (wt. %) | 5.6 | 7.0 |
| Volatile compound (wt. %) | 27.7 | 19.8 |
| Fixed carbon (wt. %) | 56.5 | 62.1 |
| Ash (wt. %) | 10.2 | 11.1 |
| C (wt. %) | 71.4 | 73.8 |
| H (wt. %) | 3.2 | 1.8 |
| N (wt. %) | 2.7 | 2.5 |
| S (wt. %) | 0.1 | 0.1 |
| O (wt. %) | 12.4 | 11.1 |
2.3. Soil Properties Analysis
Soil properties (0–15 cm) were analyzed before and after biochar application in November 2019 with three replicates for each treatment, then continued to March 2021 on each tea harvest. After air-drying and sieving with a 2 mm sieve, soils were mixed with water at a ratio of 1:2 for soil pH and EC determination [51], which were analyzed with a Microcomputer of pH/Conductivity/Temperature (Meter 6307, JENCO, Instruments Inc., USA). Soil WHC (water holding capacity) was determined using a method adapted from Nguyen and Lehmann (2009) [52]. The determination of soil OM (soil organic matter) was conducted according to Ball (1964) [53]. Available nitrogen was extracted from 2 g of a soil sample by adding 10 mL of 2 M of KCl. The sample solution was incubated with salicylate and bleach in the microplate wells. After 15 min, a microplate reader (SpectraMax M2, Molecular Devices, San Jose, CA, USA) read the optical density value with 650 nm of wavelength absorbance [54]. Available phosphorus was extracted from 2 g of a soil sample to 20 mL of Mehlich 3 solution (M3 solution consisted of 0.2 N acetic acid, 0.25 N NH4NO3, 0.015 N NH4F, 0.013 N HNO3, and 0.001 M EDTA). The sample solution was incubated with AMP (ammonium para-molybdate) solution (53 mL of H2SO4 and 8.775 g of ammonium para-molybdate in 500 mL of ddH2O) in the microplate wells. After 10 min, a microplate reader (SpectraMax M2) read the optical density value with 630 nm of wavelength absorbance [55].
2.4. Tea Yield Analysis
Tea yield was measured before and after biochar application. Yield data were collected on November 2019, June 2020, August 2020, November 2020, March 2021, and October 2021. The number of tea shoots in a square of 0.16 m2 was counted for one replication. The average of three replications at each plot was converted to the new shoot number per m2 to indicate the tea yield of one plot.
2.5. Statistical Analysis of Data
Yield and soil properties data from each treatment expressed the standard error of the mean with bars. The differences between treatments were tested with Student’s t-test or Fisher’s Least Significant Difference (LSD) test. Regression was then performed to determine the relationship between yield and other variables. Statistical analyses were conducted using SPSS Statistics 22.0.
3. Growth Enhancement of Camellia sinensis with Biochar
3.1. Biochar Characteristics
The characteristics of tea biochar in Table 1 show that the elevation in the pyrolysis temperature from 450 °C to 600 °C increased the biochar pH from 9.1 to 10.3, the water content from 5.6 to 7.0%, the fixed carbon content from 56.5 to 62.1%, the ash content from 10.2 to 11.1%, and the carbon (C) content from 71.4 to 73.8%. On the other hand, the elevated temperature decreased the surface area from 12.1 to 8.9 m2 g−1, the content of the volatile compound from 27.7 to 19.8%, the hydrogen (H) content from 3.2 to 1.8%, the nitrogen (N) content from 2.7 to 2.5%, and the oxygen (O) content from 12.4 to 11.1%. Only the sulfur (S) showed a stable content of 0.1%. However, the effect of both biochars on plant growth was no different in rice seedlings (data not shown). Thus, the biochar application in this study was mixed with both temperatures of biochars with a ratio of around 1:1 as both temperatures were recommended as the optimal temperature for biochar processing.
3.2. The Responses of Tea Yield
The infrared picture of the tea yard in Figure 1 shows that the tea grown on the lower part was better than that on the upper part, as the brighter the color, the more vigorous the tea sprouts. Thus, the biochar experiment was conducted in two sectors, weak and normal (CK) growth (Figure 1). Each sector contained six plots, and three were set up for biochar application (B); the others were without Biochar (N). The differences between the weak and CK sectors are shown in Figure 2. The tea yield, soil EC, extractable N, and water holding capacity were significantly lower in the weak sector, but not the soil organic matter or extractable P. The soil pH showed a higher variance in the weak sector (Figure 2b). Biochar was applied twice in the tea yard, one in November 2019 with 20 g m−2 and the other in June 2020 with 80 g m−2 (Figure 3a). From November 2019 to June 2020, tea yields neither increased nor decreased under biochar application in the weak and CK sectors (Figure 3a), suggesting 20 g m−2 biochar application might not be enough to affect tea growth.
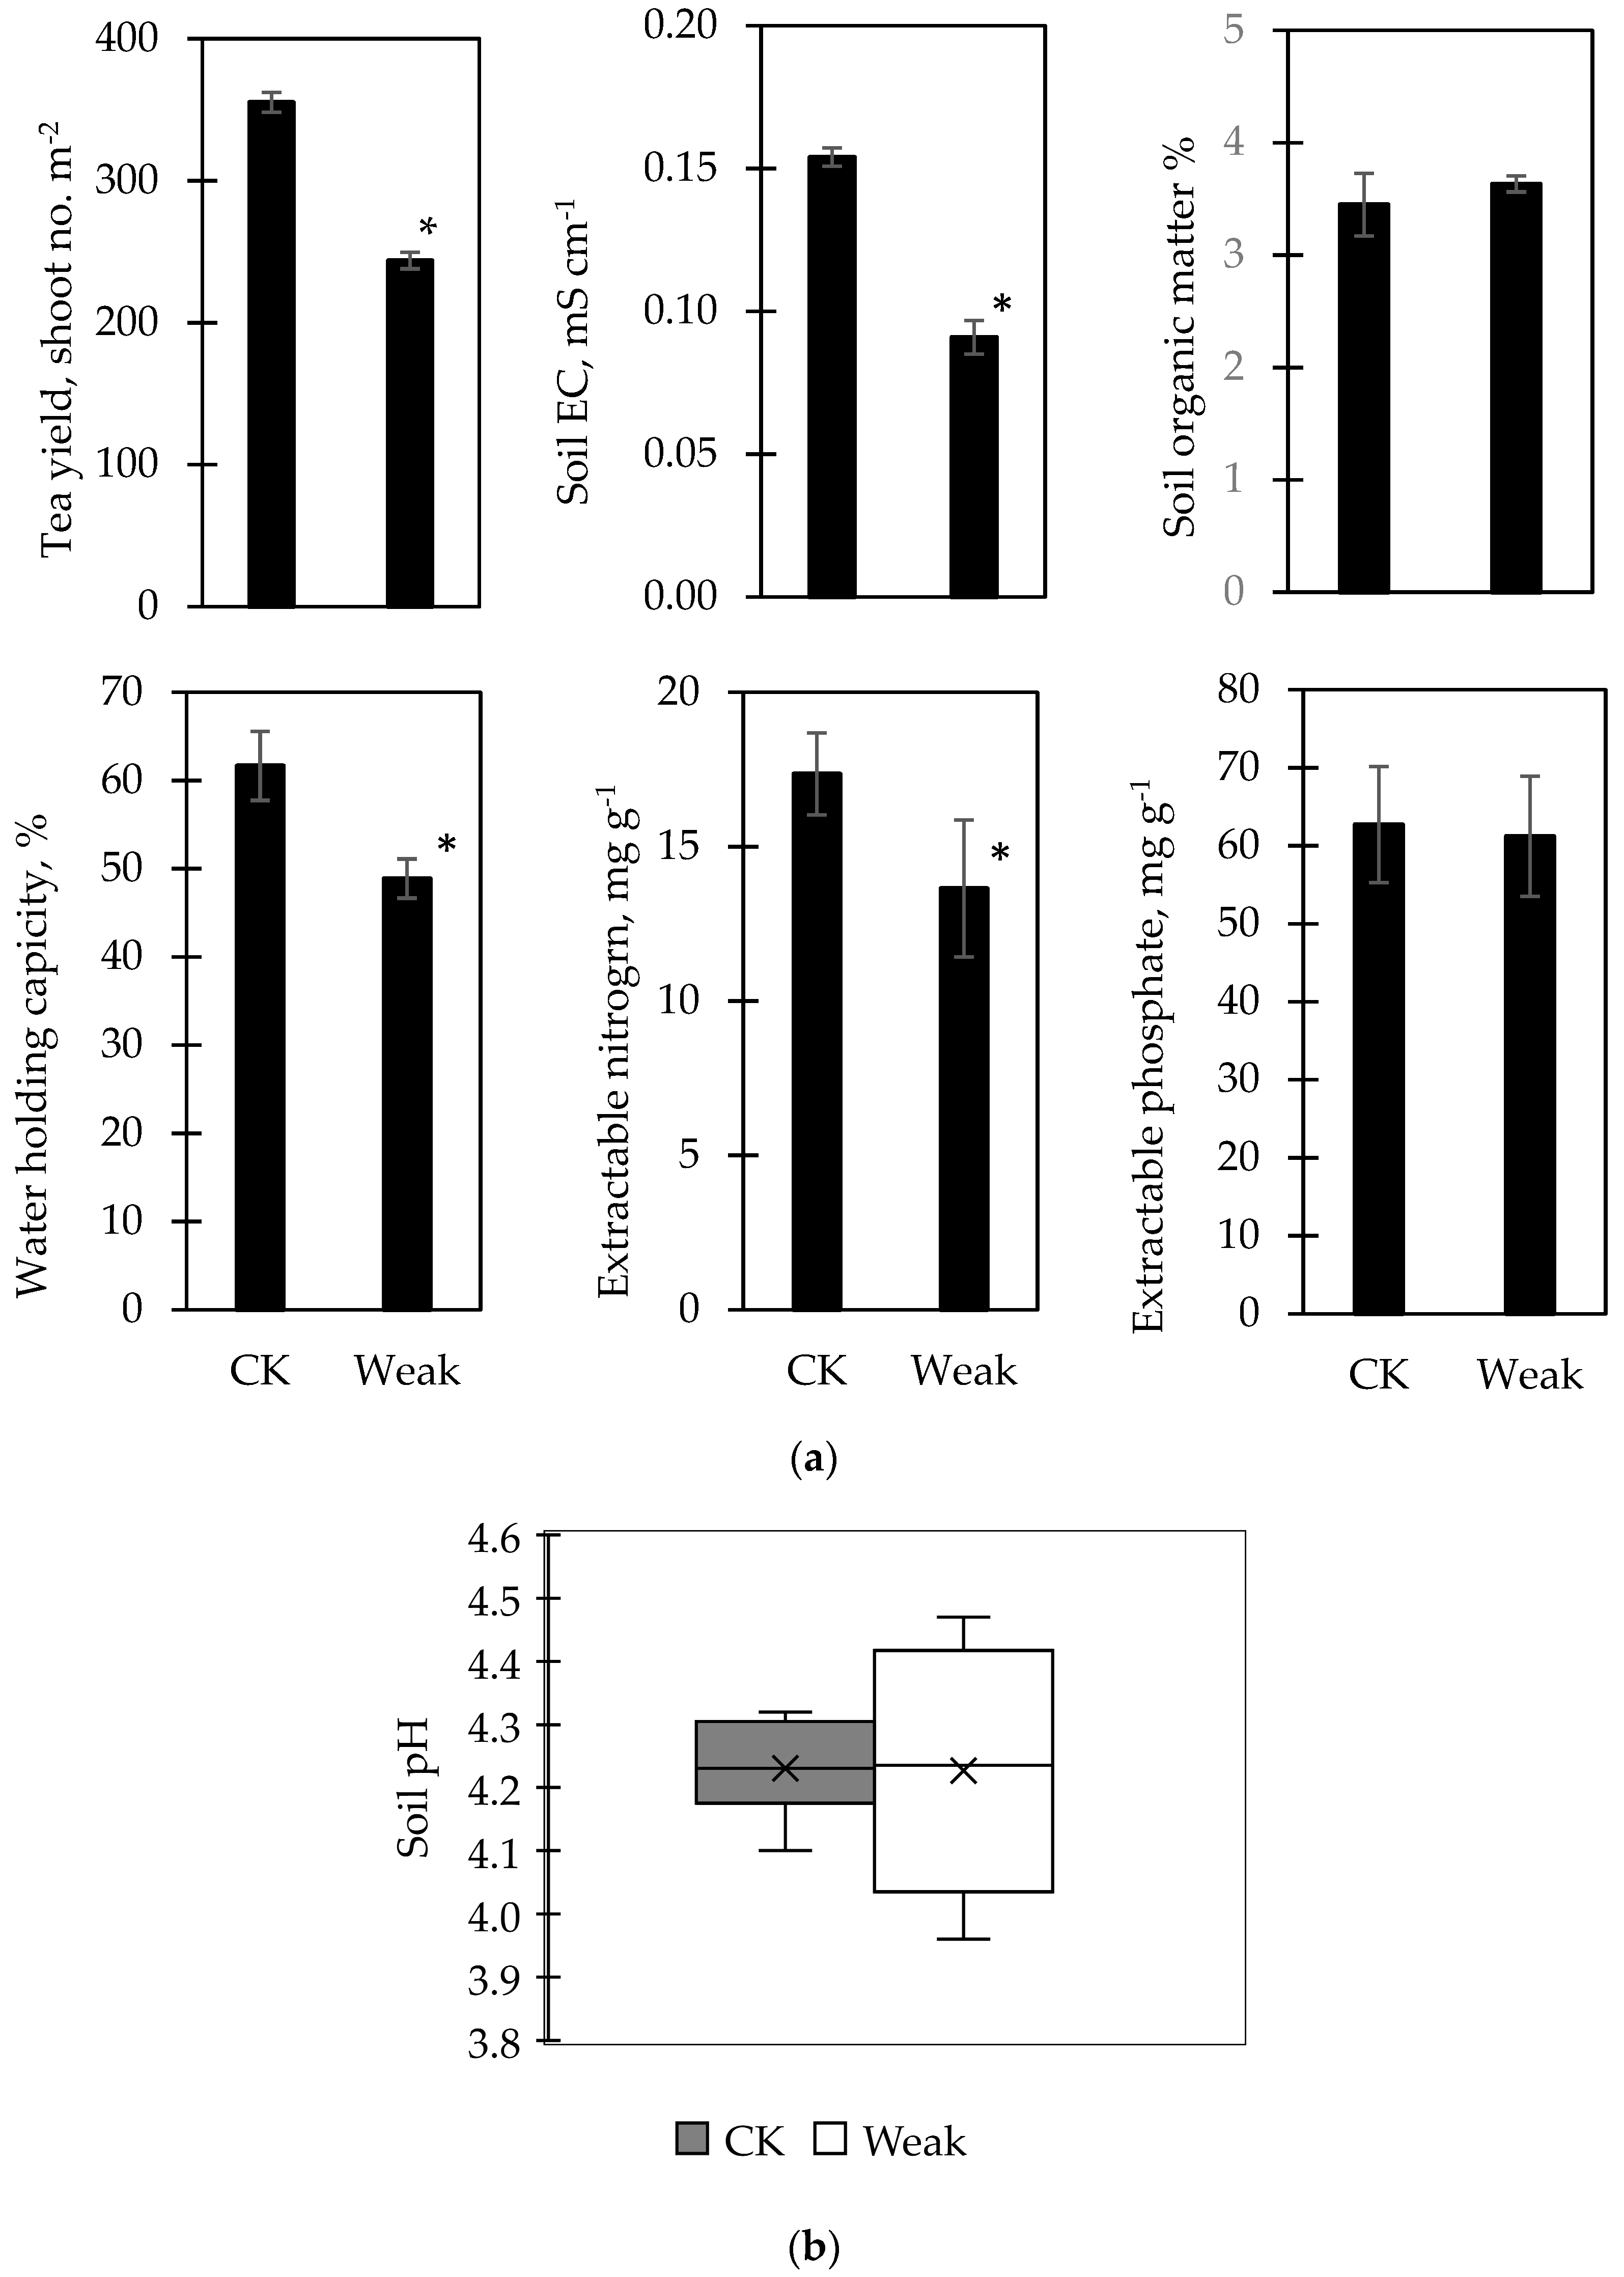
Figure 2. The differences between blocks of weak tea growth and normal (CK) in soil characteristics and tea yield are shown in (a). Bars represent the standard error of the mean (n = 6), where the signs of * indicate a significant difference between blocks of weak and CK with the Student’s t-test. The variation in soil pH in blocks of weak and CK is shown in (b).
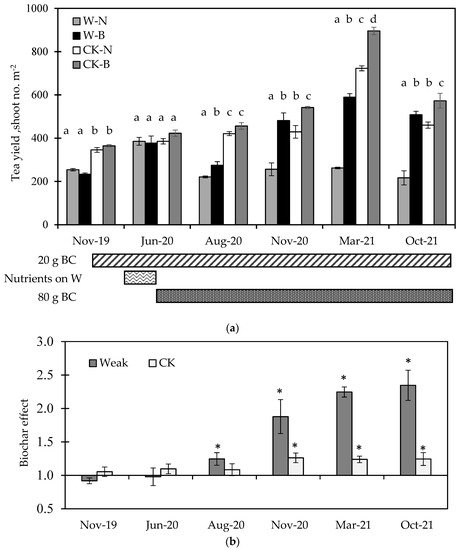
Figure 3. The responses of tea yield to biochar application from 2019 to 2021 are shown in (a). The treatment of W-B means the sector of weak tea growth (W) with biochar applied (B); CK-N means the sector of normal tea growth (CK) without biochar (N). The biochar effect in (b) is the ratio of the tea yield between biochar applied (B) and without biochar (N), which is calculated by B/N. Bars represent the standard error of the mean (n = 3), where different letters indicate a significant difference between sectors of weak and CK by the multiple comparisons of the LSD test. The * symbols indicate a significant difference between the value of the biochar effect and 1.0 with the multiple comparisons of the LSD test.
One month before the harvest of June 2020, a nutrient was sprayed on the weak sector only. The nutrient treatment (with N, P, K, Cu, Zn, Fe, and Mn of 140, 18, 100, 18, 1, 6, and 7 ppm, respectively) increased the weak sector’s tea yield and enabled it to reach the level of the CK sector, indicating that tea trees in the weak sector could have the problem of nutrient deficiency. Thus, biochar was applied again with 80 g m−2 (Figure 3a). After that, biochar application resulted in a significant increase in tea yield in the sectors of weak and CK. The magnitude of the biochar effect in the tea yield of the weak sector was higher than that in the CK sector (Figure 3b). However, the tea yield that increased in the weak sector with biochar treatment did not always reach the CK sector’s level (Figure 3a), such as the results in August 2020 and March 2021. In October 2021, the tea yield decreased in all treatments (Figure 3a) due to an extremely long dry season from March 2021 to August 2021. Nevertheless, the biochar effect was still apparent (Figure 3b); the biochar effect remained at 1.24 in the CK sector but increased from 2.25 to 2.35 in the weak sector.
3.3. Biochar Effects on Soil Characteristic
Soil characteristics (Figure 4) with biochar application on the tea yard showed diverse responses under long-term monitoring. As the soil pH (Figure 2b) showed a higher variance in the weak sector, the plots with lower soil pH were set-up for biochar application. It thus caused the biochar effect below 1.0 on the soil pH (Nov-19 of Figure 4). Meanwhile and unintentionally, the selected plots also showed the biochar effect below 1.0 on the soil EC, extractable P, and N. In the CK sector, the biochar was applied without selection but still showed the biochar effect below 1.0 in soil extractable P and water holding capacity due to soil variation (Nov-19 of Figure 4). The chronicle biochar effects of soil EC (Figure 4) showed that the biochar application initially increased the soil EC of both sectors. The biochar effect in the weak sector increased from 0.78 to 1.13, and that in the CK sector increased from 1.02 to 1.24 and then dropped to 1.10 later (Figure 4). The biochar effect on soil water holding capacity increased gradually in both CK and weak sectors but more promptly in the weak sector. The biochar effect on soil OM increased gradually in both CK and weak sectors, but it needed one year’s biochar application. Soil P and N showed different responses to biochar application, and the difference was evident after one year’s biochar application. The biochar effect on soil P increased gradually in both CK and weak sectors, but the extent increased more in the weak sector, where the biochar effect increased from 0.77 to 1.70 in the weak sector and from 0.72 to around 1.20 in the CK sector. In contrast, the biochar effect on soil N increased gradually in the CK sector. Still, the extent increased more in the CK sector, where the biochar effect increased from 0.73 to 1.20, then dropped to 0.99 later in the weak sector and from 0.84 to 1.67 in the CK sector. The biochar effect on soil pH increased gradually in both CK and weak sectors, but one year’s biochar application was needed to achieve the significant difference.
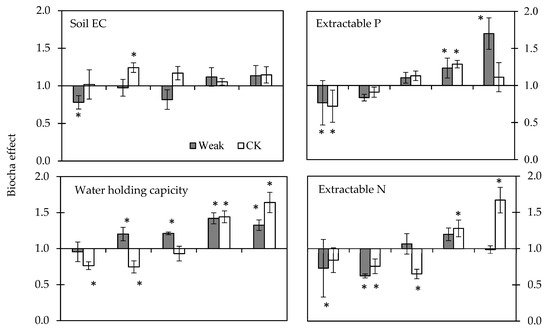
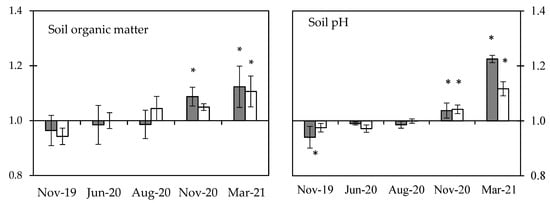
Figure 4. The effects of biochar on the soil characteristics are displayed on the y-axis; the values represent the ratio of biochar applied and without biochar. Bars represent the standard error of the mean (n = 3), where the * symbols indicate a significant difference between the value of the biochar effect and 1.0 with the multiple comparisons of the LSD test.
3.4. Relationship between Tea Yield and Soil Status
The relationship between the tea yield and the soil status that responded to biochar application showed varied correlations (Figure 5). The analysis of regression revealed that the soil EC (R2 = 0.6957; p < 0.05), the soil P (R2 = 0.6547, p < 0.05), and the soil OM (R2 = 0.7024; p < 0.05) were positively correlated with the tea yield, while the soil pH (R2 = 0.0869; p < 0.05), soil WHC (R2 = 0.0152; p < 0.05), and the soil N (R2 = 0.0265; p < 0.05) showed a very weak correlation with the tea yield.
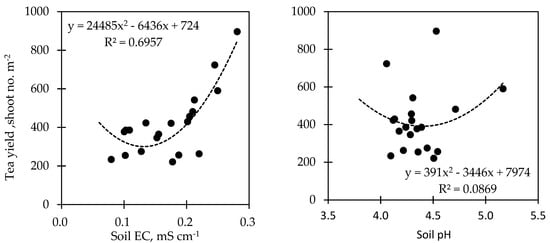
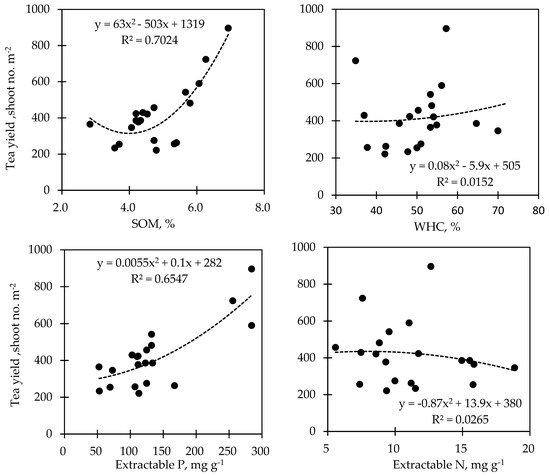
Figure 5. The regression analysis on the relationship between tea yield and soil status.
References
- Bruun, E.W.; Hauggaardd-Nielsen, H.; Ibradhim, N.; Egsgaard, H.; Ambus, P.; Jensen, A.P.; Dam-Johansen, K. Influence of fast pyrolysis temperature on biochar labile fraction and short-term carbon loss in a loamy soil. Biomass Bioenergy 2011, 35, 1182–1189.
- De la Rosa, J.M.; Paneque, M.; Miller, A.Z.; Knicker, H. Relating physical and chemical properties of four different biochars and their application rate of biomass production of Lolium perenne on a Calcic Cambisol during a pot experiment of 79 days. Sci. Total Environ. 2014, 499, 175–189.
- Novak, J.M.; Busscher, W.J.; Laird, D.L.; Ahmedna, M.; Watts, D.W.; Niandou, M.A.S. Impact of biochar amendment on fertility of a South-eastern coastal plain soil. Soil Sci. 2009, 174, 105–112.
- Woolf, D.; Amonette, J.E.; Street-Perrott, F.A.; Lehmann, J.; Joseph, S. Sustainable biochar to mitigate global climate change. Nat. Commun. 2010, 1, 56.
- Du, Z.L.; Zhao, J.K.; Wang, Y.D.; Zhang, Q.Z. Biochar addition drives soil aggregation and carbon sequestration in aggregate fractions from an intensive agricultural system. J. Soils Sediments 2017, 17, 581–589.
- Zhang, Y.L.; Chen, H.; Bai, S.H.; Menke, C.; Zhang, M.Y.; Xu, Z.H. Interactive effects of biochar addition and elevated carbon dioxide concentration on soil carbon and nitrogen pools in mine spoil. J. Soils Sediments 2017, 17, 2400–2409.
- Zhang, J.; Sun, C.; Liu, G.; Xue, S. Effects of long-term fertilization on aggregates and dynamics of soil organic carbon in a semi-arid agro-ecosystem in China. PeerJ 2018, 6, e4758.
- Pokharel, P.; Kwak, J.-H.; Ok, Y.S.; Chang, S.X. Pine sawdust biochar reduces GHG emission by decreasing microbial and enzyme activities in forest and grassland soils in a laboratory experiment. Sci. Total Environ. 2018, 625, 1247–1256.
- Kimetu, J.M.; Lehmann, J. Stability and stabilization of biochar and green manure in soil with different organic carbon contents. Aust. J. Soil Res. 2010, 48, 577–585.
- Gunina, A.; Kuzyakov, Y. Pathways of litter C by formation of aggregates and SOM density fractions: Implications from 13C natural abundance. Soil Biol. Biochem. 2014, 71, 95–104.
- El-Naggar, A.; Awad, Y.M.; Tang, X.Y.; Liu, C.; Niazi, N.K.; Jien, S.H.; Tsang, D.C.W.; Song, H.C.; Ok, Y.S.; Lee, S.S. Biochar influences soil carbon pools and facilitates interactions with soil: A field investigation. Land Dev. Degrad. 2018, 29, 2162–2171.
- Prendergast-Miller, M.T.; Michael, D.; Saran, P.S. Localisation of nitrate in the rhizosphere of biochar-amended soils. Soil Biol. Biochem. 2011, 43, 2243–2246.
- Zhang, H.; Chen, C.; Gray, E.M.; Boyd, S.E. Roles of biochar in improving phosphorus availability in soils: A phosphate adsorbent and a source of available phosphorus. Geoderma 2016, 276, 1–6.
- Tan, Z.; Ye, Z.; Zhang, L.; Huang, Q. Application of the 15N tracer method to study the effect of pyrolysis temperature and atmosphere on the distribution of biochar nitrogen in the biomass–biochar-plant system. Sci. Total Environ. 2018, 622, 79–87.
- Xie, Z.; Xu, Y.; Liu, G.; Zhu, Z.; Tu, C.; Amonette, J.E.; Cadisch, G.; Yong, J.W.H.; Hu, S. Impact of biochar application on nitrogen nutrition of rice, greenhouse-gas emissions and soil organic carbon dynamics in two paddy soils of China. Plant Soil 2013, 370, 527–540.
- Zhu, S.; Huang, X.; Ma, F.; Wang, L.; Duan, X.; Wang, S. Catalytic removal of aqueous contaminants on N-doped graphitic biochars: Inherent roles of adsorption and nonradical mechanisms. Environ. Sci. Technol. 2018, 52, 8649–8658.
- Dari, B.; Nair, V.D.; Harris, W.G.; Nair, P.K.R.; Sollenberger, R.; Mylavarapu, R. Relative influence of soil- vs. biochar properties on soil phosphorus retention. Geoderma 2016, 280, 82–87.
- FAOSTAT. Food and Agriculture Organization of the United Nations. Production: Crops. 2019. Available online: http://faostat.fao.org (accessed on 25 December 2021).
- Pal, D.; Maiti, S.K. Abatement of cadmium (Cd) contamination in sediment using tea waste biochar through meso-microcosm study. J. Clean. Prod. 2019, 212, 986–996.
- Vithange, M.; Mayakaduwa, S.S.; Herath, I.; Ok, Y.S.; Mohan, D. Kinetics, thermodynamics and mechanistic studies of carbofuran removal using biochars from tea waste and rice husks. Chemosphere 2016, 150, 781–789.
- Rajapaksha, A.U.; Vithanage, M.; Zhang, M.; Ahmad, M.D.; Chang, S.X.; Ok, Y.S. Pyrolysis condition affected sulfamethazine sorption by tea waste biochars. J. Bioresour. Technol. 2014, 166, 303–308.
- Yan, P.; Wu, L.; Wang, D.; Fu, J.; Shen, C.; Li, X.; Zhang, L.; Zhang, L.P.; Fan, L.C.; Han, W.Y. Soil acidification in Chinese tea plantations. Sci. Total Environ. 2020, 715, 136963.
- Han, W.; Ruan, J.; Lin, Z. The major nutrient limiting factors in tea soils and development of series tea specialty fertilizers. J. Tea Sci. Res. 2002, 22, 70–74.
- Ni, K.; Liao, W.; Yin, X.; Niu, S.; Ma, L.; Shi, Y.; Zhang, Q.; Liu, M.; Ruan, J. Fertilization status and reduction potential in tea gardens of China. J. Plant Nutr. Fertil. 2019, 25, 421–432.
- Su, H.G. The improvement measures of soil acidification in tea garden in Anxi. Guangdong Tea Ind. 2012, 1, 31–32.
- Yan, P.; Chen, S.; Zhenhao, Z.; Jianyu, F.; Xin, L.; Liping, Z.; Lan, Z.; Wenyan, H.; Lichao, F. Biochar stimulates tea growth by improving nutrients in acidic soil. Sci. Hortic. 2021, 283, 110078.
- Fageria, N.K.; Nascente, A.S. Chapter six–management of soil acidity of South American soils for sustainable crop production. Adv. Agron. 2014, 128, 221–275.
- Holland, J.E.; Bennett, A.E.; Newton, A.C.; White, P.J.; Mckenzie, B.M. Liming impacts on soils, crops and biodiversity in the UK: A review. Sci. Total Environ. 2017, 610, 316–332.
- Kunhikrishnan, A.; Thangarajan, R.; Bolan, N.; Xu, Y.; Mandal, S.; Gleeson, D.; Seshadri, B.; Zaman, M.; Barton, L.; Tang, C. Functional relationships of soil acidification, liming, and greenhouse gas flux. Adv. Agron. 2016, 139, 1–71.
- Barrow, N.J. The effects of pH on phosphate uptake from the soil. Plant Soil 2017, 410, 401–410.
- Yao, Y.T.; Song, L.B.; Tian, L.L. Advances in research on calcium nutrition of tea. Deciduous Fruits 2011, 2, 37–39.
- Shen, J.Z.; Hu, J.H. Variation of biochemical components in different tea varieties under excessive calcium treatment. Shandong Agric. Sci. 2014, 46, 74–76.
- Watanabe, I.; Tokuda, S.; Nonaka, K. Nutrients leaching losses from lysimeter grown tea plants fertilized at two rates of nitrogen. Chagyo Kenkyu Hokoku 2009, 94, 1–6.
- Chen, C.F.; Lin, J.Y. Estimating the gross budget of applied nitrogen and phosphorus in tea plantations. Sustain. Environ. Res. 2016, 26, 124–130.
- Chen, D.; Li, Y.; Wang, C. Measurement and modeling of nitrous and nitric oxide emissions from a tea field in subtropical central China. Nutr. Cycl. Agroecosyst. 2017, 107, 157–173.
- Li, Y.; Fu, X.; Liu, X. Spatial variability and distribution of N2O emissions from a tea field during the dry season in subtropical central China. Geoderma 2013, 193, 1–12.
- Yan, P.; Shen, C.; Fan, L.C.; Li, X.; Zhang, L.; Zhang, L.P.; Han, W.Y. Tea planting affects soil acidification and nitrogen and phosphorus distribution in soil. Agric. Ecosyst. Environ. 2018, 254, 20–25.
- Jeffery, S.; Verheijen, F.G.A.; van der Velde, M.; Bastos, A.C. A quantitative review of the effects of biochar application to soils on crop productivity using meta-analysis. Agric. Ecosyst. Environ. 2011, 144, 175–187.
- Gul, S.; Whalen, J.K. Biochemical cycling of nitrogen and phosphorus in biochar amended soils. Soil Biol. Biochem. 2016, 103, 1–15.
- Purakayastha, T.J.; Bera, T.; Bhaduri, D. A review on biochar modulated soil condition improvements and nutrient dynamics concerning crop yields: Pathways to climate change mitigation and global food security. Chemosphere 2019, 227, 345–365.
- Raboin, L.M.; Razafmahafaly, A.H.D.; Rabenjarisoa, M.B. Improving the fertility of tropical acid soils: Liming versus biochar application? A long-term comparison in the highlands of Madagascar. Field Crops Res. 2016, 199, 99–108.
- Yuan, J.H.; Xu, R.K.; Qian, W.; Wang, R.H. Comparison of the ameliorating effects on an acidic ultisol between four crop straws and their biochars. J. Soils Sediments 2011, 11, 741–750.
- Ding, Y.; Liu, Y.; Liu, S.; Li, Z.; Tan, X.; Huang, X.; Zeng, G.; Zhou, L.; Zheng, B. Biochar to improve soil fertility. Rev. Agron. Sustain. Dev. 2016, 36, 36.
- Kanthle, A.K.; Lenka, N.K.; Lenka, S. Biochar impact on nitrate leaching as influenced by native soil organic carbon in an Inceptisol of central India. Soil Tillage Res. 2016, 157, 65–72.
- Xu, N.; Tan, G.; Wang, H. Effect of biochar additions to soil on nitrogen leaching, microbial biomass and bacterial community structure. Eur. J. Soil Biol. 2016, 74, 1–8.
- Haider, G.; Steffens, D.; Moser, G. Biochar reduced nitrate leaching and improved soil moisture content without yield improvements in a four-year field study. Agric. Ecosyst. Environ. 2017, 237, 80–94.
- Marks, A.; Mattana, S.; AlcaIz, J.M.; P’erez-Herrero, M.; Domene, X. Gasifier biochar effects on nutrient availability, organic matter mineralization, and soil fauna activity in a multi-year Mediterranean trial. Agric. Ecosyst. Environ. 2016, 215, 30–39.
- Olmo, M.; Villar, R.; Salazar, P.; Alburquerque, J.A. Changes in soil nutrient availability explain biochar’s impact on wheat root development. Plant Soil 2016, 399, 333–343.
- Gao, S.; DeLuca, T.H.; Cleveland, C.C. Biochar additions alter phosphorus and nitrogen availability in agricultural ecosystems: A meta-analysis. Sci. Total Environ. 2019, 654, 463–472.
- Sarfraz, R.; Yang, W.; Wang, S.; Zhou, B.; Xing, S. Short term effects of biochar with different particle sizes on phosphorous availability and microbial communities. Chemosphere 2020, 256, 126862.
- Mclean, E.O. Soil pH and lime requirement. Methods Soil Anal. Part 2 Chem. Microbiol. Prop. 1982, 9, 199–224.
- Nguyen, B.; Lehmann, J. Black carbon decomposition under varying water regime. Org. Geochem. 2009, 40, 846–853.
- Ball, D.F. Loss on Ignition as an estimate of organic matter and organic carbon in non-calcareous soil. J. Soil Sci. 1964, 15, 84–92.
- Weatherburn, M.W. Phenol-hypochlorite reaction for determination of ammonia. Anal. Chem. 1967, 39, 971–974.
- Lajtha, K.; Schlesinger, W.H. The biogeochemistry of phosphorus cycling and phosphorus availability along a desert soil chronosequence. Ecology 1988, 69, 24–39.
More
Information
Subjects:
Soil Science; Agronomy
Contributor
MDPI registered users' name will be linked to their SciProfiles pages. To register with us, please refer to https://encyclopedia.pub/register
:
View Times:
1.6K
Entry Collection:
Environmental Sciences
Revisions:
2 times
(View History)
Update Date:
21 Feb 2022
Table of Contents


Notice
You are not a member of the advisory board for this topic. If you want to update advisory board member profile, please contact office@encyclopedia.pub.
OK
Confirm
Only members of the Encyclopedia advisory board for this topic are allowed to note entries. Would you like to become an advisory board member of the Encyclopedia?
Yes
No
${ textCharacter }/${ maxCharacter }
Submit
Cancel
Back
Comments
${ item }
|
${ item.createdUser.fullName }
${ item.createdAt }
${ item.vote }
${ item.reply }
Delete
${ reply.createdUser.fullName }
${ reply.createdAt }
${ reply.vote }
Delete
There is no reply to this comment~
${ item.replyTextCharacter }/${ item.replyMaxCharacter }
Submit
Cancel
More
No more~
There is no comment~
${ textCharacter }/${ maxCharacter }
Submit
Cancel
${ selectedItem.replyTextCharacter }/${ selectedItem.replyMaxCharacter }
Submit
Cancel
Confirm
Are you sure to Delete?
Yes
No