Your browser does not fully support modern features. Please upgrade for a smoother experience.
Submitted Successfully!
 +1 credit
Thank you for your contribution! You can also upload a video entry or images related to this topic.
For video creation, please contact our Academic Video Service.
| Version | Summary | Created by | Modification | Content Size | Created at | Operation |
|---|---|---|---|---|---|---|
| 1 | Stephen Morse | + 1904 word(s) | 1904 | 2022-01-27 05:02:05 | | | |
| 2 | Yvaine Wei | + 6 word(s) | 1910 | 2022-02-11 04:55:20 | | |
Video Upload Options
We provide professional Academic Video Service to translate complex research into visually appealing presentations. Would you like to try it?
Cite
If you have any further questions, please contact Encyclopedia Editorial Office.
Morse, S. Poor Air Quality in Urban Settings. Encyclopedia. Available online: https://encyclopedia.pub/entry/19342 (accessed on 23 July 2026).
Morse S. Poor Air Quality in Urban Settings. Encyclopedia. Available at: https://encyclopedia.pub/entry/19342. Accessed July 23, 2026.
Morse, Stephen. "Poor Air Quality in Urban Settings" Encyclopedia, https://encyclopedia.pub/entry/19342 (accessed July 23, 2026).
Morse, S. (2022, February 10). Poor Air Quality in Urban Settings. In Encyclopedia. https://encyclopedia.pub/entry/19342
Morse, Stephen. "Poor Air Quality in Urban Settings." Encyclopedia. Web. 10 February, 2022.
Copy Citation
Poor air quality (PAQ) is a global concern, especially in urban areas, and is often seen as an important element of social sustainability given its negative impact on health and quality of life. Smoke, odour and dust particles were perceived to be the most important indicators of PAQ, while the main sources of PAQ were waste and bush burning, vehicle use and power generators. The two most preferred control measures were proper waste management and the avoidance of bush burning.
air quality
cities
perceptual indicators
causes
control measures
responsibility
1. Introduction
The steady upsurge in urban populations, particularly in developing nations, has led to increases in poor air quality (PAQ) [1][2][3][4][5]. Air pollutants such as oxides of nitrogen (NOx), sulphur dioxide (SO2), carbon monoxide (CO), ozone (O3), ammonia (NH3), volatile organic compounds (VOCs), particulate matter (PM), lead (Pb) and so on contribute to adverse effects on human and ecosystem health, and this can in turn impact negatively on social sustainability [5].
According to [6], air quality is better in rural areas compared with urban areas, and they attributed this to the likelihood of fewer emission sources such as traffic and industry in rural settlements. In the same vein, the morphology (buildings and developments) of urban areas, urban constituents, differences in vegetation and anthropogenic activities modify the tropospheric part of the atmosphere over cities and can exacerbate PAQ [7]. However, it should be noted that PAQ may not always be attributed to the emission of pollutants into the atmosphere through human activities. According to [8] noted that contributors to PAQ can be grouped into four main categories: natural, area, mobile and major sources. ‘Natural’ sources include physical disasters such as forest fires, volcanic erosion, dust storms and agricultural burning. ‘Area’ sources include domestic and commercial cleaning activities, printing shops, and petrol stations. ‘Mobile’ sources comprise automobiles, cars, railways, airways, and other types of vehicles. ‘Major’ sources contain the emission of pollutants from power stations and refineries as well as petrochemical, chemical, fertilizer, metallurgical and other industrial plants, and incineration.
2. Perceptual Indicators of PAQ
The results for the use of perceptual indicators of PAQ in Abuja and Enugu are shown in Figure 1a,b. The Spearman rank correlation for the mean indicator scores from Abuja and Enugu is 0.7 (p < 0.05). This similarity in the respondents’ overall mean scores (both ranging between approx. 1.8 and 3) suggest that there is little difference between respondents from the two cities in the overall strength of views regarding the importance given to the range of indicators. The mean ratings indicate that most of the indicators were of some use in the perception of PAQ in both Abuja and Enugu, with only a couple of indicators in both cities rated as ‘neutral’ and no indicators rated as rarely used or not used at all. In Abuja, the post hoc test identified three groups (horizontal lines in Figure 1a) of indicators without a significant difference between them. Group 1 comprises the most frequently used indicators namely dust in the air, smoke, odour, dirt on skin and clothes and dirt on surfaces such as buildings. Group 2 comprised the indicators of smoke, odour and dirt on skin and clothes, dirt on surfaces such as buildings, visibility, and sneezing/coughing; and Group 3 comprised of watery/irritated eyes and skin irritation. Dust in the air is the most commonly employed means by which people perceive the quality of air in Abuja, but Group 1 in Figure 1a comprises some indicators closely related to dust in the air (i.e., smoke, dust on skin/clothes, dust on surfaces). Skin irritation is ranked as the least used indicator of PAQ in Abuja. In Figure 1b, the indicators for Enugu fell into four groups but, interestingly, the three most commonly used indicators (dust in the air, smell/odour and smoke) are the same in both cities, albeit in a slightly different order between the cities. As in Abuja, the least used indicator in Enugu was skin irritation. Therefore, the results show that respondents from the two cities most frequently employed dust particles in the air, smoke and odour as their main means of perceiving PAQ. In the ‘middle ground’ indicators, there are differences between the two cities in their specific ranking order, although these are usually only of two places in the order suggesting relatively minor local nuances.
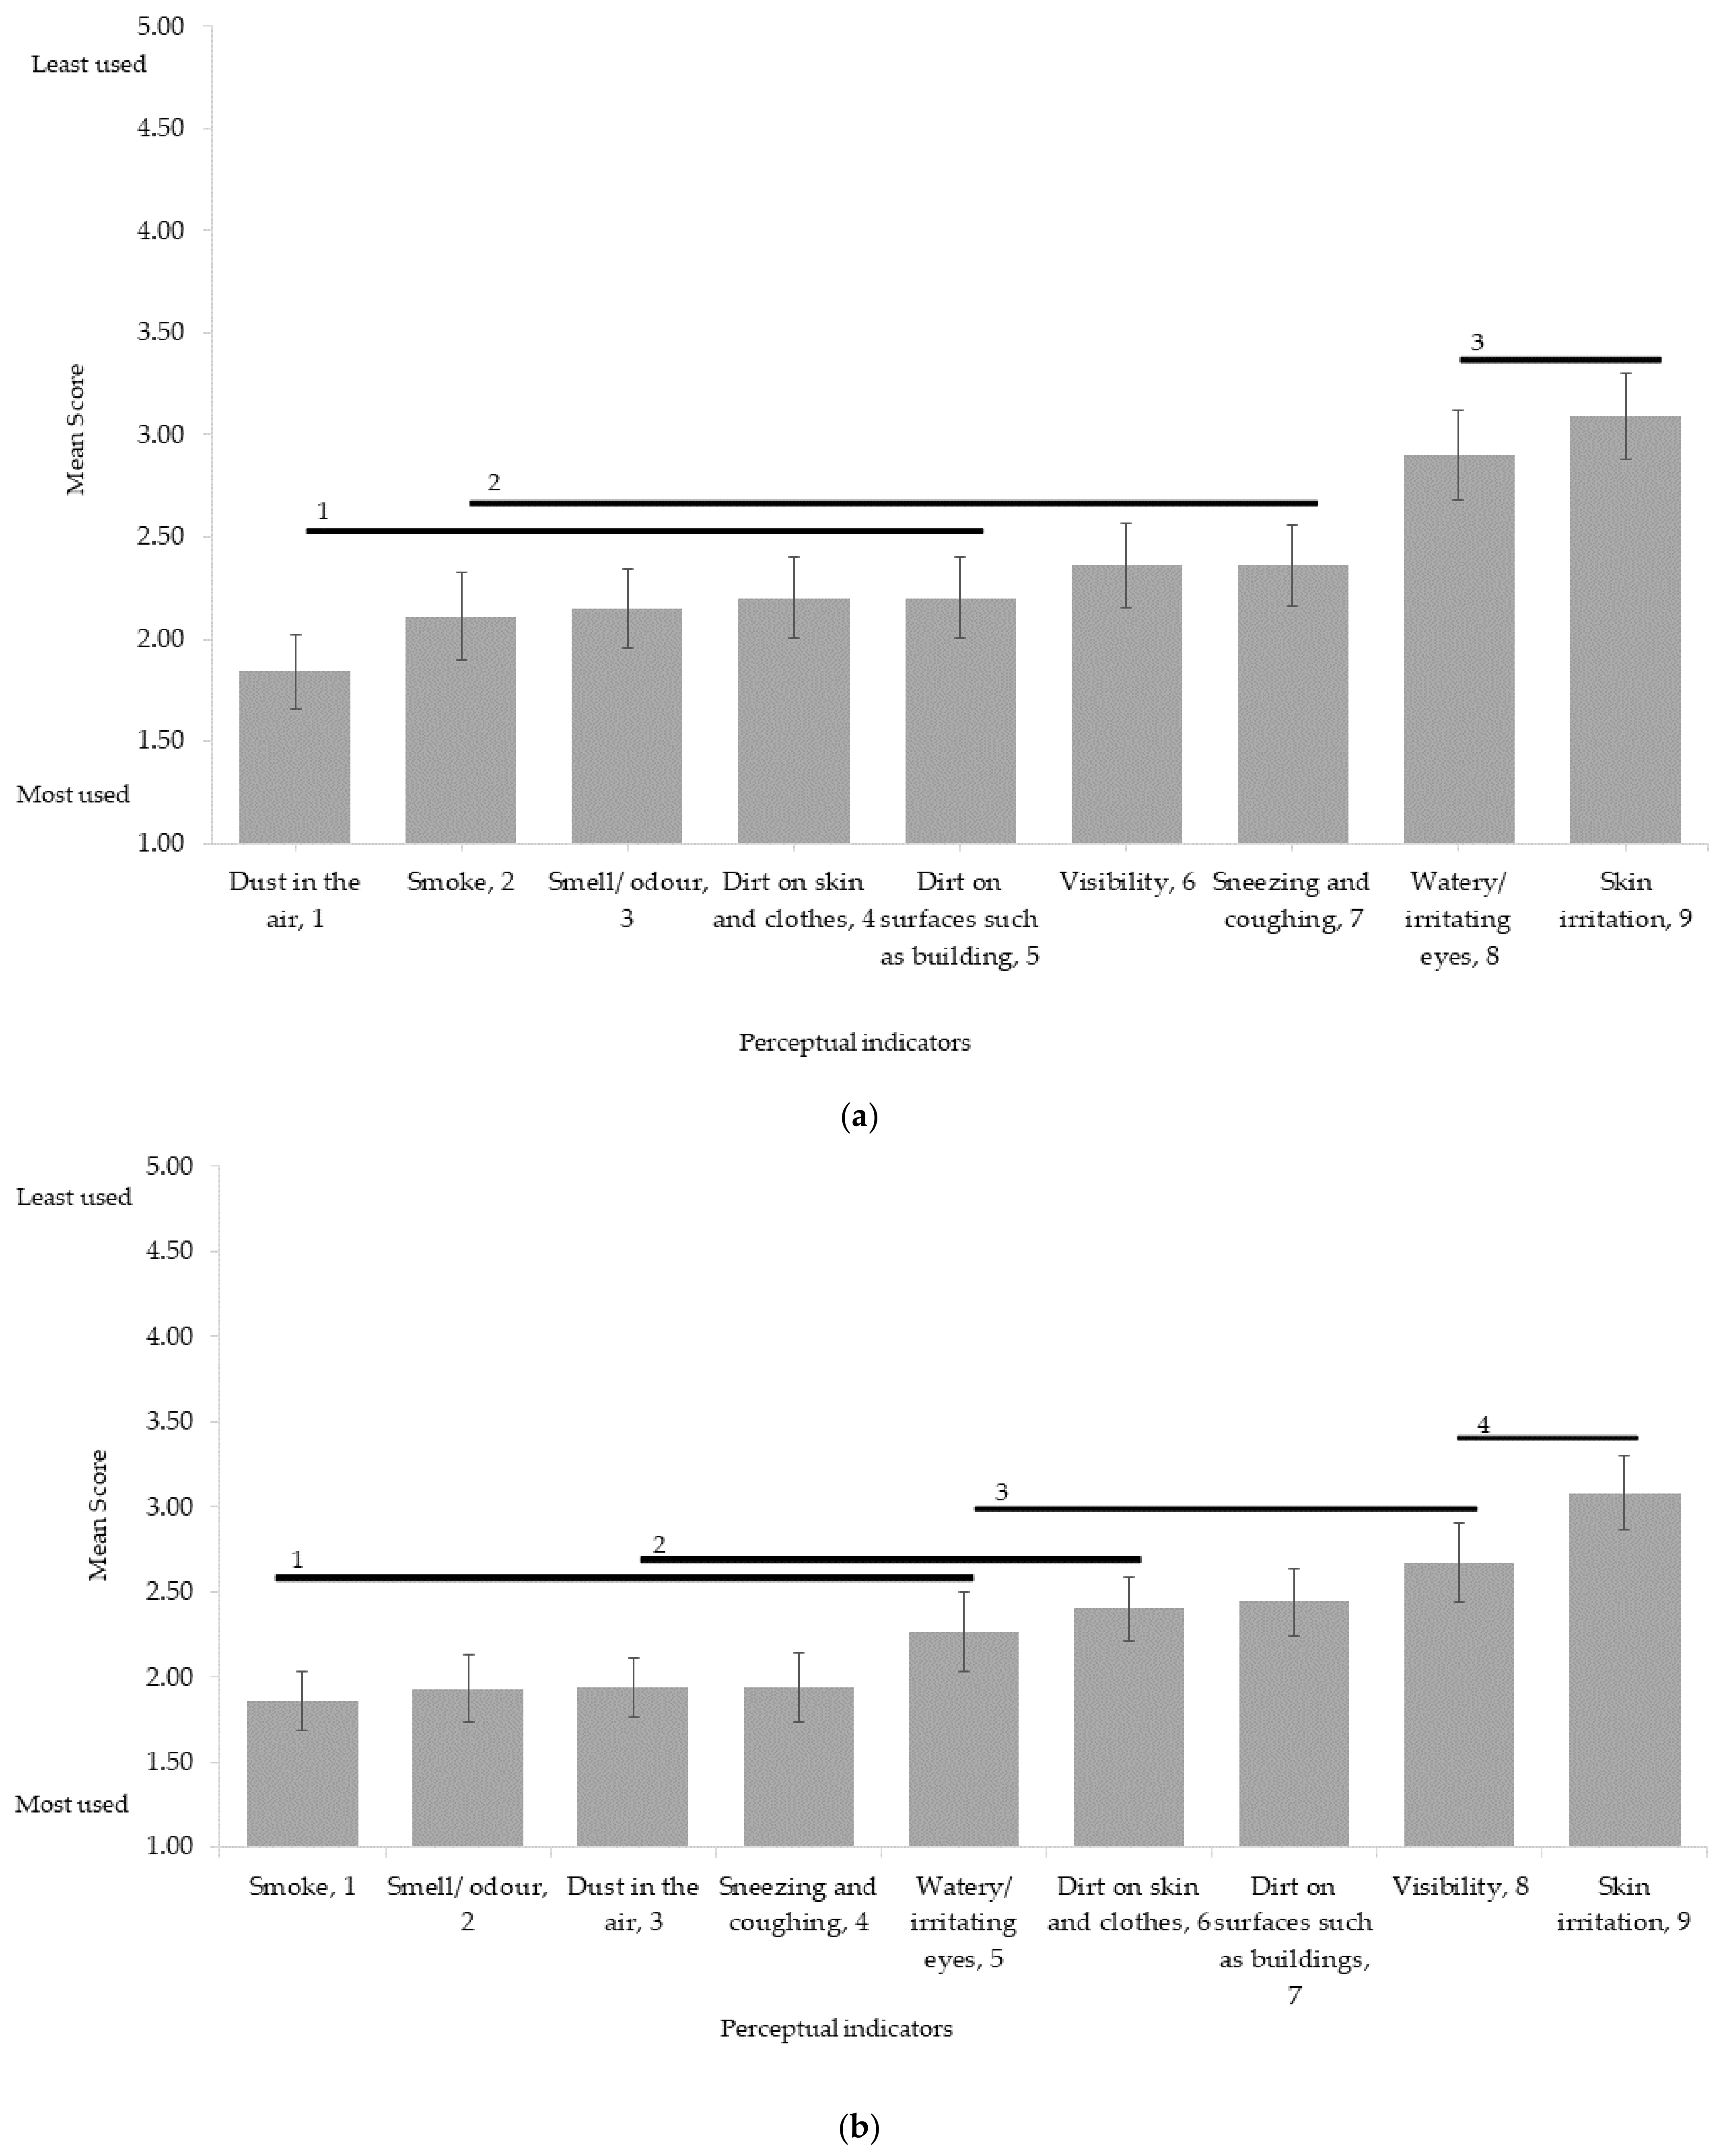
Figure 1. (a) Perceptual Indicators of PAQ in Abuja. (b) Perceptual Indicators of PAQ in Enugu. Numbers on the horizontal axis are the ranks for the perceptual indicators. Error bars are the 95% confidence interval for the means. Horizontal bars (and numbers) are the groups identified via the Hochberg post hoc test as significant at p < 0.05.
3. Sources of PAQ
The results for the perceived sources of PAQ in Abuja and Enugu are shown in Figure 2a,b. The Spearman rank correlation for the mean scores of PAQ sources from Abuja and Enugu is 0.931 (p < 0.001), which suggests that the broad pattern in the ranking of PAQ sources is the same for the two cities. In both cities, the biggest contributors (Group 1) to PAQ are broadly the same and comprise bush fires, manufacturing, waste burning, generators and manufacturing, although the order is slightly different. Similarly, the least important sources are also alike and comprise cooking, rail and air transport and dry cleaning.
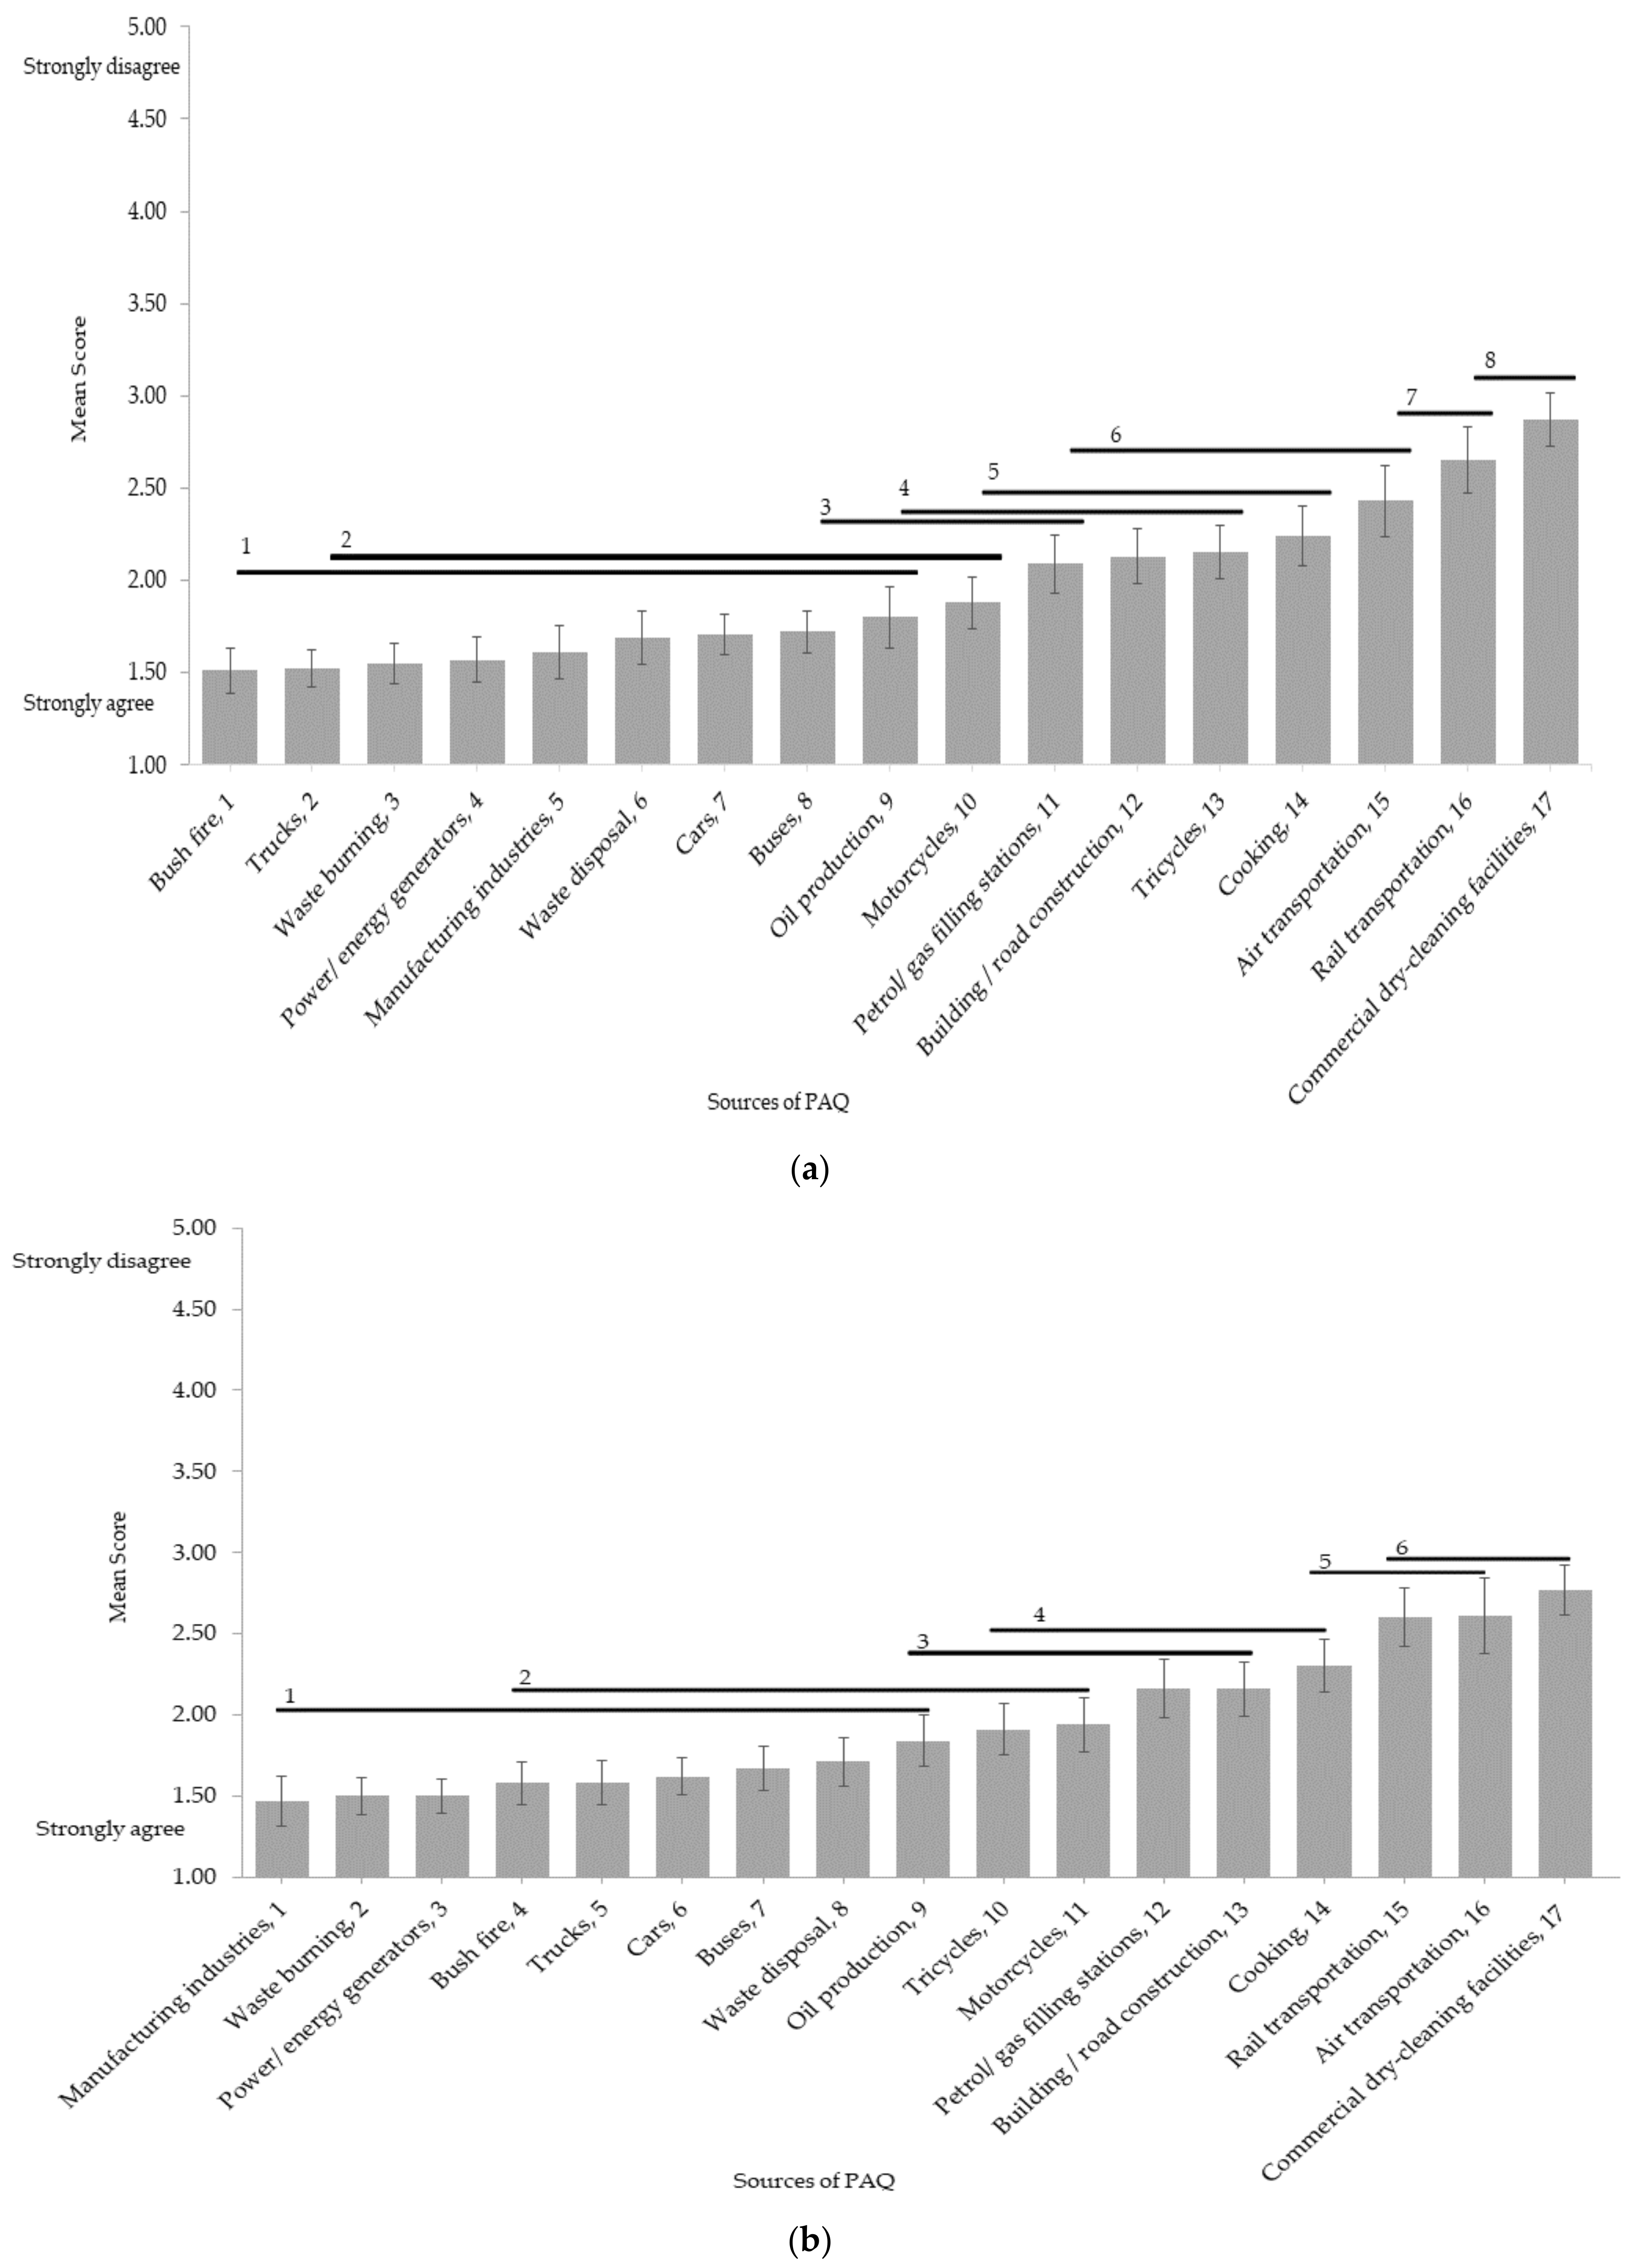
Figure 2. (a) Residents’ perception of sources of PAQ in Abuja. (b) Residents’ perception of sources of PAQ in Enugu. Numbers on the horizontal axis are the ranks for the perceptual indicators. Error bars are the 95% confidence interval for the means. Horizontal bars (and numbers) are the groups identified via the Hochberg post hoc test as significant at p < 0.05.
4. Control Measures for PAQ
The results for the control measures that should be adopted to address PAQ in Abuja and Enugu are shown in Figure 3a,b. The Spearman rank correlation for the mean scores of PAQ control measures PAQ from Abuja and Enugu is 0.914 (p < 0.001), which suggest many similarities in scoring between the respondents of the two cities. The top two control measures rated most highly by Abuja respondents (Figure 3a)-proper waste disposal and incineration and avoiding bush burning—are the same as those identified by the Enugu sample (Figure 3b), while the least important control measure in both cities is the reduction in air travel. In between these extremes, the scoring of various control measures does vary across the two cities, but the broad pattern is similar.
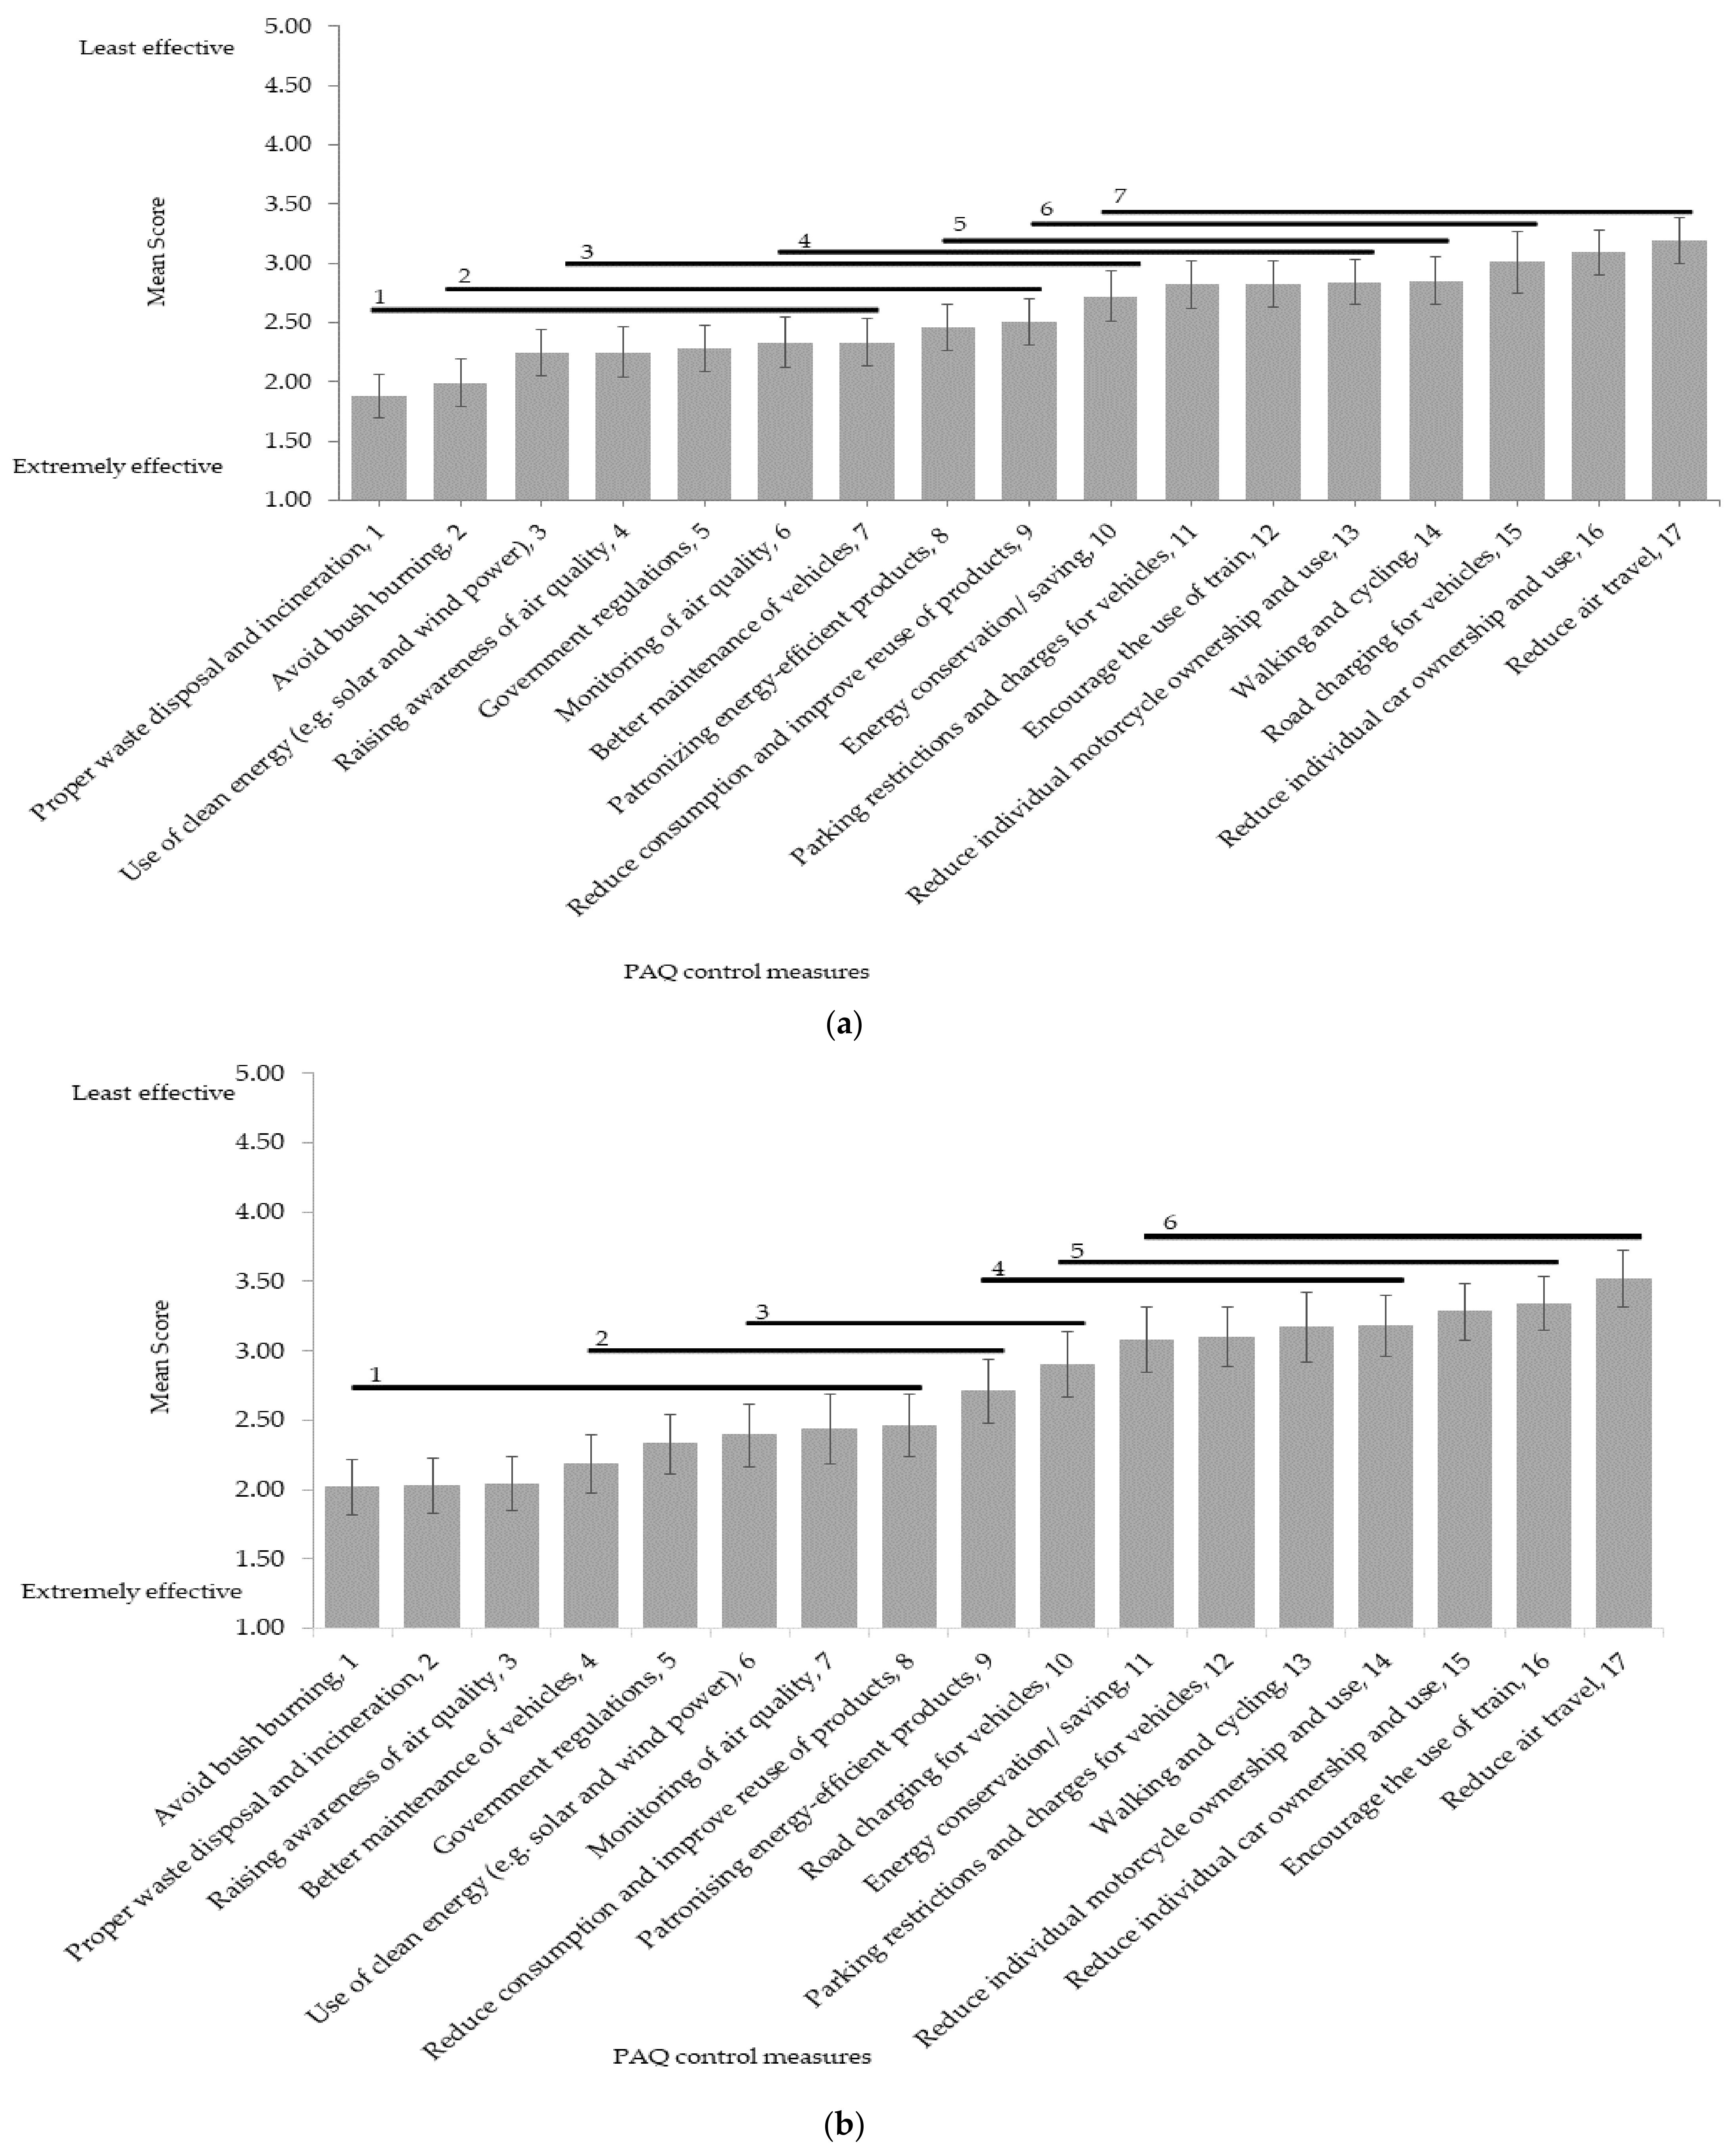
Figure 3. (a). Residents’ perception of control measures for PAQ in Abuja. (b). Residents’ perception of control measures for PAQ in Enugu. Numbers on the horizontal axis are the ranks for the perceptual indicators. Error bars are the 95% confidence interval for the means. Horizontal bars (and numbers) are the groups identified via the Hochberg post hoc test as significant at p < 0.05.
5. Primary Responsibility of Implementing PAQ Control Measures
Figure 4a,b illustrates the viewpoints of the residents of Abuja and Enugu on who should take the lead in ensuring improved AQ in both cities. The Spearman rank correlation for the mean scores of organisations having primary responsibility for addressing PAQ from Abuja and Enugu is 0.1 (p > 0.05), suggesting that the respondents from the two cities do take very different views. In Abuja, the people believe that the federal government should be in the primary position to tackle PAQ, and they see NGOs as the least expected to implement control measures against PAQ. Conversely, participants in Enugu see the federal government as the least important when it comes to implementing such measures and would rather take the lead themselves as members of the public in conjunction with the state government.
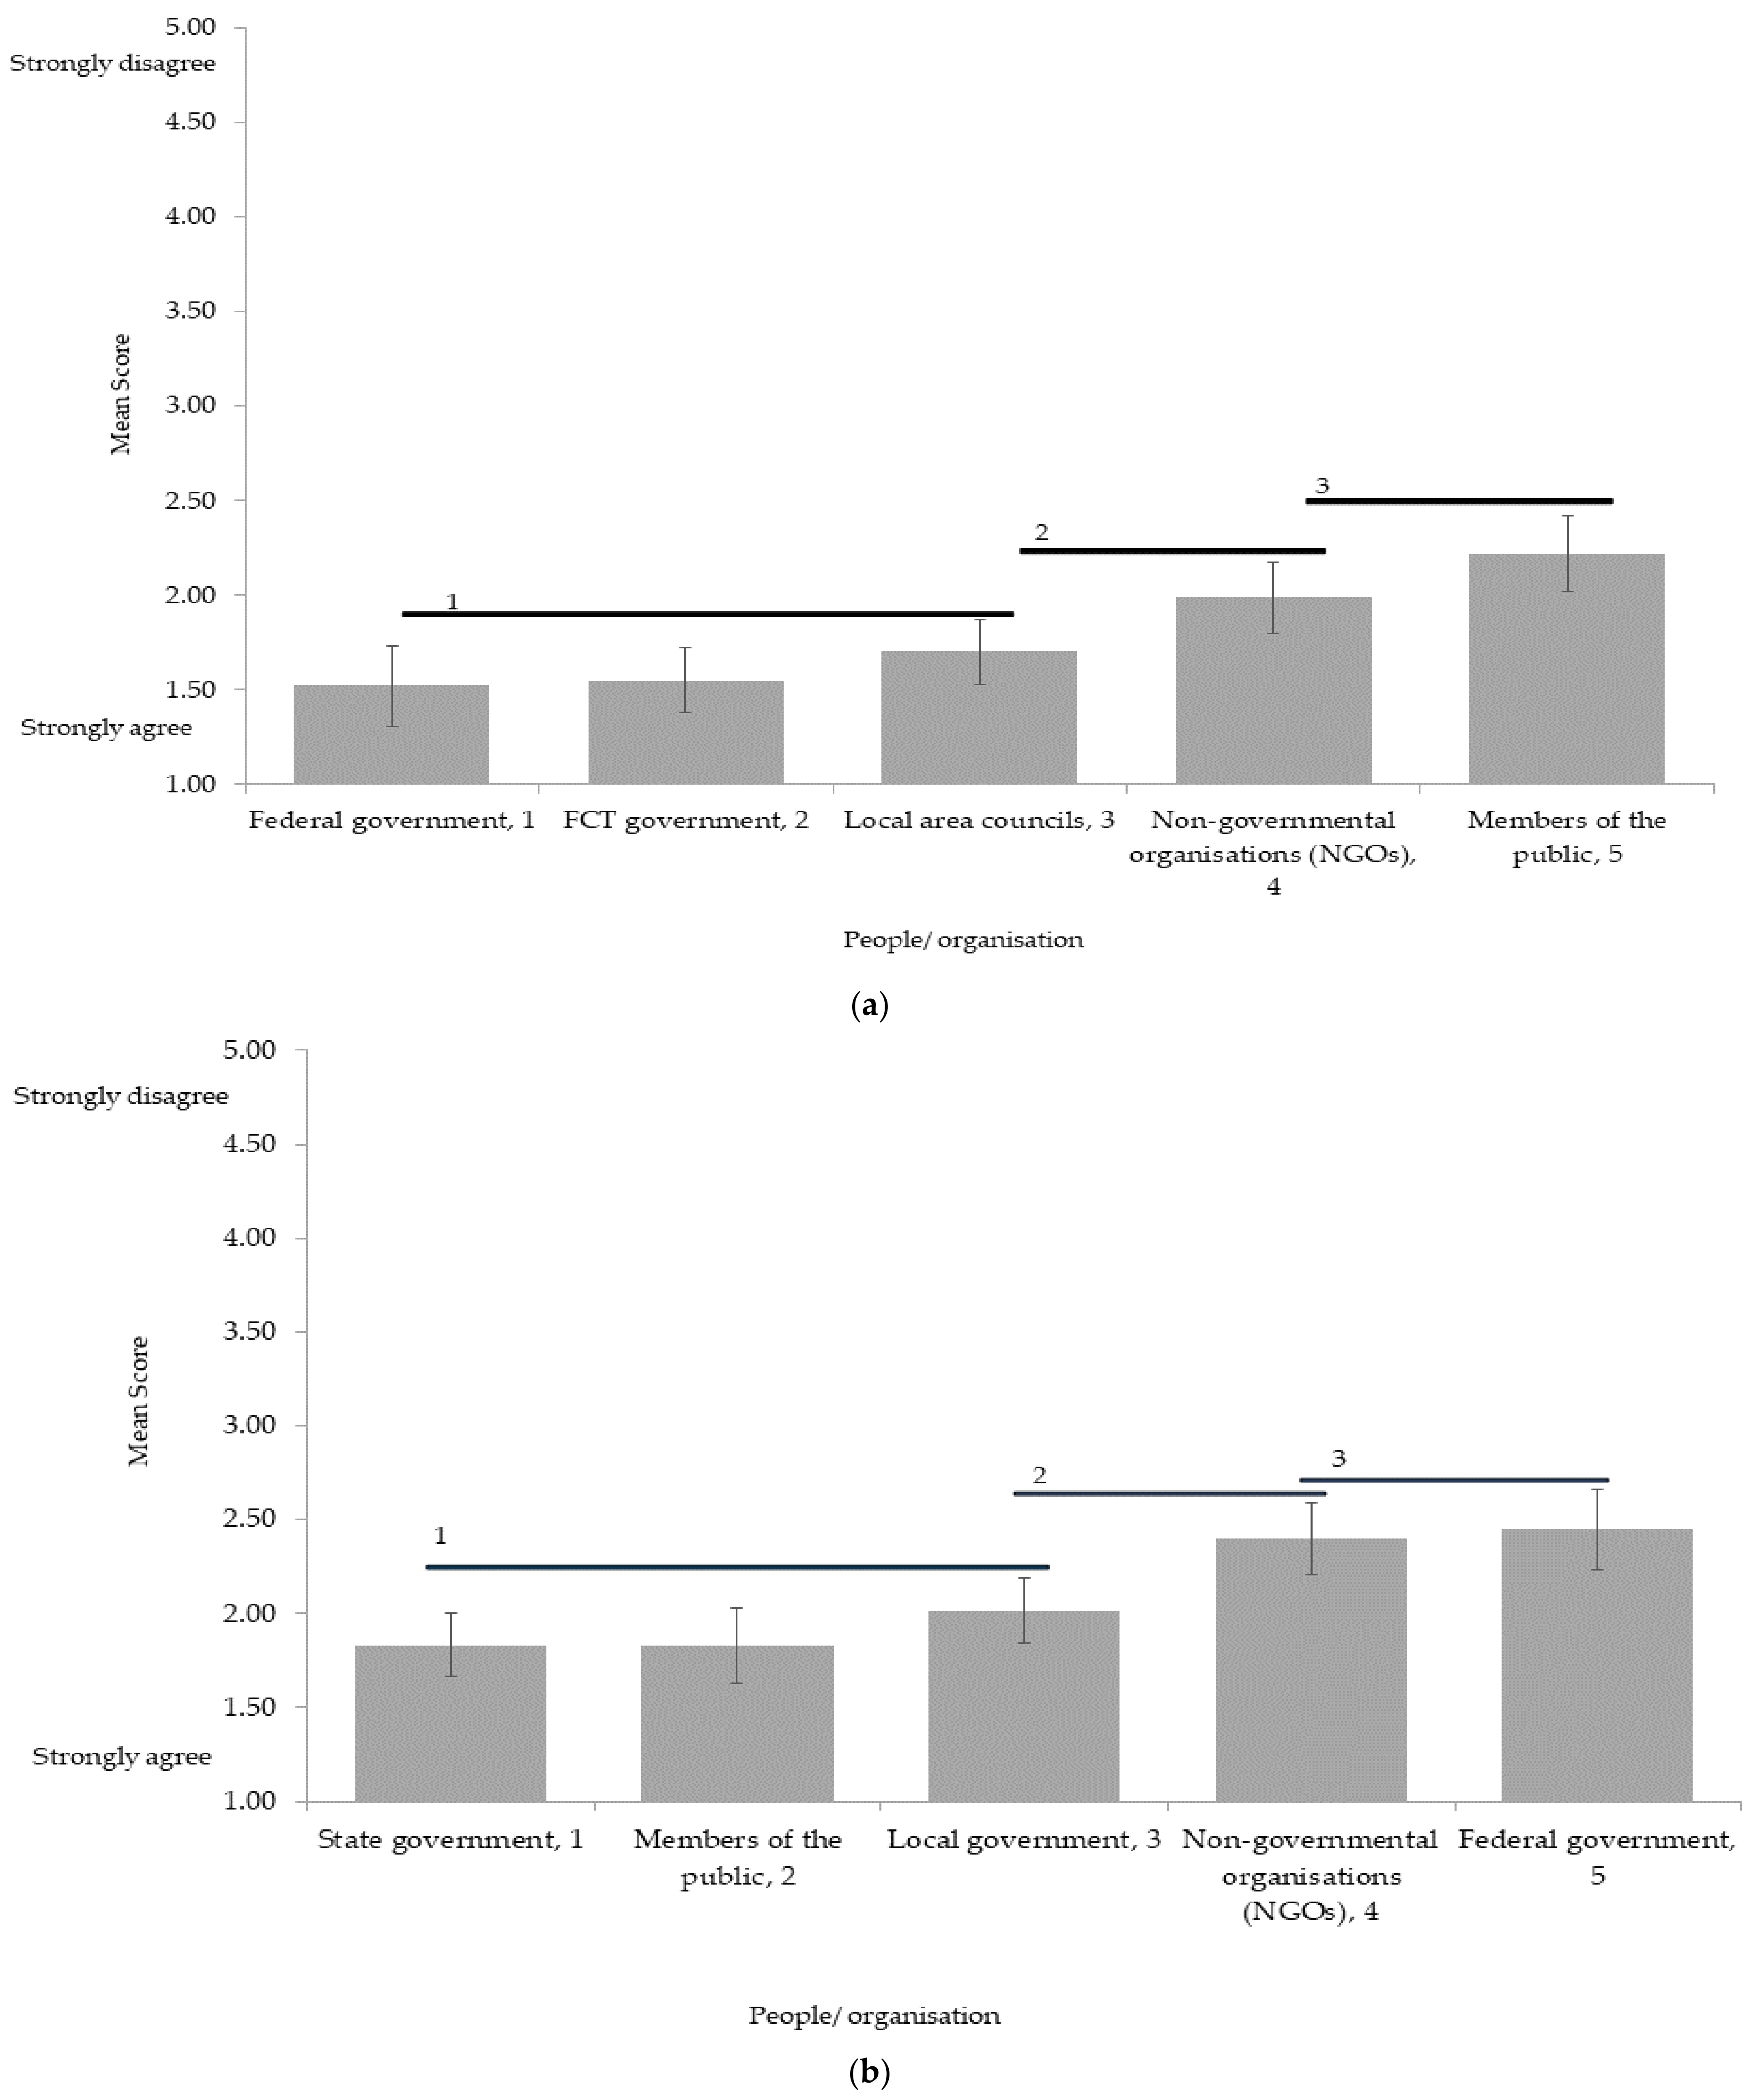
Figure 4. (a). Residents’ perception of primary responsibility for PAQ control in Abuja. (b). Residents’ perception of primary responsibility for PAQ control in Enugu. Numbers on the horizontal axis are the ranks for the perceptual indicators. Error bars are the 95% confidence interval for the means. Horizonal bars (and numbers) are the groups identified via the Hochberg post hoc test as significant at p < 0.05.
6. Main Perceived Indicator and Factors of PAQ
The results obtained demonstrate that respondents in both cities clearly recognise that they experience PAQ. Indeed, their views over perceptual indicators, causes and controls were broadly similar with little evidence of a clear pattern of significant differences between the demographic groups. The indicators that respondents from the two cities said they used the most were smoke and dust. For example, studies such as [9][10][11][12] noted that odour was identified as the main perceived indicator of PAQ. However, it is interesting to note that visibility and factors such as skin and eye irritation and coughing did not score so high as the presence of odour, smoke and dust, and this does contrast to some extent with the results of previous studies. For example, studies by [13][14][15][16] highlighted visual experience or visibility as a widely used indicator, and coughing and sneezing are also used by people who are especially sensitive to PAQ such as those suffering from asthma [16].
When it comes to the perceived main causes of PAQ there was also a high degree of agreement between the two cities and indeed between demographic groups. While some significant differences were noted between some of the demographic groups these were relatively few and there was no clear and consistent pattern of difference. Respondents perceived that combustion-based human activities are the main sources of PAQ, and these include vehicular movement, manufacturing, the use of generators, bush fire (although these tend to happen more in the dry season and at the start of the growing season) and waste incineration. These findings are broadly in line with the results of other published studies. For example, incineration and vehicles as the main sources of PAQ in New Zealand [17], and vehicular emissions and bush burning are perceived by residents as major sources of PAQ in Mathare, a slum in Nairobi, Kenya [9], and the major contribution of vehicles to PAQ was also identified by [18], Ref. [19] in Nanchang, China, and [20] in Columbian cities. These perceptual findings are related to the measuring equipment findings of [21][22] which found that vehicle emissions were the chief cause of air pollution in Enugu city, while the works of [23][24][25] identified pollution from trucks as one of the top two main sources of PAQ.
The respondents from both cities also broadly agreed about the main control measures of PAQ that should be put in place. Proper waste disposal and incineration, and the avoidance of bush burning were scored highly by respondents, and this agrees with the findings of [19] who noted that control and reduction of waste burning is one of the most important means of solving PAQ problems in China. At the other end of the scale, respondents were not so positive about methods for controlling vehicle use or indeed the use of walking, cycling and mass transit systems such as train, and this is somewhat at odds with recommendations that are often espoused by international agencies such as the World Health Organization [26].
Decision-making on the environment and urban development should be a participatory process, employing public perceptions of the environment including air quality, and giving members of the public the chance to convey their views and concerns. Ensuring a smart and clean city will undoubtedly profit from incorporating study of the perceptions of residents as a means to better understand their views about their locale and reducing environmental risks. This approach to assessing PAQ and its management offers considerable scope for further development in both study areas and beyond, and should be explored further in relation to meeting the SDGs targets and creating a better environment.
References
- Xie, X.; Semanjski, I.; Gautama, S.; Tsiligianni, E.; Deligiannis, N.; Rajan, R.; Philips, W. A Review of Urban Air Pollution Monitoring and Exposure Assessment Methods. ISPRS Int. J. Geo Inf. 2017, 6, 389.
- Avtar, R.; Saurabh, T.; Aggarwal, A.K.; Kumar, P. Population-Urbanization-Energy Nexus: A Review. Resources 2019, 8, 136.
- Odonkor, S.T.; Mahami, T. Knowledge, Attitudes, and Perceptions of Air Pollution in Accra, Ghana: A Critical Survey. J. Environ. Public. Health 2020, 2020, 3657161.
- Mafizur, R.M.; Vu, X.B. Are Energy Consumption, Population Density and Exports Causing Environmental Damage in China? Autoregressive Distributed Lag and Vector Error Correction Model Approaches. Sustainability 2021, 13, 3749.
- Agbo, K.E.; Walgraeve, C.; Eze, J.I.; Ugwoke, P.E.; Ukoha, P.O.; Van Langenhove, H. A review on ambient and indoor air pollution status in Africa. Atmos. Pollut. Res. 2021, 12, 243–260.
- Strosnider, H.; Kennedy, C.; Monti, M.; Yip, F. Rural and Urban Differences in Air Quality, 2008–2012, and Community Drinking Water Quality, 2010–2015—United States. Morbidity and mortality weekly report. Surveill. Summ. 2017, 66, 1–10.
- Grimmond, C.S.B.; Roth, M.; Oke, T.R.; Au, Y.C.; Best, M.; Betts, R.; Carmichael, G.; Cleugh, H.; Dabberdt, W.; Emmanuel, R.; et al. Climate and more sustainable cities: Climate information for improved planning and management of cities (Producers/Capabilities Perspective). Procedia Environ. Sci. 2010, 1, 247–274.
- Manisalidis, I.; Stavropoulou, E.; Stavropoulos, A.; Bezirtzoglou, E. Environmental and Health Impacts of Air Pollution: A Review. Front. Public Health 2020, 8, 14.
- Ngo, N.; Kokoyo, S.; Klopp, J. Why participation matters for air quality studies: Risk perceptions, understandings of air pollution and mobilization in a poor neighborhood in Nairobi, Kenya. Public Health 2017, 142, 177–185.
- Oltra, C.; Sala, R. A Review of the Social Research on Public Perception and Engagement Practices in Urban Air Pollution; CIEMAT/Departamento de Medio Ambiente: Madrid, Spain, 2014.
- Bickerstaff, K.; Walker, G. Public understandings of air pollution: The ‘localisation’ of environmental risk. Glob. Environ. Chang. 2001, 11, 133–145.
- Conti, C.; Guarino, M.; Bacenetti, J. Measurements techniques and models to assess odour annoyance: A review. Environ. Int. 2020, 134, 105261.
- Brimblecombe, P. Visibility Driven Perception and Regulation of Air Pollution in Hong Kong, 1968–2020. Environments 2021, 8, 51.
- Malm, W.C.; Schichtel, B.; Molenar, J.; Prenni, A.; Peters, M. Which visibility indicators best represent a population’s preference for a level of visual air quality? J. Air Waste Manag. Assoc. 2018, 69, 145–161.
- Bickerstaff, K. Risk perception research: Socio-cultural perspectives on the public experience of air pollution. Environ. Int. 2004, 30, 827–840.
- Smallbone, K. Individuals’ Interpretation of Air Quality Information. 2019. Available online: https://research.brighton.ac.uk/files/336785/1210261047_Individuals_interpretation_of_air_quality_information_customer_insight_and_awareness_study.pdf (accessed on 6 October 2021).
- Ancelet, T.; Davy, P.K.; Trompetter, W.J.; Markwitz, A. Sources of particulate matter pollution in a small New Zealand city. Atmos. Pollut. Res. 2014, 5, 572–580.
- Jacobi, P.R. Households and Environment in the City of Sao-Paulo—Problems, Perceptions and Solutions. Environ. Urban. 1994, 6, 87–110.
- Liao, X.; Tu, H.; Maddock, J.E.; Fan, S.; Lan, G.; Wu, Y.; Lu, Y. Residents’ perception of air quality, pollution sources, and air pollution control in Nanchang, China. Atmos. Pollut. Res. 2015, 6, 835–841.
- Ramírez, O.; Mura, I.; Franco, J.F. How Do People Understand Urban Air Pollution? Exploring Citizens’ Perception on Air Quality, Its Causes and Impacts in Colombian Cities. Open J. Air Pollut. 2017, 6, 1–17.
- Emodi, E.E. Environmental degradations, strategies and effective management practices in Enugu, Nigeria. Merit Res. J. 2017, 5, 35–45.
- Eze, C.T.; Ugwoke, J.L.; Ugwoke, J.J. Road traffic congestion and vehicular emission in Enugu urban Nigeria. Environ. Biotechnol. J. 2019, 38, 1–8.
- Ndoke, P.N.; Akpan, U.G.; Kato, M. Contributions of Vehicular Traffic to Carbon Dioxide Emissions in Kaduna and Abuja, Northern Nigeria. 2006. Available online: https://www.semanticscholar.org/paper/Contributions-of-Vehicular-Traffic-to-Carbon-in-and-Ndoke-Akpan/7b30e54f4ba1a5d2851460a0e460af583f91bd40 (accessed on 12 October 2021).
- Hassan, S.; Okobia, L. Survey of ambient air quality in some parts of the Federal Capital Territory, Abuja, Nigeria. J. Geogr. Dev. 2008, 2, 3–17.
- Wambebe, N.; Xiaoli, D. Ambient Air Quality Assessment within Abuja Municipal Area, Nigeria. Environ. Epidemiol. 2019, 3, 421.
- World Health Organization. Promoting Walking and Cycling. Available online: https://www.who.int/activities/promoting-walking-and-cycling (accessed on 4 December 2021).
More
Information
Subjects:
Area Studies; Anthropology
Contributor
MDPI registered users' name will be linked to their SciProfiles pages. To register with us, please refer to https://encyclopedia.pub/register
:
View Times:
897
Entry Collection:
Environmental Sciences
Revisions:
2 times
(View History)
Update Date:
11 Feb 2022
Table of Contents


Notice
You are not a member of the advisory board for this topic. If you want to update advisory board member profile, please contact office@encyclopedia.pub.
OK
Confirm
Only members of the Encyclopedia advisory board for this topic are allowed to note entries. Would you like to become an advisory board member of the Encyclopedia?
Yes
No
${ textCharacter }/${ maxCharacter }
Submit
Cancel
Back
Comments
${ item }
|
${ item.createdUser.fullName }
${ item.createdAt }
${ item.vote }
${ item.reply }
Delete
${ reply.createdUser.fullName }
${ reply.createdAt }
${ reply.vote }
Delete
There is no reply to this comment~
${ item.replyTextCharacter }/${ item.replyMaxCharacter }
Submit
Cancel
More
No more~
There is no comment~
${ textCharacter }/${ maxCharacter }
Submit
Cancel
${ selectedItem.replyTextCharacter }/${ selectedItem.replyMaxCharacter }
Submit
Cancel
Confirm
Are you sure to Delete?
Yes
No