 +1 credit
| Version | Summary | Created by | Modification | Content Size | Created at | Operation |
|---|---|---|---|---|---|---|
| 1 | Carmen Bax | + 5638 word(s) | 5638 | 2021-12-09 04:50:24 | | | |
| 2 | Vivi Li | Meta information modification | 5638 | 2022-02-08 02:34:24 | | | | |
| 3 | Vivi Li | Meta information modification | 5638 | 2022-02-08 02:43:57 | | |
Video Upload Options
Odor pollution related to industrial activities (e.g., chemical industries, oil and gas extraction and refining facilities, waste treatment and disposal facilities) is nowadays acknowledged as a serious environmental concern. Indeed, odors are currently subjected to control and regulation in many countries. Such regulations rely on the possibility of measuring odors. The methods that have been developed and standardized over the last years to measure odors, thereby including sensorial and instrumental techniques, are here described, thereby focusing on their applicability and limitations.
1. Introduction
In recent years, citizens’ attention towards air quality and pollution has increased significantly, and nowadays, odor pollution related to different industrial activities, such as agricultural activities, chemical industries, waste treatment and disposal facilities, and oil and gas extraction or refining facilities, is recognized as a well-known environmental issue [1]. Although odor emissions are generally considered harmless, in some cases, they cause citizens to complain to local authorities [2]. Indeed, populations do not generally perceive several conventional pollutants, even if the exposure limit concentrations are exceeded. On the contrary, odors can be perceived far below normal exposure limit concentrations, because some odorous compounds have extremely low odor detection threshold concentrations [3]. For this reason, odors are nowadays subjected to control and regulations in many countries, and specific methods for odor measurement have been developed [3][4]. Such methods include both sensorial and instrumental techniques, with each having specific advantages and drawbacks. The most important methods for odor measurement include:
-
Dynamic olfactometry;
-
Chemical analysis (with speciation or non-specific);
-
Gas chromatography-olfactometry (GC-O);
-
Tracer analysis;
-
Instrumental odor monitoring systems (IOMS);
-
Field inspection;
-
Field olfactometry; and
-
Citizen science (CS).
Dynamic olfactometry and field inspection are the only methods specifically developed for odor measurement, which have been standardized at the European level [5][6][7]. Techniques involving chemical characterization and IOMS are consolidated analytical techniques, commonly adopted to provide information about the odor properties of gaseous mixtures. Conversely, methods based on citizen science have been proposed in recent years to address socio-environmental conflicts within the impacted communities [8][9]. In particular, these programs consist in the active involvement of citizens in the mapping and the management of odour pollution problems, thereby allowing to co-create local solutions together with industries, regional and local authorities and odor experts [10][11].
2. Overview of Odor Measurement Methods
2.1. General Schematization of Odor Measurement Methods
Over the years, diverse methods have been studied and developed for the characterization of environmental odors, with the purpose of assessing the odor impact of industrial activities on surrounding territories. Figure 1 proposes a schematization of the existing methods for odor measurement based on the type of approach (i.e. instrumental vs. sensorial measurements) and where the methods can be applied:
-
Emissions: For measuring odors at emission sources; and
-
Receptors: For measuring odors in ambient air, directly where citizens are located and where complaints come from.
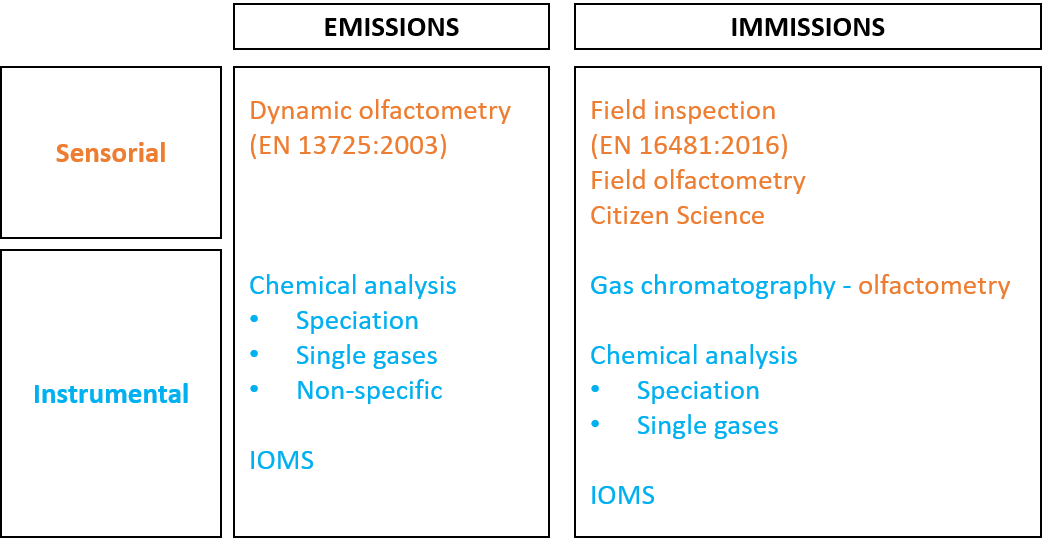
Figure 1. Schematization of odor measurement methods.
2.2. Dynamic Olfactometry
2.2.1. Brief Description of the Method
Dynamic olfactometry is a sensorial method standardized by the European Standard EN 13725:2003 [5], which provides the odor concentration of a sample, referring to the sensation that it causes in a panel of opportunely selected people directly exposed to that odor. The odor concentration, expressed in European odor units per cubic meter (ouE/m3), represents the number of dilutions with neutral (i.e. odourless) air that are necessary to bring the concentration of the sample to its odor detection threshold (OT), i.e., the threshold at which the odor is perceived by 50% of the examiners. To put it in the simplest manner, if the sample needs to be diluted 100 times with odorless air so that the panel cannot perceive the odor anymore, this means that the sample has a concentration of 100 ouE/m3. The analysis is carried out by presenting the sample to the examiners (i.e., panelists) at increasing concentrations by means of a dilution device, called an olfactometer, which dilutes the samples according to given ratios with reference air, which is made odor- and humidity-free through filtration with active carbon or silica gel (Figure 2). In order to ensure reliable and repeatable results, the EN 13725:2003 fixes precise criteria for panel selection based on individuals’ threshold for n-butanol in nitrogen (between 20 and 80 ppb) and the standard deviation of the individual’s responses, which should be verified periodically.
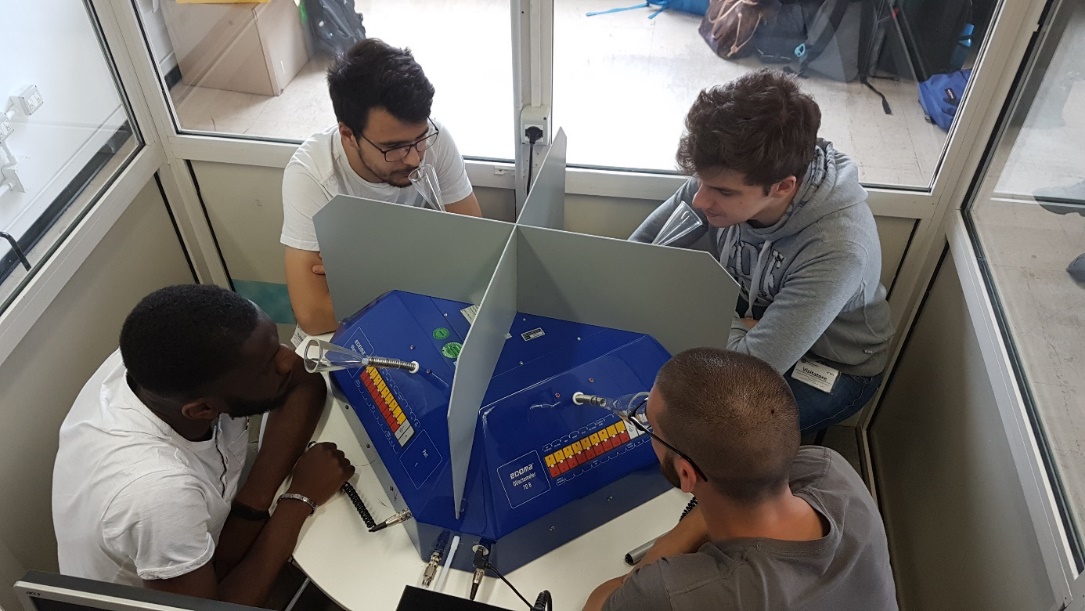
Figure 2. Dynamic olfactometry session.
2.2.2. Applicability and Limitations
Dynamic olfactometry is used to characterize odor emission sources. Indeed, in providing objective information about odor concentration, it can be used alone to assess the efficiency of odor abatement systems or in combination with dispersion models to evaluate odor impacts caused by different odor-emitting activities on the surrounding communities. The combination of the odor concentration with the information related to the emitted airflow, geometry, and nature of the emission source allows the evaluation of the odor emission rate (OER), which is basically the odor flux emitted to the atmosphere, and is the parameter that effectively accounts for the amount of odor that is emitted into the atmosphere by a given source. The OER is expressed in ouE/s and is obtained as the product of the odor concentration by the air flow associated with the source. The method adopted for estimating OER depends on the source type, i.e., point, volume, or surface sources [12]. This datum can be used as input data for specific mathematical models, which combine this information together with meteorological and geographical data, and thus calculate how the emitted odor is transported through the atmosphere to the affected citizens. Over the last few years, there has been significant research investigating how to adequately estimate OER values from different source types, which are commonly considered as “complex” [13][14][15][16][17].
On the other hand, dynamic olfactometry has the disadvantage of being a discontinuous measurement method, since samples are collected at the source in a precise moment and then transported and analyzed in a laboratory. For this reason, it cannot be used to continuously monitor odor emissions continuously. Moreover, dynamic olfactometry provides only a quantitative characterization of odors and cannot be used to identify odors or discriminate different odors.
2.3. Chemical Analysis with Speciation
2.3.1. Brief Description of the Method
Chemical analysis (with speciation) of odors is an instrumental method for odor characterization that involves the complete identification and quantification of chemical compounds in an odorous sample. The most common technique proposed in the scientific literature is gas chromatography coupled with mass spectrometry (GC-MS) (Figure 3).
Figure 3. Schematization of a GC-MS (gas chromatography coupled with mass spectrometry) analysis system.
GC-MS combines the separation capability of gas chromatography (GC), based on the chemical-physical properties of the mixture constituents, with mass spectrometry (MS), which, breaking each molecule into ionized fragments, provides a unique fingerprint (mass spectrum) of the compounds detected, thereby allowing the identification of the mixture constituents.
2.3.2. Applicability and Limitations
At the emission level, GC-MS can be applied to obtain information about the chemical composition of odor emissions. Indeed, the identification and quantification of the chemical compounds that are present in odor emissions are fundamental to evaluate the impact of emitted compounds on the environment and human health. Chemical characterization also allows evaluation of the compliance of emissions with regulatory concentrations or flux limits that are fixed by the competent authorities in order to protect workers and citizens from exposure to hazardous or toxic compounds.
One way to relate the chemical composition of an odorous mixture to its odor concentration is to evaluate the so called Odor Activity Value (OAV). The OAV is defined as the sum of the ratio between the chemical concentration of each compound in the mixture and its Odor Threshold (OT) concentration:
OAV = ∑ Ci / OTi
where OAV is the odor activity value (ouE m−3); Ci is the concentration of the compound i (mg m−3); and OTi is the odor threshold of the compound i (mg∙ouE−1).
However, although GC-MS was historically the first method applied for odor characterization, chemical analysis may not always be effective in the characterization of complex odors. Indeed, this approach allows adequate estimation of the odor concentration only in the case of odorous samples containing few chemicals. Anyhow, since real samples representative od odor emissions from industrial or waste treatment activities are usually complex mixtures, their odors can hardly be related to their chemical composition, and odor concentrations calculated through OAV can be very imprecise [18]. One reason for this imprecision is the difficulty of finding reliable OT values, given that the values that are found in the literature for a single odorous compound often differ by several orders of magnitude [19][20]. Moreover, synergic or masking effects between chemicals may occur, resulting in odors completely unrelated to the chemical composition [21]. As a consequence, this approach might provide misleading results. Finally, often, VOCs, which are responsible for the odor properties of gaseous mixtures, are present at concentrations in the range of ppb or even ppt, which is lower than the instrumental detection limit. Therefore, pre-concentration techniques are commonly adopted before GC-MS. Common pre-concentration techniques include adsorption of the static headspace on active carbons followed by thermal desorption (TD), purge and trapping, and solid phase microextraction (SPME) [22][23].
2.4. Gas Chromatography-Olfactometry GC-O
2.4.1. Brief Description of the Method
Gas chromatography analysis with olfactometric detection (GC-O) couples traditional gas chromatography analysis with human olfaction to detect volatile organic compounds eluting from GC separation (Figure 4) [24]. In particular, GC-O involves a gas chromatography-mass spectrometry (GC-MS) system equipped with an olfactory detection port: At the end of the GC column, the eluted flux is divided into equal portions between the MS detector and the olfactory port. The trained panelist sniffs the gas at the olfactory port and provides a sensorial response in terms of the odor presence, odor quality, and odor intensity [25]. Various GC-O techniques have been developed to determine the relative importance of odorants in a sample. They can be classified into three categories [25]:
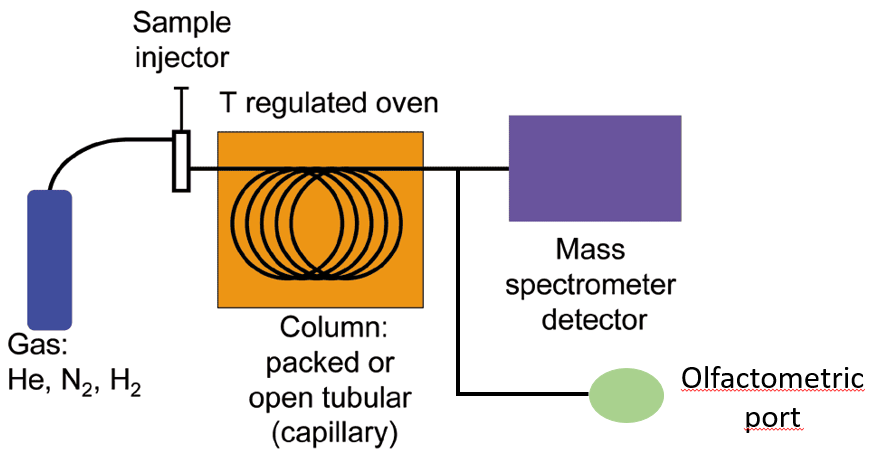
Figure 4. Gas chromatography analysis with olfactometric detection (GC-O).
-
Detection frequency: The same sample is analyzed by a panel of assessors (6–12 panelists) in order to provide the percentage of people who detect the odor compound at a given retention time. Each odor can be evaluated using the nasal impact frequency (NIF) or surface of nasal impact frequency (SNIF) values. The NIF is set at one when each of the evaluators senses a given odor and zero when no one senses any odor at a given retention time. The NIF value corresponds to the peak height of the olfactometric signal while the SNIF value represents the peak areas obtained by multiplying the frequency percentage by the duration.
-
Dilution to threshold: Dilution to threshold methods provide a quantitative description of the odor potential of a given compound based on the ratio between its concentration in the sample and its sensory threshold in air. These methods involve the preparation of a dilution series of samples, using two-fold, three-fold, five-fold, or 10-fold dilution levels and analyzing them by GC-O. The panelist indicates under which dilution the compound can still be sensed and describes the type of smell. The most common dilution methods are aroma extract dilution analysis (AEDA) and combined hedonic aroma response measurement (CharmAnalyisTM). AEDA measures the highest sample dilution at which the odor is still detectable (flavor dilution factor, FD). CharmAnalyisTM records the duration of odors and generates chromatographic peaks.
-
Direct intensity: Direct intensity methods measure the intensity and duration of odors using different types of quantitative scales: Category scales or unstructured scales. These methods include a single time-averaged measurement registered after the elution of the analyte, or a dynamic measurement, where the appearance of the odor, its maximum intensity, and the decline are recorded continuously (OSME). In the first case, the panelist assigns a value from a previously defined scale to each detected compound while in the second case, an olfactogram, which similar to conventional chromatograms, is obtained, in which the peak corresponds to the maximum intensity and width of the odor duration.
2.4.2. Applicability and Limitations
GC-O, whose applicability is limited to emissions, provides information about the odor character associated with different constituents of the odorous mixture, which allows estimation of the relative influence of single components on the total odor of the sample. In general, it is used in cases of real mixtures constituted by odorous compounds characterized by strong odors and low odor thresholds.
However, GC-O is a cost- and time-intensive method, which does not allow estimation of the odor concentration of samples, because odors present in different concentrations, all above the detection threshold, will produce aromagrams with peaks of the same intensity. Moreover, since it operates on the separation of the sample into its single components, the olfactory properties of the sample as a whole are not considered. For this reason, data from GC-O analysis cannot provide information about the odor impact, and can neither be used directly as input for dispersion modelling.
2.5. Chemical Analysis—Non-Specific
2.5.1. Brief Description of the Method
Non-specific chemical characterization can be used as a screening tool in those cases in which the odor problem is specifically related to hydrocarbon molecules. Non-specific chemical analysis involves the use of easily transportable and quite cheap tools, like FID (flame ionization detector) or PID (photo ionization detector) detectors, as screening tools to assess the total amount of hydrocarbons. Both FID and PID detectors pyrolyze the organic compounds present in the analyzed gas and provide the concentration of all ionizable chemicals present in the sample. The main difference between the two instruments is the ionization mechanism.
The flame ionization detector (FID) (Figure 5) is a burner in which a regulated flow of the gas sample passes through a flame sustained by regulated flows of a fuel gas (a hydrogen/diluent mixture) and air. Within the flame, the hydrocarbon components of the sample stream undergo a complex ionization that produces electrons and positive ions. In order to detect these ions, two electrodes are used to provide a potential difference [26].
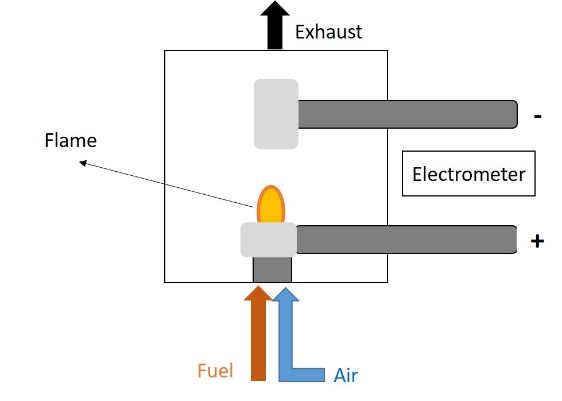
Figure 5. Flame ionization detector (FID).
The photo ionization detector (PID) uses ultraviolet light to irradiate the sample, thus ionizing it. The analysis chamber is composed of two plates between which a difference of potential is applied. Upon the production of ionized molecules, a current is created and recorded (Figure 6). The intensity of the current is a direct measure of the number of ionized molecules [27].
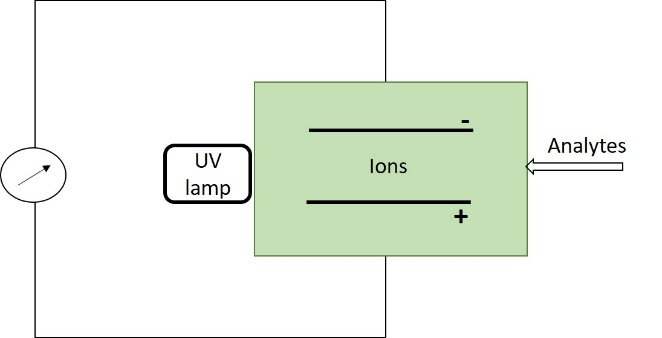
Figure 6. Photo ionization detector (PID).
The main difference between these two kinds of sensors is that the FID needs a hydrogen bottle to maintain a hydrogen flame as an energy source while the PID uses a UV lamp. Because of this different ionization mechanism, a FID is also able to detect methane, which is odorless, while a PID, which has a weaker energy source, is useful for detecting NMHCs (non-methanic hydrocarbons).
The output of these types of instruments is the total VOC concentration expressed in terms of the concentration equivalent to the calibration gas concentration.
2.5.2. Applicability and Limitations
Non-specific chemical analysis is very useful for the detection of gas leaks, which represent potential odor emissions, for example, hydrocarbon fugitive emissions from equipment or piping in refineries or landfill gas leaks from covers.
The main drawback of this method is that it does not provide any information about the odor properties of the analyzed gas. The total hydrocarbon concentration that is measured cannot be directly related to the odor concentration. Indeed, in the scientific literature, it is known that the correlation between the total VOC concentration and the odor concentration of gas samples is generally hard to estimate or nonexistent [28]. Moreover, these instruments do not take into consideration the different odor thresholds of different compounds, the response factors of the electric sensor, and the mixing effects.
2.6. Chemical Analysis—Single Gases
2.6.1. Brief Description of the Method
In those rare cases in which the odor pollution problem is due mainly to the presence of a single compound (tracer), a reliable quantification of odors can be obtained by assessing the concentration of those single gases. In environmental odor monitoring, ammonia and hydrogen sulfide are often monitored as common tracers for odorous emissions. Depending on the concentration ranges expected, different tools can be adopted for the odorous target compound quantification.
When the concentrations are quite high (1–10 ppm), electrochemical sensors, which are easy to use and cheap, can be adopted. Electrochemical sensors couple a chemically selective layer to an electrochemical transducer. This way, the chemical energy of the selective interaction between the sensor and the target compound is transduced into an analytical signal, which can be correlated to the concentration of the target compound. Those sensors are grouped according to the electrical magnitude used for transduction in potentiometric, conductimetric, impedimetric, and amperometric titration [29].
When concentrations are in the range of ppb, more complex and expensive tools for target compounds’ quantification, like a chemiluminescence analyzer for NH3 or gold leaf analyzers for H2S, are needed. The chemiluminescence analyzer for NH3 converts NH3 into NO and utilizes chemiluminescence technology for a reaction that produces a characteristic luminescence with an intensity proportional to the amount of NO. Those tools are highly reliable and are characterized by their long-term stability. Gold leaf analyzers are frequently used to monitor hydrogen sulfide traces in the gas phase. They measure the H2S concentration by monitoring the change in the resistance of a gold film sensor caused by the adsorption of H2S molecules [30]. A common gold leaf analyzer is the Jerome 631-X H2S analyzer.
2.6.2. Applicability and Limitations
Chemical analysis targeting the detection of single gases can be applied both to emissions or in ambient air. For emissions, it can be useful to verify compliance to emission limits relevant to specific compounds. When applying the analysis of single gases to ambient air, the compound to be measured should not be ubiquitous and its source must be clearly identifiable. This approach has the main advantage of being simple and relatively cheap. Moreover, in cases in which the emitted odor is directly correlated to one specific compound (tracer), the measured tracer concentration can be used to estimate the odor concentration emitted. In such cases, this datum can be used as input for dispersion modelling to evaluate the odor’s impact on communities. For this purpose, it is necessary to preliminarily assess a correlation between the compound concentration and the odor concentration [31].
On the contrary, the chemical characterization of single gases is useless in the case of complex odorous mixtures, whereby the odor concentration is not related to the concentration of one single component, but it is a mixture of hundreds of different compounds. In those cases, it may be combined with other techniques for a more comprehensive odor characterization [31][32][33].
2.7. Instrumental Odor Monitoring Systems (IOMS)
2.7.1. Brief Description of the Method
Instrumental Odour Monitoring Systems (IOMS), commonly known as electronic noses (e-noses), are instruments designed to mimic mammalian olfaction in the detection and characterization of simple or complex odors. These devices allow the characterization of mixtures of organic samples as a whole, providing their olfactory fingerprint, without recognizing the individual odor-generating compounds, as the human nose does [34][35].
To do this, the instrument must be trained: it must be provided with a database of olfactory fingerprints relating to the odors to which it may be exposed to during the analysis. That database is put together by analyzing gaseous samples with known olfactory qualities at different odor concentrations, thus defining the olfactory classes (odor types) to be recognized.
The e-nose architecture can be divided into the following three components (Figure 7) [35]:
-
Gas detection system: This is an array of n gaseous sensors, which may differ in type and operational temperature, housed into a chemically inert box, which respond to the presence of VOCs with variations of their chemical-physical properties [36][37]. The gas detection system mimics the function of human olfactory receptors.
-
Data processing unit: This system, as the human olfactory bulb, compresses the transient responses of the sensors, eliminates signal noise, and extracts features relevant for pattern recognition.
-
Classification or pattern recognition: A classification algorithm identifies odors based on a dataset that must have been previously stored. In particular, when presented with an unidentified sample, the classification assigns to it a class label by comparing its fingerprint with those compiled during the training.
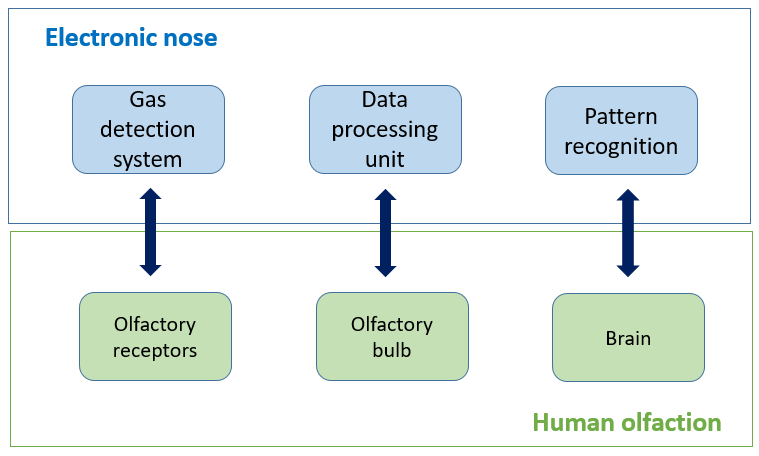
Figure 7. Electronic nose structure.
During operation, the air is continuously pulled by a vacuum pump through a tube into the chemically inert box, where the sensor array is housed. The interaction of VOCs with the sensors’ active material produces a transient response, which reaches a steady state condition in a few minutes. During this interval (i.e., response time of the sensor array), the sensor responses are recorded and delivered to the signal-processing unit.
The data processing procedure, through which the IOMS identifies an odorant sample, can be described as a sequence of the following three sequential stages [38]:
-
Signal pre-processing and feature extraction;
-
Dimensionality reduction; and
-
Classification or clustering.
Signal pre-processing compresses transient sensor responses by means of manipulation of the sensor baselines or normalization of the sensors’ response ranges for all the sensors in an array [38]. Feature extraction has the purpose of extracting the information relevant for pattern recognition from the sensor array response while the dimensionality reduction stage projects the n-dimensions of the multidimensional dataset onto a few informative and independent axes to simplify data inspection and avoid problems related to redundancy [39]. The resulting low-dimensional projection can be more readily inspected visually: Measurements are points of the discarded plot. Feature extraction can be performed with different common techniques for multivariate statistical analysis, such as principal component analysis (PCA), linear discriminant analysis (LDA), or Sammon nonlinear maps. Once the measurements have been projected, the classifier produces an estimate of the class for an unknown sample along with an estimate of the confidence placed on the class assignment, comparing its odor fingerprint with those previously compiled in the training phase. Many algorithms for the classification task based on different statistical methods have been developed during the years. In general, the k-nearest neighbors (k-NNs), support vector machine (SVM), random forest (RF), and artificial neural networks (ANNs) are most commonly adopted [37][40][41][42].
2.7.2. Applicability and Limitations
IOMS can be used both at emissions and receptors for the continuous characterization of odors [43]. In the case of emissions, an e-nose can be used to continuously monitor the efficiency of odor abatement systems. Although IOMS cannot completely substitute dynamic olfactometry in the assessment of odor concentrations because instrument training requires that the odor concentration of samples must be known, trained IOMS can provide an estimation of the odor concentrations of unknown samples, if a specific correlation between the sensor responses and dynamic olfactometry results has been assessed in the training phase [33][40]. Recent advances in pattern recognition techniques (including partial least square-discriminant analysis, artificial neural networks, Kohonen self-organizing maps, principal component analysis, and vector machine classifiers) have allowed for enhanced identification of unknown samples, with correlations in the range 80–95% to odor concentrations measured using olfactometry [44]. Therefore, specifically trained IOMS can be installed at the outlet of abatement systems to continuously monitor odor emissions, thereby providing real-time information about the function of the equipment and allowing rapid intervention in case of failures. Moreover, data collected at emission sources by IOMS can be used as input data for dispersion modelling [45][46][47]. In the case of receptor-level applications, the e-nose continuously characterizes ambient air in terms of the odor’s presence and quality in order to provide a direct assessment of the odor impact of industrial activities at the receptor. This type of analysis, in the case of multiple sources, allows identification of the sources that are most responsible for the perception of odors at receptors through the recognition of odor provenance. Electronic noses are widely used for environmental odor monitoring, since they can create continuous and fast results with a limited budget. However, IOMS cannot provide information about the intensity and hedonic tone (pleasantness) of the odor.
2.8. Field Inspection
2.8.1. Brief Description of the Method
Field inspection provides the characterization of odor exposure in a defined assessment area. It involves the use of qualified panel members in the field to directly assess the presence of recognizable odors linkable to a specific source in ambient air. Two different approaches for field inspection can be applied:
-
Grid method (EN 16841-1:2016) [6]: This uses direct assessment of ambient air by panel members to characterize odor exposure in a defined assessment area; and
-
Plume method (EN 16841-2:2016) [7]: This determines the extent of the downwind odor plume of a defined source under specific meteorological conditions.
The grid method [6] is a statistical survey method that is applied on an assessment area over a sufficiently long period of time that can be representative of the weather conditions in the area to provide a representative map of the odor exposure. The unit of measurement of the method is the frequency of odor hours for a square of evaluation, defined by four measurement points, as a representative value for exposure to odors. For each point of the grid, repeated measurements must be carried out during the monitoring time frame, so that the evaluation can be representative of all the phases of activity of the characterized source. During the analysis, the panel inhales the ambient air for 10 min and records a classification every 10 s. Each observation gives indications about the presence/absence of odor and, in the case of recognition, of the type of odor. By summing up the total number of single measurements conducted at these four measurement points, the odor hour frequency is calculated. If a particular odor type exceeds a percentage odor time of 10% (i.e., the presence of odor is detected in six or more out of 60 observations), the result is classified as an odor hour. Figure 8 reports an example of an assessment area in the surroundings of an odor emission source with assessment squares and measurement points.
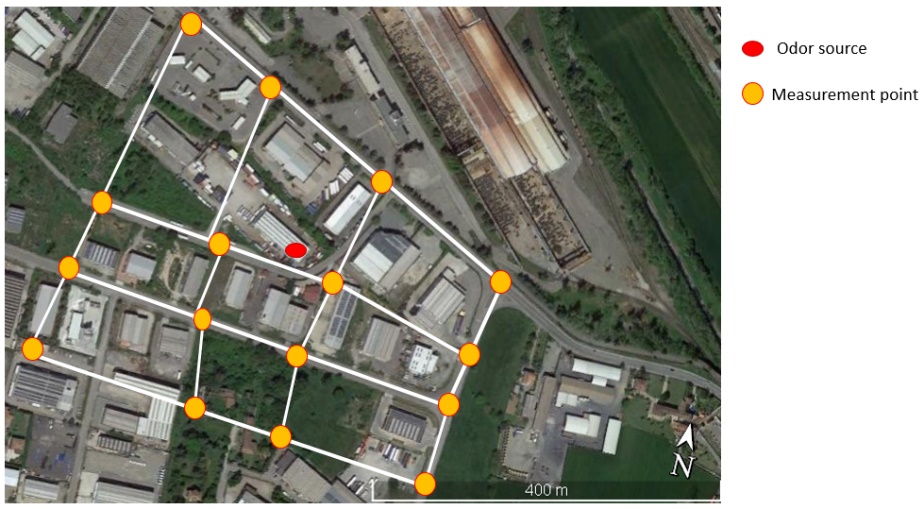
Figure 8. Example of an assessment area in the surroundings of an odor emission source with assessment squares and measurement points.
The plume method [7] is used to determine the extent of the area where the odor plume originating from a specific odor source can be perceived and recognized under specific meteorological and operating conditions. The extent of the odor plume is described by points where a transition from the absence to presence of the recognizable odor under investigation occurs. The analyses of ambient air are carried out by panel members at different points downwind to the source under well-defined meteorological conditions. The stationary plume method or dynamic plume method can be used as observation methods. Using the stationary plume method (Figure 9), the panel members are located at specific intervals along intersection lines perpendicular to the plume direction. Many panel members are located at intervals along each intersection line to cover the estimated width of the recognizable plume and carry out the analysis simultaneously. Each member determines the percentage of odor time in the course of one single measurement. If the result of a single measurement the percentage is lower than 10%, the odor is considered as being absent; otherwise, the odor is present.
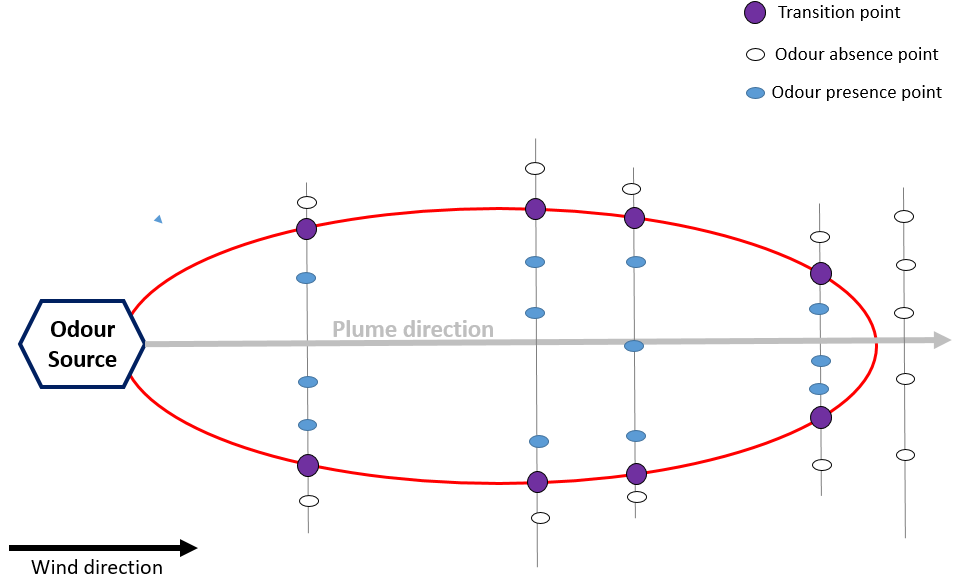
Figure 9. Stationary plume method—field inspection.
Using the dynamic plume method (Figure 10), the panel members cross the plume while conducting single measurements at frequent intervals by successively entering and exiting the plume at different distances from the emission source, including distances where no recognizable odors is detected. In this way, they determine the transition between the absence and presence of recognizable odors and the extent of the plume. The maximum plume reach estimate is defined as the distance along the plume direction between the source and the point halfway from the furthest crossing where the odor presence is recorded.
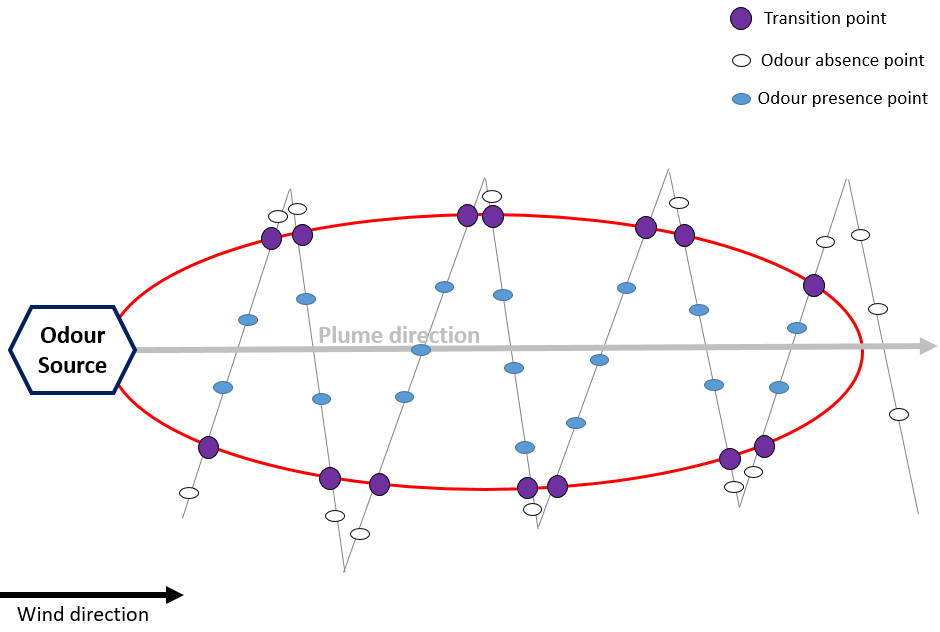
Figure 10. Stationary plume method—field inspection.
For both approaches, the plume extent is defined by transition points., i.e., points halfway between adjacent odor absence points and odor presence points. In order to avoid olfaction adaptation effects, in the dynamic method, the transition points are only determined whilst entering the plume.
2.8.2. Applicability and Limitations
Field inspection can be applied for the direct assessment of odor presence/absence, the degree of annoyance in terms of the percent of odor hours in a determined problematic area (grid method), or the extent of the odor plume from a facility under specific meteorological conditions (plume method). With suitable training, assessors carrying out field inspections may provide some information about the odor quality and recognize its provenance.
Besides this type of evaluation being time and cost intensive, the limit of this technique is that it cannot be used for the assessment of the odor concentration, only for a qualitative characterization of ambient air.
2.9. Field Olfactometry
2.9.1. Brief Description of the Method
Field olfactometry is a sensorial method adopted for the quantification of odors in ambient air by means of portable odor detecting and measuring devices known as field olfactometers. The field olfactometer dynamically dilutes ambient air with carbon-filtered air in distinct ratios known as dilutions-to-threshold dilution factors (D/Ts) [48].
The analysis is carried out by trained panelists directly in the problematic area and provides as output the dilution-to-threshold ratio, which represents the number of dilutions needed to make the odorous ambient air non-detectable.
2.9.2. Applicability and Limitations
Field olfactometry can be used to give an indication of the number of times that ambient air needs to be diluted to make it non-odorous close to an odor source. It does not provide a measure of the odor concentration in ouE/m3, which can only be measured by the reference method (i.e., dynamic olfactometry according to EN 13725:2003) at the emissions.
The high variability of the results, due to several uncontrollable factors (e.g., wind direction and speed, visual suggestions), is one of the main drawbacks of this method. Another important limitation is related to the fact that field olfactometry does not allow discrimination of the odor from the source under investigation from the background odor, as it is the case for dynamic olfactometry. As a consequence, field olfactometry provides information that is hardly compared with any other technique for odor characterization. As for other sensorial methods, the calibration of the assessors is a key element for the repeatability of results, and sniffing sticks are not suitable for this calibration.
2.10. Citizen Science
2.10.1. Brief Description of the Method
Citizen science (CS) is the practice of public participation and collaboration in scientific research to increase scientific knowledge. Through citizen science, people share and contribute to data monitoring and collection programs [49]. The application of the CS approach to monitoring odor harnesses the power of crowds, using one of the most effective odor sensors, i.e.,the human nose. Communities are actively involved in the mapping and management of odor problems. In particular, citizens are asked to compile surveys, with specific questions about the duration, frequency, intensity, and type or source of the odor that they experience.
The combination of several individual observations allows a clear picture of the odor issue to be built, and possible strategies for managing the problem evaluated, thereby allowing co-creation of local solutions together with industries, regional and local authorities, and odor experts.
2.10.2. Applicability and Limitations
When scientific standards are observed, CS allows the creation of large datasets and introduction of innovative ideas, fostering acceptance through transparent procedures and verifying practical applicability in the field. It is an effective instrument to deal with complex social issues and strengthen the research methodology. Co-creative approaches of CS include citizens at early stages of a project, enabling the definition of questions or problems to be addressed, which are relevant for the affected communities. CS often includes a wide variety of stakeholders from all areas, such as the public, policy makers, academics, industrial partners, and non-governmental organizations. Through this inclusivity, CS allows collaborations without borders and fosters good relationships between citizens, science, governments, and industries.
However, CS is a scientific method with advantages and limitations, like every other approach. The inclusion of citizens in research can be difficult since the methods require special training or strenuous work. In addition, individual accuracies can vary, depending on the difficulty of the tasks, and the subjectivity of individual observations may influence the outcome. Therefore, the final analysis and interpretation of the data/project should account for those possible elements of variation in the data collection and analysis done by citizens. Another limit related to CS is the lack of specific regulation, which stakeholders have to deal with in the definition of innovative approaches for managing odor issues.
3. Conclusions
Dynamic olfactometry is the standardized method for measuring odor concentration at emissions, which can be used to verify the compliance of odor concentration with regulatory limits, assess the efficiency of abatement system and provide information that can be used as input data for dispersion modelling in order to evaluate citizens’ exposure to odors. However, it is a discontinuous method and cannot be used at immissions. Other sensorial techniques, i.e., field inspection or GC-O, have, as dynamic olfactometry, the advantage of the higher sensitivity of human nose with respect to analytical methods. Nevertheless, they are not always applicable, may be affected by subjectivity and are time- and cost-intensive.
On the other hand, analytical approaches, based on chemical characterization, are not subjected to human errors, but are less powerful in odor quantification, especially in the case of complex mixtures. IOMS have the advantage of providing continuous and fast results with a limited budget, thereby allowing the continuous monitoring of odour abatement systems efficiency or the direct determination of the odor impact at receptors. Conversely, they cannot provide information about odour intensity and hedonic tone. Moreover, they cannot substitute dynamic olfactometry, because the odor concentration of samples must be known to train adequately the instrument.
In conclusion, it should be pointed out that, in most cases, there is not a unique answer to the question: “which is the best method for measuring odours?”. Each situation must be evaluated case-by-case, by considering the applicability and limitations of each method, and especially the specific information that each method can provide. As a matter of fact, in many situations, an integrated approach, combining different methods, is the best solution for obtaining an exhaustive and complete picture of the problem and the definition of a good strategy for problem management.
References
- Henshaw, P.; Nicell, J.; Sikdar, A. Parameters for the assessment of odour impacts on communities. Atmos. Environ. 2006, 40, 1016–1029.
- Aatamila, M.; Verkasalo, P.K.; Korhonen, M.J.; Suominen, A.L.; Hirvonen, M.R.; Viluksela, M.K.; Nevalainen, A. Odour annoyance and physical symptoms among residents living near waste treatment centres. Environ. Res. 2011, 111, 164–170.
- McGinley, A.M.; McGinley, M.C. Developing a Credible Odor Monitoring Program; American Society of Agricultural Engineers (ASAE): Ottawa, ON, Canada, 2004.
- Heroux, M.; Page, T.; Gelinas, C.; Guy, C. Evaluating odour impacts from landfilling and composting site: Involving citizens in the monitoring. Water Sci. Technol. 2004, 50, 131–137.
- Standard EN 13725:2003. Air Quality-Determination of Odour Concentration by Dynamic Olfactometry; CEN: Brussels, Belgium, 2003.
- Standard EN 16481-1:2016. Ambient Air-Determination of Odour in Ambient Air by Using Field Inspection-Part 1: Grid Method; CEN: Brussels, Belgium, 2016.
- Standard EN 16481-2:2016. Ambient Air-Determination of Odour in Ambient Air by Using Field Inspection-Part 2: Plume Method; CEN: Brussels, Belgium, 2016.
- Lee, H.D.; Jeon, S.-B.; Choi, W.J.; Lee, S.S.; Lee, M.H.; Oh, K.J. A novel assessment of odor sources using instrumental analysis combined with resident monitoring records for an industrial area in Korea. Atmos. Environ. 2013, 74, 277–290.
- Haklay, M. Chapter 4-Toward inclusive and effective citizen science. In Citizen Science and Policy: A European Perspective; Tyson, E., Bowser, A., Rejeski, D., Eds.; Woodrow Wilson International Center for Scholars: Washington, DC, USA, 2015; pp. 54–59.
- McGinley, M.A.; McGinley, C.M. Developing a credible odor monitoring program. In Proceedings of the ASAE Annual Meeting, St. Joseph, MI, USA, 1–4 August 2004.
- Tyndall, J.C.; Grudens-Schuck, N.; Harmon, J.D.; Hoff, S.J. Social approval of the community assessment model for odor dispersal: Results from a survey. Environ. Manag. 2012, 50, 315–328.
- Gutiérrez, M.C.; Martín, M.A.; Pagans, E.; Vera, L.; García-Olmo, J.; Chica, A.F. Dynamic olfactometry and GC–TOF/MS to monitor the efficiency of an industrial biofilter. Sci. Total Environ. 2015, 512–513, 572–581.
- Nicolas, J.; Craffe, F.; Romain, A.C. Estimation of odor emission rate from landfill areas using the sniffing team method. Waste Manag. 2006, 26, 1259–1269.
- Leyris, C.; Guillot, J.M.; Fanlo, J.L.; Pourtier, L. Comparison and development of dynamic flux chambers to determine odorous compound emission rates from area sources. Chemosphere 2005, 59, 415–421.
- Capelli, L.; Sironi, S.; Del Rosso, R. Odor sampling: Techniques and strategies for the estimation of odor emission rates from different source types. Sensors 2013, 13, 938–955.
- Lucernoni, F.; Capelli, L.; Sironi, S. Odour sampling on passive area sources: Principles and methods. Chem. Eng. Trans. 2016, 54.
- Sironi, S.; Capelli, L.; Del Rosso, R. Odor emissions. Reference Module in Chemistry, Molecular Sciences and Chemical Engineering; Elsevier: Amsterdam, The Netherlands, 2014.
- Audouin, V.; Bonnet, F.; Vickers, Z.M.; Reineccius, G.A. Limitations in the use of odor activity values to determine important odorants in foods. In Gas Chromatography-Olfactometry; American Chemical Society: Washington, DC, USA, 2001; Volume 782, pp. 156–171.
- Jiang, G.; Melder, D.; Keller, J.; Yuan, Z. Odor emissions from domestic wastewater: A review. Crit. Rev. Environ. Sci. Technol. 2017, 47, 1581–1611.
- Dravnieks, A.; Jarke, F. Odor threshold measurement by dynamic olfactometry: Significant operational variables. J. Air Pollut. Control 1980, 30, 1284–1289.
- Jarauta, I.; Ferreira, V.; Cacho, J.F. Synergic, additive and antagonistic effects between odorants with similar odour properties. Dev. Food Sci. 2006, 43, 205–208.
- Pojmanova, P.; Ladislavova, N.; Skerikova, V.; Kania, P.; Urban, S. Human Scent Samples for Chemical Analysis; Chemical Papper; Springer: Berlin/Heidelberg, Germany, 2019; pp. 1–11.
- Ricon, C.A.; De Guardia, A.; Couvert, A.; Le Roux, S.; Soutrel, I.; Daumoin, M.; Benoist, J.C. Chemical and odor characterization of gas emissions released during composting of solid waste digestates. J. Environ. Manag. 2019, 233, 39–53.
- Delahunty, C.M.; Eyres, G.; Dufour, J.P. Gas chromatography-olfactometry. J. Sep. Sci. 2006, 29, 2107–2125.
- Brattoli, M.; Cisternino, E.; Dambruoso, P.R.; De Gennaro, G.; Giungato, P.; Mazzone, A.; Palmisani, J.; Tutino, M. Gas chromatography analysis with olfactometric detection (GC-O) as a useful methodology for chemical characterization of odorous compounds. Sensors 2013, 13, 16759–16800.
- Chaulya, S.K.; Prasad, G.M. Chapter 3-Gas sensors for underground mines and hazardous areas. In Sensing and Monitoring Technologies for Mines and Hazardous Areas; Elsevier: Amsterdam, The Netherlands, 2016; pp. 161–212.
- Stauffer, E.; Dolan, J.A.; Newman, R. Chapter 5-Detection of ignitable liquid residues at fire scenes. In Fire Debris Analysis; Elsevier: Burlington, NJ, USA, 2008; pp. 131–161.
- Capelli, L.; Sironi, S.; Del Rosso, R.; Guillot, J.M. Measuring odours in the environment vs. Dispersion modelling: A review. Atmos. Environ. 2013, 79, 731–743.
- Antuna-Jiménez, D.; Díaz-Díaz, G.; Blanco-López, M.C.; Lobo-Castañón, M.J.; Miranda-Ordieres, A.J.; Tunon-Blanco, P. Chapter 1-Molecularly imprinted electrochemical sensors: Past, present, and future. In Molecularly Imprinted Sensors; Li, S., Ge, Y., Piletsky, S.A., Lunec, J., Eds.; Elsevier: Amsterdam, The Netherlands, 2012; pp. 1–34.
- Nabais, R. Odours in the Food Industry; Springer: New York, NY, USA, 2006.
- Roetzer, H.; Muehldorf, V.; Riesing, J. Measurement of the odor impact of a waste deposit using the SF6-tracer method (OEFZS--4733). In Proceedings of the 2nd International Symposium on Environmental Contamination in Central and Eastern Europe, Budapest, Hungary, 20–23 September 1994.
- Cangialosi, F.; Intini, G.; Colucci, D. On line monitoring of odour nuisance at a sanitary landfill for non-hazardous waste. Chem. Eng. Trans. 2018, 68, 127–132.
- Stuetz, R.M.; Fenner, R.A.; Engin, G. Assessment of odours from sewage treatment works by an electronic nose, H2S analyzer and olfactometry. Water Res. 1999, 33, 453–461.
- Ramgir, N.S. Electronic nose based on nanomaterials: Issues, challenges, and prospects. ISRN Nanomater. 2013, 2013, 21.
- Hu, W.; Wan, L.; Jian, Y.; Ren, C.; Jin, K.; Su, X.; Bai, X.; Haick, H.; Yao, M.; Wu, W. Electronic noses: From advanced materials to sensors aided with data processing. Adv. Mater. Technol. 2019, 4, 1800488.
- Lantto, V.; Rantala, T.T.; Rantala, T.S. Atomistic understanding of semiconductor gas sensors. J. Eur. Ceram. Soc. 2001, 21, 1961–1965.
- Elosua, C.; Matias, I.R.; Bariain, C.; Arregui, F.J. Volatile organic compound optical fiber sensors: A review. Sensors 2006, 6, 1440–1465.
- Aguilera, T.; Lozano, J.; Paredes, J.; Álvarez, F.; Suárez, J. Electronic nose based on independent component analysis combined with partial least squares and artificial neural networks for wine prediction. Sensors 2012, 12, 8055–8072.
- Blanes-Vidal, V.; Nadimi, E.S.; Ellermann, T.; Andersen, H.V.; Løfstrøm, P. Perceived annoyance from environmental odors and association with atmospheric ammonia levels in non-urban residential communities: A cross-sectional study. Environ. Health 2012, 11, 27.
- Zhang, L.; Tian, F.; Nie, H.; Dang, L.; Li, G.; Ye, Q.; Kadri, C. Classification of multiple indoor air contaminants by an electronic nose and a hybrid support vector machine. Sens. Actuators B Chem. 2012, 174, 114–125.
- Pardo, M.; Sberveglieri, G. Classification of electronic nose data with support vector machines. Sens. Actuators B Chem. 2005, 107, 730–737.
- Men, H.; Fu, S.; Yang, J.; Cheng, M.; Shi, Y.; Liu, J. Comparison of SVM, RF and ELM on an electronic nose for the intelligent evaluation of paraffin samples. Sensors 2018, 18, 285.
- Güney, S.; Atasoy, A. Classification of n-butanol concentrations with k-nn algorithm and ann in electronic nose. In Proceedings of the International Symposium on Innovations in Intelligent Systems and Applications (INISTA), Istanbul, Turkey, 15–18 June 2011; pp. 138–142.
- Gostelow, P.; PArson, S.A.; Stuetz, R.M. Odour measurements for sewage treatment works. Water Res. 2001, 35, 579–597.
- Capelli, L.; Sironi, S.; Del Rosso, R. Electronic noses for environmental monitoring applications. Sensors 2014, 14, 19979–20007.
- Pan, L.; Yang, S.X. An electronic nose network system for online monitoring of livestock farm odors. IEEE/ASME Trans. Mechatron. 2009, 14, 371–376.
- Adam, G.; Lemaigre, S.; Goux, X.; Delfosse, P.; Romain, A.C. electronic nose tehcnology for reactor state and biogas quality assessment in aerobic digestion. In Proceedings of the 2nd Conference on “Monitoring & Process Control of Anaerobic Digestion Plants”, Leipzig, Germany, 17–18 March 2015.
- McGinley, M.A.; McGinley, C.M. Comparison of field olfactometers in a controlled chamber using hydrogen sulfide as the test odorant. Water Sci. Technol. A J. Int. Assoc. Water Pollut. Res. 2004, 50, 75–82.
- Heigl, F.; Kieslinger, B.; Paul, K.T.; Uhlik, J.; Dörler, D. Opinion: Toward an international definition of citizen science. Proc. Natl. Acad. Sci. USA 2019, 116, 8089–8092.

