The stock index is an important indicator to measure stock market fluctuation, with a guiding role for investors’ decision-making, thus being the object of much research. However, the stock market is affected by uncertainty and volatility, making accurate prediction a challenging task.
1. Introduction
The stock index is calculated based on some representative listed stocks. To some extent, it can reflect price changes of the whole financial market, hence its use as an important indicator of the country’s future macroeconomic performance. Forecasting the stock index accurately is of paramount importance for reducing risks in decision-making, by providing some important reference information
[1]. However, owing to the complexity of the internal structure and the variability of external factors, changes of the stock market are dynamic and uncertain, and forecasting the stock index has always been a challenge. Many stock forecasting models are mostly classified as either statistical or machine learning models
[2]. Statistical models were first used to predict the stock market in finance, and have made some achievements. However, they assume a linear and stationary time series, which is inconsistent with the dynamic, non-linear characteristics of the real stock market, so they have great limitations. A deep learning model can overcome the defects of traditional statistical models in time series prediction but is easily affected by noise in some complex and dynamic financial systems, making it difficult to mine the hidden features of time series, resulting in poor learning ability and limited prediction accuracy.
Therefore, a single statistical or machine learning model cannot well predict the stock index. To overcome these limitations, a hybrid stock index forecasting model is proposed based on Complete Ensemble Empirical Mode Decomposition with Adaptive Noise (CEEMDAN)
[3]. In this model, CEEMDAN is first used to decompose the original financial time series into a series of Intrinsic Mode Functions (IMFs) and a residual term. Then, the stability of the IMFs and the residual term is characterized using the Augmented Dickey Fuller (ADF) method, the low-volatility time series are classified as linear components, and high-volatility time series are classified as non-linear components. In the final step, the Autoregressive Moving Average (ARMA) model is applied to the linear component, and Long Short-Term Memory (LSTM) is applied to the non-linear component. The final prediction result is obtained by reconstructing each prediction series. This method makes full use of ARMA in linear problems and uses LSTM to identify and abstract non-linear features, mining the movement rules of hidden components in time series and improving prediction accuracy. Hence, the proposed method is referred to as CAL (CEEMDAN-ARMA-LSTM). In the CAL model, CEEMDAN sequence decomposition can reduce the complexity of time series, and the sequences that pass the ADF stationarity test have significant linear trends.
The hybrid model combining linear and non-linear methods has great advantages in time series prediction
[4]. Ref.
[5] proposed a hybrid time-series prediction model taking the residual generated by Autoregressive Integrated Moving Average (ARIMA), combining the differences in a non-stationary time series with ARMA, as the input of LSTM for fitting. The ARIMA-LSTM model has achieved more accurate forecasting results than the individual LSTM and ARIMA models. A moving average filter was used to decompose a time series into linear and non-linear components
[6]. ARIMA and Artificial Neural Network (ANN) were used to model low- and high-volatility data, respectively. This hybrid ARIMA-ANN model can achieve good prediction results.
2. Stock Index Forecasting Model
2.1. Related Models
2.1.1. CEEMDAN
Empirical mode decomposition (EMD)
[7] can decompose time series data into subseries according to their own time scales without setting a basis function, for effective treatment of non-linear and unstable data. However, mode aliasing can occur during EMD data decomposition. Ensemble Empirical Mode Decomposition (EEMD) addresses this problem but cannot completely eliminate reconstruction error after the introduction of Gaussian white noise
[8]. In the process of decomposition, CEEMDAN adaptively adds white noise to avoid mode mixing of EMD, and addresses reconstruction error due to noise. The prediction of stock prices is affected by multiple factors and is a non-linear complex model. The components of CEEMDAN are relatively simple; hence, more accurate predictions can be obtained.
2.1.2. LSTM
As a special recurrent neural network, LSTM solves the problem of gradient disappearance and explosion in the training process of long sequences, and it has a more complex network structure. LSTM introduces a cellular state and combines forgetting, input, and output gates to discard, maintain, and update information. The output of the model is calculated by multiple functions involving some summation operations, so it is not easy to produce the problems of gradient disappearance and explosion in the process of backpropagation. LSTM has advantages in some problems related to time series, such as industrial time series prediction
[9] and text translation
[10].
2.1.3. ARMA
ARMA is a linear sequential method that predicts a future according to historical and current data. ARMA data prediction must meet the requirements of stationarity. In practice, trends and periodicity often exist in many datasets, so there is a need to remove these effects before applying such models. Removal is typically carried out by including an initial differencing stage in the model, and the model is transformed into an ARIMA model. Therefore, ARIAM can be seen as an enhanced version of ARMA. It has a wider range of applications but a certain amount of information loss.
2.2. Proposed Model
It is widely accepted that the financial market is complex and dynamic, which calls for a noise elimination or time series decomposition. For this purpose, a multi-scale decomposition method called CEEMDAN is used in the model. The decomposed components have different scales; ARMA and LSTM are used as linear and non-linear prediction modules to exploit their respective advantages. Thus, a hybrid ARMA-LSTM model for time series forecasting based on CEEMDAN is proposed, which is called CAL (CEEMDAN-ARMA-LSTM). CEEMDAN can adaptively decompose a time series, yielding a series of IMFs and residue with different characteristic scales.
3. Experimental Results
3.1. Datasets
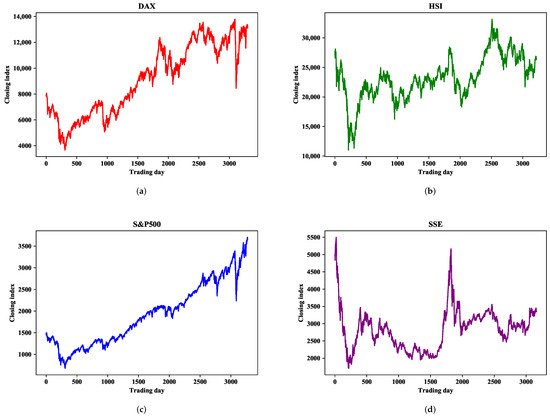
One-step-ahead prediction is used to verify the prediction accuracy of the proposed CAL model on four major global stock indices: Deutscher Aktien (DAX), Hang Seng (HSI), Standard and Poor’s 500 (S&P500), and Shanghai Stock Exchange Composite (SSE). These have strong representation in the global financial market and can reflect stock market changes, which has much research value. Stock market indices are affected by national policies, market environments, and other factors presenting different characteristics. Research on stock market indices in different financial markets can examine the prediction accuracy of the model.
The statistical analysis of each stock index is shown in Table 1, where we determine the amount of data contained in each stock market index, as well as the average, maximum, minimum, standard deviation, and ADF test results of the closing index. As can be seen from Table 1, there is a large gap between the maximum and minimum values, and a large standard deviation, indicating that these closing indices have great volatility within the research range. Moreover, the ADF test results of the DAX and S&P500 are greater than the threshold 0.05, indicating that the dataset is highly volatile and non-stationary. SSE is somewhat more stable than the other three datasets. Figure 1 shows the sequential change of the closing index within the study range, from which it can be seen that the four indices all have great volatility and instability in the short term.
Figure 1. Daily closing index series of four financial markets. (a) DAX. (b) HSI. (c) S&P500. (d) SSE.
Table 1. Descriptive statistics of closing indices.
| Index |
Count |
Mean |
Max |
Min |
Standard Deviation |
ADF Test |
| DAX |
3300 |
9118.21 |
13,789.00 |
3666.41 |
2722.52 |
0.79 |
| HSI |
3219 |
23,206.70 |
33,154.12 |
11,015.84 |
3660.60 |
0.11 |
| S&P500 |
3273 |
1915.40 |
3702.25 |
676.53 |
713.03 |
0.99 |
| SSE |
3163 |
2846.43 |
5497.90 |
1706.70 |
586.51 |
0.01 |
3.2. Decomposition Results of EMD and CEEMDAN
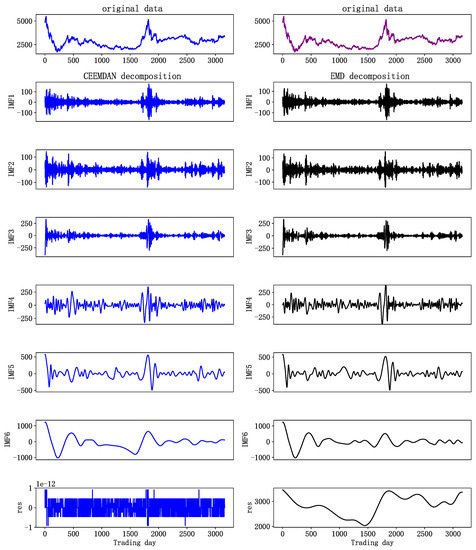
Stock indices, which contain many influencing factors, can be decomposed used EMD or CEEMDAN. Taking the SSE stock index as an example to decompose the original time series, so as to compare the two decomposition methods.
In Figure 2, the decomposing results of the original SSE index series are demonstrated. The results of sequence decomposition range from high to low frequency. The first few IMFs, with more noise, represent the high-frequency components in the original data; the middle IMFs, with reduced frequency, represent middle-frequency components; and the last few IMFs, with less volatility, which is similar to the long-term movement trend of a stock, represent the low-frequency components. The left and right sides of Figure 2 show the results of CEEMDAN and EMD data decomposition, respectively. It can be found that IMF5 and IMF6 on the right of Figure 2 have similar scales and are not easily distinguished. This is because the mode aliasing of EMD leads to the distribution of some similar time scales in different intrinsic mode functions, resulting in waveform aliasing and mutual influence. As a result, the features of a single sequence are not obvious, and feature extraction of later prediction models is more difficult. CEEMDAN data decomposition effectively solves this problem. As can be seen from the decomposition results on the left side of Figure 2, CEEMDAN decomposed the stock index into several components, from high- to low-frequency, whose characteristics are obvious, and there is no waveform aliasing.
Figure 2. SSE decomposition results.
3.3. Summary
Based on the experiment results, the observations are summarized as follows.
-
The proposed CAL model, with CEEMDAN-based methods, outperforms seven benchmark models in predictive accuracy on four stock indices from different developed stock markets, which indicates that methods with multi-scale decomposition can reduce the complexity of sequences, extract hidden features, and improve prediction accuracy.
-
CAL can obtain predictions closer to real values than CEEMDAN-LSTM, which indicates that components after decomposition may have both linear and non-linear characteristics. Therefore, models combining ARMA and LSTM can obtain more accurate predictions than individual LSTM models.
-
CAL can yield the closest prediction results in comparison to ARIMA-ANN. This indicates that the CAL model has advantages over some traditional hybrid models.
-
The prediction results show that CAL has a smaller prediction error than EMD-ARMA-LSTM does, and this indicates that the CEEMDAN method is superior to EMD in data decomposition.
-
In some volatile financial markets, a single prediction model, even improved deep learning model, has limited prediction ability because they cannot excavate internal movement rules of time series and reflect the multi-scale characteristics of financial time series.
-
The linear regression analysis shows the strong correlation between the predicted values and the real values, and the proposed prediction model is effective.
4. Conclusions and Discussion
Stock market index prediction plays an important role in reflecting overall stock market trends and has strong practical investment value. The entry proposed a hybrid stock index prediction model based on CEEMDAN and ARMA-LSTM. It takes the strengths of CEEMDAN in data decomposition, combines linear and non-linear models, and can well model complex time series. To verify the effectiveness of the prediction model, CAL was used to forecast the closing index of four stock markets, and seven control experiments were conducted for comparison. The results show that CAL can achieve the highest prediction accuracy. To optimize the model, future research can be conducted from the following aspects.
-
Single data source analysis has certain limitations. Combined analysis with different data sources, such as text information
[11], can improve prediction to a certain extent.
-
Stock market data contain noise that affects forecast results. Methods, such as wavelet denoising
[12] and principal component analysis
[13], can eliminate the influence of irrelevant factors and improve the prediction effect to a certain extent.
-
Time series analysis has been applied in fields, such as natural science
[14] and industrial time series prediction
[15]. The application scope of the temporal sequence model in this entry can be extended, especially in some complicated temporal sequence scenes.
 +1 credit