Your browser does not fully support modern features. Please upgrade for a smoother experience.

Submitted Successfully!
Thank you for your contribution! You can also upload a video entry or images related to this topic.
For video creation, please contact our Academic Video Service.
| Version | Summary | Created by | Modification | Content Size | Created at | Operation |
|---|---|---|---|---|---|---|
| 1 | Elena Bogdanova | + 1854 word(s) | 1854 | 2022-01-24 07:26:08 | | | |
| 2 | Vivi Li | + 93 word(s) | 1947 | 2022-01-28 03:21:07 | | |
Video Upload Options
We provide professional Academic Video Service to translate complex research into visually appealing presentations. Would you like to try it?
Cite
If you have any further questions, please contact Encyclopedia Editorial Office.
Bogdanova, E. Microelement Composition of Reindeer Meat and Adaptation. Encyclopedia. Available online: https://encyclopedia.pub/entry/18927 (accessed on 07 February 2026).
Bogdanova E. Microelement Composition of Reindeer Meat and Adaptation. Encyclopedia. Available at: https://encyclopedia.pub/entry/18927. Accessed February 07, 2026.
Bogdanova, Elena. "Microelement Composition of Reindeer Meat and Adaptation" Encyclopedia, https://encyclopedia.pub/entry/18927 (accessed February 07, 2026).
Bogdanova, E. (2022, January 27). Microelement Composition of Reindeer Meat and Adaptation. In Encyclopedia. https://encyclopedia.pub/entry/18927
Bogdanova, Elena. "Microelement Composition of Reindeer Meat and Adaptation." Encyclopedia. Web. 27 January, 2022.
Copy Citation
The unique nutrition of the Arctic Indigenous Peoples is associated with their increased endurance, health, and adaptability to the harsh climate. Reindeer meat, blood, and liver are the most critical elements of this traditional nutrition enriched with minerals. Reindeer consumption is a crucial factor of successful adaptation to the cold stress, as well as a component of national culture, food, and economic security and sovereignty, affecting the well-being and health of the Indigenous population in the Arctic.
reindeer meat
macro- and microelement analysis
adaptation
Arctic population
meta-analysis
1. Introduction
The unique nutrition of the Arctic Indigenous Peoples is associated with their increased endurance, health, and adaptability to the harsh climate [1]. Reindeer meat, blood, and liver are the most critical elements of this traditional nutrition enriched with minerals [2][3]. Reindeer consumption is a crucial factor of successful adaptation to the cold stress, as well as a component of national culture, food, and economic security and sovereignty, affecting the well-being and health of the Indigenous population in the Arctic [4][5][6][7][8][9].
The reindeer (Rangifer tarandus) habitat covers territories in Eurasia and North America between 50- and 81-degrees north latitude [10] and includes continental and island territories, tundra, taiga, and mountainous areas close to them in vegetation composition and climatic conditions [11]. Reindeer live in Russia, the USA, Norway, Sweden, Finland, Denmark, Iceland, Canada, Mongolia, Great Britain, and China [10]. The largest populations of wild reindeer (Rangifer tarandus caribou) are in Russia (952.9 thousand; 2015) and Canada (1300 thousand; 2016) [11]. The world’s largest livestock of domesticated reindeer is in Russia (1620.8 thousand reindeer in 2021) [12]. In Russia, the largest population of wild reindeer is in the Krasnoyarsky Krai, the Chukotka Autonomous Okrug, the Republic of Sakha (Yakutia), and domesticated reindeer are in the Yamal-Nenets Autonomous Okrug [13]. Such various reindeer habitats make pre-conditions for the different chemical compositions of reindeer products in different northern regions.
The macro- and microelement composition of reindeer meat is impacted by significant differences in the species and mineral composition of forages (plants and lichens), the duration of grazing seasons on winter and summer pastures, the proportion in the diet of green fodder, shrubs, lichens, mushrooms, eggs of birds, and rodents, the macro- and microelement composition of soil and water, pollution, availability of salty seawater, and the cutting of velvet antlers [14][15]. A specific feature of the northern reindeer is its seasonal migration to areas with different forage resources: Summer pastures with a predominance of herbaceous plants and shrubs and winter pastures rich in lichens [16].
The study of the macro- and microelement composition of reindeer meat started in the second half of the 20th century. In the 1970s, in Canada, O. Schaefer (1977) and K. Hoppner (1978) confirmed the high nutritional value of reindeer meat due to high protein and low fat content [17][18]. Two decades later, H.V. Kuhnlein (1992; 1996; 2000; 2002) conducted a study of micronutrient composition of reindeer products [19][20][21][22] and developed recommendations for the use of venison by patients with atherosclerosis, vitamin deficiency, diabetes mellitus, and for the prevention of heart, liver, and stomach diseases [23][24][25]. In the 1990s, in Alaska, the USA, the chemical composition of traditional products, including venison, was studied [26]. Currently, a national database includes the data on the complete quantitative and qualitative chemical composition of reindeer meat in Alaska [27]. In Russia, studies conducted in Yamal-Nenets Autonomous Okrug [28][29], Nenets Autonomous Okrug [30][31][32], Taimyr [33][34][35], the Republic of Yakutia [36], and on the Kola Peninsula [37][38][39] confirmed the nutritional and biological value of reindeer meat. Furthermore, they proved the need to include this product in a healthy diet.
Rangifer tarandus is highly adapted to Arctic conditions. The optimal work of enzymes that ensure adaptation to cold stress provides the accumulation of essential trace elements necessary for the practical work of enzymatic chains. The most crucial macronutrients are calcium (Ca), magnesium (Mg), phosphorus (P), potassium (K), and sodium (Na), among others, which activate enzymes, regulate the number of hormones, promote muscle and nervous activity, and therefore are essential components of the daily human diet [40][41][42]. Thus, the consumption of reindeer meat can increase adaptation to the Arctic conditions, reduce the risk of heart diseases, and improve metabolism [43][44][45].
Improving knowledge about the macro- and microelement composition of reindeer meat in different northern regions will contribute to the expansion of the use of reindeer products to prevent diseases and increase the adaptation of the Arctic population and shift workers in the circumpolar area, as well as develop effective medicinal and pharmaceutical products. Furthermore, studying the chemical composition of reindeer meat will also increase the value of exported reindeer meat, which is an important factor in promoting the economic sovereignty and well-being of the Indigenous Peoples in the Arctic.
2. Macro- and Microelement Composition in Reindeer Meat: Heterogeneity Analysis
2.1. Magnesium
The iron content in reindeer meat was available in 11 studies. The standardised mean differences ranged from 2.9107 to 11.0987; most ratings were positive (100%). The estimated standardised mean difference based on a random-effects model was 5.3972 (95% CI: 3.7340–7.0604). Thus, the mean value was significantly different from zero (z = 6.3602, p < 0.0001) (Table 1, Figure 1).
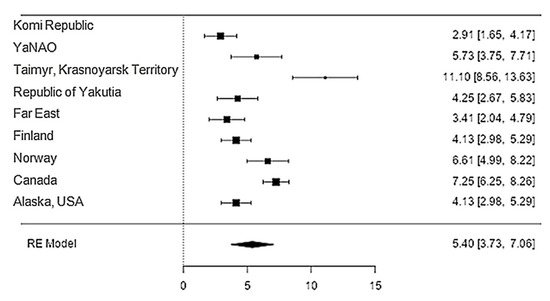
Figure 1. Forest plot of the comparison of the content of magnesium in reindeer (Rangifer tarandus) meat by geographical regions.
Table 1. The content of macro- and microelements in reindeer (Rangifer tarandus) meat: Heterogeneity analysis.
| Macro- and Microelements |
Random-Effects Model, k | Estimate * | se | Z | p | CI Lower | CI Upper |
| Magnesium | 9 | 5.40 | 0.849 | 6.36 | <0.001 | 3.734 | 7.060 |
| Iron | 9 | 5.83 | 1.31 | 4.43 | <0.001 | 3.250 | 8.404 |
| Zinc | 9 | 0.51 | 0.149 | 3.45 | <0.001 | 0.22 | 0.804 |
| Calcium | 9 | −2.12 | 2.45 | −0.867 | 0.386 | −6.918 | 2.674 |
| Potassium | 10 | 24.3 | 25.4 | 0.96 | 0.34 | −25.45 | 73.99 |
| Sodium | 9 | 24.1 | 23.7 | 1.02 | 0.31 | −22.31 | 70.5 |
| Phosphorus | 9 | 14.5 | 19.0 | 0.76 | 0.45 | −22.7 | 51.7 |
| Heterogeneity Statistics | |||||||
| Macro- and Microelements |
Tau | Tau² | I² | H² | df | Q | p |
| Magnesium | 2.419 | 5.8524 (SE = 3.259) |
92.17% | 12.776 | 8.000 | 66.719 | <0.001 |
| Iron | 3.832 | 14.686 (SE = 7.81) |
97.04% | 33.77 | 8.000 | 269.34 | <0.001 |
| Zinc | 0.44 | 0.194 (SE = 0.0995) |
97.67% | 42.98 | 8.000 | 429.42 | <0.001 |
| Calcium | 7.292 | 53.1782 (SE = 26.9478) |
99.3% | 142.905 | 8.000 | 488.351 | <0.001 |
| Potassium | 79.87 | 6378.95 (SE = 3034.51) |
99.44% | 178.16 | 9.000 | 1970.58 | <0.001 |
| Sodium | 71.00 | 5041.41 (SE = 2522.57) |
99.94% | 1779.06 | 8.000 | 8955.84 | <0.001 |
| Phosphorus | 56.8 | 3227.16 (SE = 1621.7) |
99.54% | 216.18 | 8.000 | 2146.4 | <0.001 |
* Note. Tau² Estimator: Hedges.
The Q-test confirmed the heterogeneity of the sources, including the data on the content of magnesium in reindeer (Rangifer tarandus) meat (Q(8) = 66.72, p < 0.0001, tau2 = 5.85, I2 = 92.17%). The 95% interval was from 0.37 to 10.42. Publication bias was explored with a visual inspection of the funnel plot (Figure 2, where the regression test showed asymmetry in the funnel plot (p = 0.026), but not the rank correlation test (p = 0.3429) (Table 2).
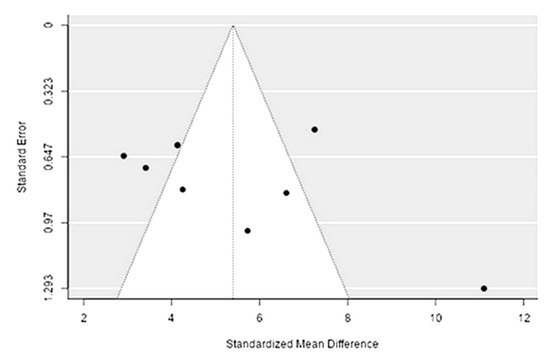
Figure 2. Funnel plot for publication bias evaluation of magnesium content in reindeer (Rangifer tarandus) meat by geographical regions.
Table 2. The statistical analysis of publication bias of the included sources with the data on macro- and microelements content in reindeer (Rangifer tarandus) meat *.
| Macro- and Microelements |
Test | |||
|---|---|---|---|---|
| Fail-Safe N | Egger’s Regression | |||
| Value | p | Value | p | |
| Magnesium | 1559.000 | <0 .001 | 2.221 | 0.026 |
| Iron | 1284.000 | <0 .001 | 3.33 | 0.001 |
| Zinc | 1689.000 | <0 .001 | −0.099 | 0.921 |
| Calcium | 226.0 | <0 .001 | −0.14 | 0.89 |
| Potassium | 735.0 | <0 .001 | −0.14 | 0.89 |
| Sodium | 735.0 | <0 .001 | −0.14 | 0.89 |
| Phosphorus | 225.0 | <0 .001 | 1.3 | 0.19 |
* Fault-tolerant calculation of N using Rosenthal’s approach.
2.2. Iron
The iron content in reindeer meat was available in 11 studies. The standardised mean differences ranged from 0.32 to 11.56, and most ratings were positive (100%). The estimated standardised mean difference was 5.83 (95% CI: 3.25–8.4) based on a random-effects model. Thus, the mean value was significantly different from zero (z = 4.43, p < 0.0001) (Table 1, Figure 3).
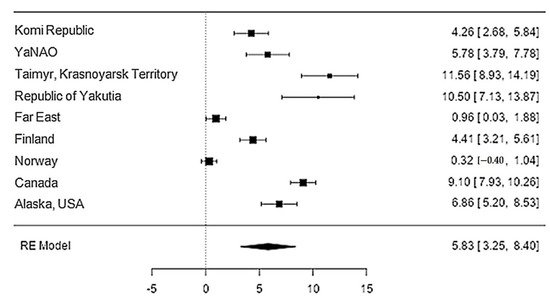
Figure 3. Forest plot of the sources, including the data on the iron content in reindeer (Rangifer tarandus) meat in different geographical regions.
The Q-test confirmed the heterogeneity of the sources, including the data on the content of iron in reindeer (Rangifer tarandus) meat (Q(8) = 269.34, p < 0.0001, tau2 = 14.69, I2 = 97.04%). The 95% interval was from −2.11 to 13.77. Publication bias was explored with a visual inspection of the funnel plot (Figure 4), where the regression test showed asymmetry in the funnel plot (p = 0.0009), but not the rank correlation test (p = 0.12) (Table 2).
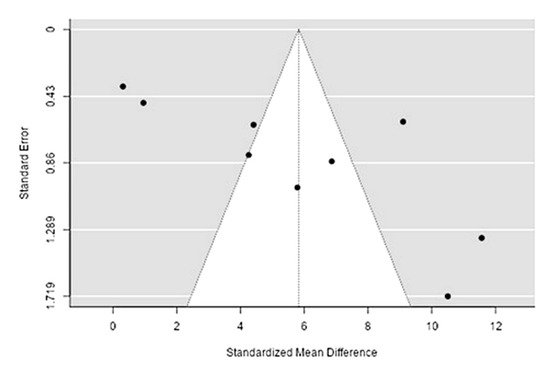
Figure 4. Funnel plot of the sources, including the data on the content of iron in reindeer (Rangifer tarandus) meat in different geographical regions.
2.3. Zinc
Data on the content of zinc in reindeer meat were available in 11 studies. The standardised mean differences ranged from −0.05 to 1.52, with most ratings being positive (89%). The estimated standardised mean difference based on a random-effects model was 0.51 (95% CI: 0.22–0.80). Thus, the mean value was significantly different from zero (z = 3.45, p < 0.0006) (Table 1, Figure 5).
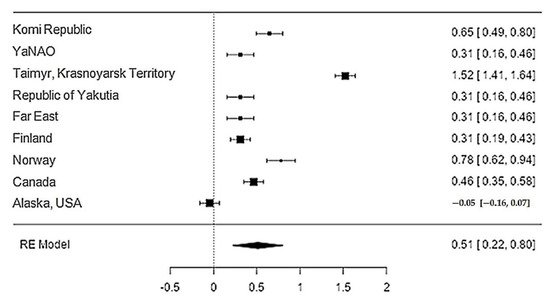
Figure 5. Forest plot of the sources, including the data on the content of zinc in reindeer (Rangifer tarandus) meat in different geographical regions.
The Q-test confirmed the heterogeneity of the sources, including the data on the content of zinc in reindeer (Rangifer tarandus) meat (Q(8) = 429.42, p < 0.0001, tau2 = 0.194, I2 = 97.67%). The 95% interval was from −0.399 to 1.42. Publication bias was explored with a visual inspection of the funnel plot (Figure 6), where the rank correlation and regression tests were p = 0.45 and p = 0.92, respectively (Table 2).
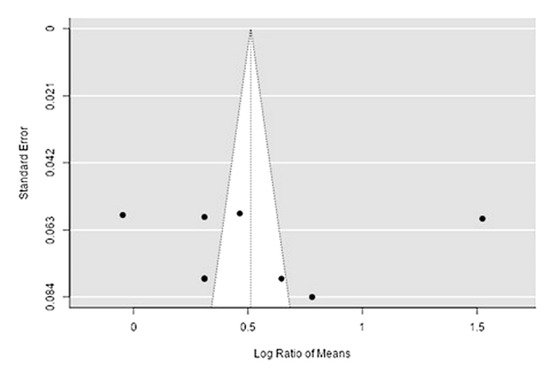
Figure 6. Funnel plot of the sources, including the data on the content of zinc in reindeer (Rangifer tarandus) meat in different geographical regions.
2.4. Calcium
Data on calcium content in reindeer meat were available in 11 studies. The standardised mean differences ranged from −14.9 to 7.2, with most ratings being negative (56%). The estimated standardised mean difference was −2.1 (95% CI: −6.92–2.67) based on a random-effects model. Thus, the mean value was significantly different from zero (z = −0.87, p = 0.39) (Table 1, Figure 7).
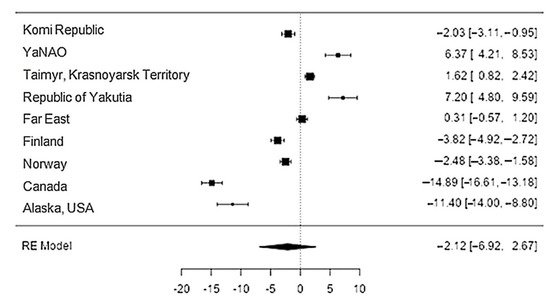
Figure 7. The forest plot of the sources includes the data on the calcium content in reindeer (Rangifer tarandus) meat in different geographical regions.
The Q-test confirmed the heterogeneity of the sources, including the data on the content of calcium in reindeer (Rangifer tarandus) meat (Q(8) = 488.35, p < 0.0001, tau2 = 53.18, I2 = 99.3%). The 95% interval was from −17.2 to 12.96. Publication bias was explored with a visual inspection of the funnel plot (Figure 8), where the rank correlation and regression test did not reveal any asymmetry in the funnel plot (p = 0.26 and p = 0.89, respectively) (Table 2).
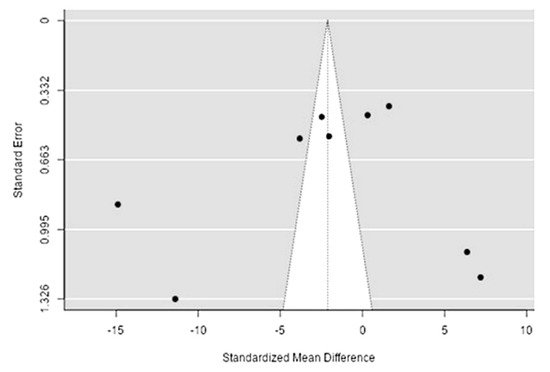
Figure 8. The funnel plot of the sources includes the data on the calcium content in reindeer (Rangifer tarandus) meat in different geographical regions.
2.5. Potassium
Data on potassium content in reindeer meat were available in 11 studies. The standardised mean differences ranged from −25.45 to 73.99, with most ratings being negative (70%). The estimated standardised mean difference was 24.3 (95% CI: −25.45–73.99) based on a random-effects model. Thus, the mean value was significantly different from zero (z = 0.96, p = 0.34) (Table 1, Figure 9).
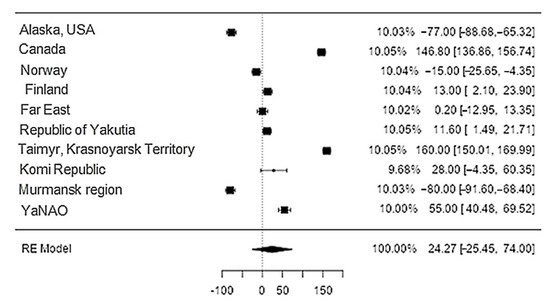
Figure 9. Forest plot of the sources, including the data on potassium content in reindeer (Rangifer tarandus) meat in different geographical regions.
The Q-test confirmed the heterogeneity of the sources, including the data on the content of potassium in reindeer (Rangifer tarandus) meat (Q(9) = 1970.58, p < 0.0001, tau2 = 6378.65, I2 = 99.44%). The 95% interval was from −164.4 to 161.95. Publication bias was explored with a visual inspection of the funnel plot (Figure 10), where the rank correlation and regression tests were p = 0.48 and p = 0.88, respectively (Table 2).
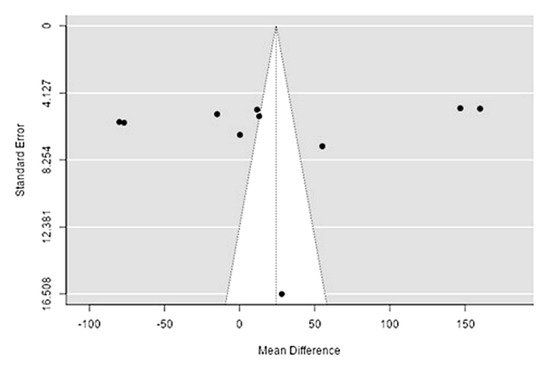
Figure 10. Funnel plot of the sources, including the data on potassium content in reindeer (Rangifer tarandus) meat in different geographical regions.
2.6. Sodium
Data on the content of sodium in reindeer meat were available in 11 studies. The standardised mean differences ranged from −27.7 to 198.6, with most ratings being negative (44%). The estimated standardised mean difference was 24.1 (95% CI: 22.31–70.5) based on a random-effects model. Thus, the mean value was significantly different from zero (z = 1.02, p = 0.31) (Table 1, Figure 11).
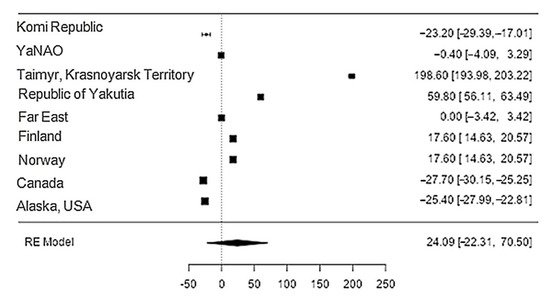
Figure 11. Forest plot of the sources, including the data on sodium content in reindeer (Rangifer tarandus) meat in different geographical regions.
The Q-test confirmed the heterogeneity of the sources, including the data on the content of sodium in reindeer (Rangifer tarandus) meat (Q(8) = 8955.85, p < 0.0001, tau2 = 5041.41, I2 = 99.94%). The 95% interval was from −122.6 to 170.8. Publication bias was explored with a visual inspection of the funnel plot (Figure 12), where the rank correlation and regression tests were p = 0.14 and p = 0.46, respectively (Table 2).
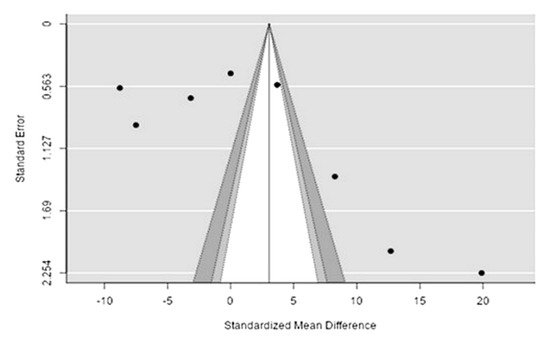
Figure 12. Funnel plot of the sources, including the data on sodium content in reindeer (Rangifer tarandus) meat in different geographical regions.
2.7. Phosphorus
The data on phosphorus content in reindeer meat was available in 11 studies. The standardised mean differences ranged from −27.7 to 198.6, with most ratings being positive (78%). The estimated standardised mean difference was 14.5 (95% CI: −22.7 to 51.7) based on a random-effects model. Thus, the mean value was significantly different from zero (z = 0.763, p = 0.45) (Table 1, Figure 13).
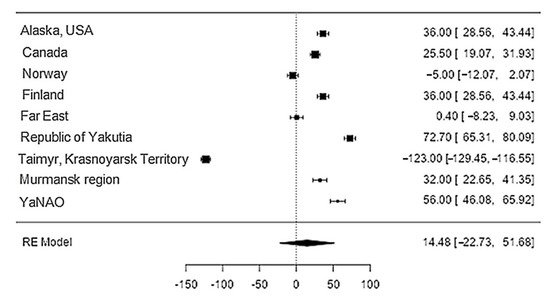
Figure 13. Forest plot of the sources, including the data on phosphorus content in reindeer (Rangifer tarandus) meat in different geographical regions.
The Q-test confirmed the heterogeneity of the sources, including the data on the content of phosphorus in reindeer (Rangifer tarandus) meat (Q(8) = 2146.4, p < 0.0001, tau2 = 3227.16, I2 = 99.54%). The 95% interval was from −102.9 to 131.9. Publication bias was explored with a visual inspection of the funnel plot (Figure 14), which did not present significant asymmetry: The rank correlation and regression tests were p = 0.34 and p = 0.19, respectively (Table 2).
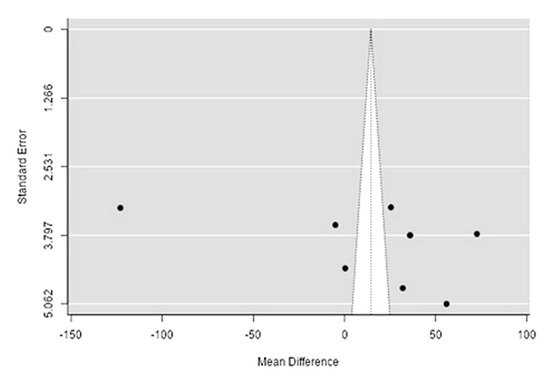
Figure 14. Funnel plot of the sources, including the data on phosphorus content in reindeer (Rangifer tarandus) meat in different geographical regions.
References
- Atsusi, Y. Kul’tura Pitaniya Gydanskih Nencev: (Interpretaciya i Social’naya Adaptaciya) ; Russian Academy of Sciences: Moscow, Russia, 1997; 252p.
- Inerbaeva, A.T. Ocenka kachestva i bezopasnosti oleniny i myasnyh izdelij na ee osnove . Sib. Her. Agric. Sci. 2018, 48, 80–86.
- Semenova, A.A.; Derevickaya, O.K.; Dydykin, A.S.; Aslanova, M.A.; Vostrikova, N.L.; Ivankin, A.N. Harakternye osobennosti nutrientnogo sostava vorkutinskoj oleniny, obuslovlennye usloviyami regiona proiskhozhdeniya . Probl. Nutr. 2019, 88, 72–79.
- Kozlov, A.I. Pishcha Lyudej ; Vek 2: Fryazino, Russia, 2005; 272p.
- Moldanova, T.A. Pishcha kak element etnicheskoj identichnosti i mezhkul’turnogo vzaimodejstviya . Bull. Ugric Stud. 2017, 7, 131–143.
- Andronov, S.V.; Bogdanova, E.N.; Lobanov, A.A.; Voronenko, A.G.; Gritsenko, V.N.; Detter, G.P.; Kobelkova, I.V.; Kochkin, R.A.; Lobanova, L.P.; Popov, A.I.; et al. Food Security of the Indigenous Peoples of the Arctic Zone of Western Siberia in the Context of Globalization and Climate Change; Publishing House KIRA: Arkhangelsk, Russia, 2020; 374p.
- Andronov, S.; Lobanov, A.; Popov, A.; Luo, Y.; Shaduyko, O.; Fesyun, A.; Lobanova, L.; Bogdanova, E.; Kobel’Kova, I. Changing diets and traditional lifestyle of Siberian Arctic Indigenous Peoples and effects on health and well-being. Ambio 2020, 50, 1–12.
- Bogdanova, E.; Lobanov, A.; Andronov, S.; Popov, A.; Kochkin, R.; Morell, I.A. Traditional nutrition of Indigenous peoples in the Arctic zone of Western Siberia. Challenges and impact on food security and health. In Food Security in the High North Contemporary Challenges Across the Circumpolar Region; Taylor & Francis Group Series; Routledge Research in Polar Regions: London, UK, 2020.
- Bogdanova, E.; Andronov, S.; Morell, I.A.; Hossain, K.; Raheem, D.; Filant, P.; Lobanov, A. Food Sovereignty of the Indigenous Peoples in the Arctic Zone of Western Siberia: Response to COVID-19 Pandemic. Int. J. Environ. Res. Public Health 2020, 17, 7570.
- Pavlinov, I.Y.A.; Lisovskij, A.A. Mlekopitayushchie Rossii: Sistematiko-Geograficheskij Spravochnik ; Tovarishchestvo nauchnyh izdanij KMK: Moscow, Russia, 2012; 604p.
- Gunn, A. Rangifer tarandus. In The IUCN Red List of Threatened Species; E.T29742A22167140; 2016; Available online: https://www.iucnredlist.org/species/29742/22167140 (accessed on 10 March 2021).
- Rosstat. Bulletin “Pogolov’e Skota v Rossijskoj Federacii v 2020 Godu” ; ROSSTAT: Moscow, Russia, 2021; p. 8.
- Ohrana Okruzhayushchej Sredy v Rossii ; ROSSTAT: Moscow, Russia, 2016; 95p.
- Lajshev, K.A.; Yuzhakov, A.A.; Muhachev, A.D. Vliyanie razlichnyh faktorov na himicheskij sostav i kalorijnost’ myasa domashnih severnyh olenej . Actual Quest. Vet. Biol. 2021, 3, 62–67.
- Kushnir, A.V.; Yuzhakov, A.A.; Zakrevskij, S.R.; Polukeev, S.M. Biohimicheskij polimorfizm po koncentracii kaliya v krovi severnyh olenej neneckoj aborigennoj porody . Sib. Her. Agric. Sci. 2007, 6, 51–58.
- Ophof, A.A.; Oldeboer, K.W.; Kumpula, J. Intake and chemical composition of winter and spring forage plants consumed by semi-domesticated reindeer (Rangifer tarandus) in Northern Finland. Anim. Feed. Sci. Technol. 2013, 185, 190–195.
- Schaefer, O. Changing Dietary patterns in the Canadian North: Health, social and economic consequences. J. Can. Diet. Assoc. 1977, 38, 17–25.
- Hoppner, K.; McLaughlan, J.M.; Shah, B.G.; Thompson, J.N.; Beare-Rogers, J.; Ellestad-Sayed, J.; Schaefer, O. Nutrient levels of some foods of Eskimos from Arctic Bay, N.W.T., Canada. J. Am. Diet. Assoc. 1978, 73, 257–261.
- Kuhnlein, H.V.; Soueida, R. Use and nutrient composition of traditional Baffin Inuit foods. J. Food Compos. Anal. 1992, 5, 112–126.
- Kuhnlein, H.V.; Soueida, R.; Receveur, O. Dietary nutrient profiles of Canadian Baffin Island Inuit differ by food source, season and age. J. Am. Diet. Assoc. 1996, 96, 155–162.
- Kuhnlein, H.V.; Receveur, O.; Chan, H.M.; Loring, E. Assessment of Dietary Benefit/Risk in Inuit Communities; Technical report; Centre for Indigenous Peoples’ Nutrition and Environment (CINE), McGill: Quebec City, QC, Canada, 2000; 458p, ISBN 0-7717-0558-1. Available online: https://www.mcgill.ca/cine/files/cine/assessment_of_dietary_benefit_risk_in_inuit_communities.pdf (accessed on 10 March 2021).
- Kuhnlein, H.V.; Chan, H.M.; Leggee, D.; Barthet, V. Macronutrient, mineral and fatty acid composition of Canadian Arctic traditional food. J. Food Compos. Anal. 2002, 15, 545–566.
- Kuhnlein, H.V.; Receveur, O.; Soueida, R.; Egeland, G.M. Arctic Indigenous Peoples experience the nutrition transition with changing dietary patterns and obesity. J. Nutr. 2004, 134, 1447–1453.
- Kuhnlein, H.V.; Barthet, V.; Farren, A.; Falahi, E.; Leggee, D.; Receveur, O.; Berti, P. Vitamins A, D, and E in Canadian Arctic traditional food and adult diets. J. Food Compos. Anal. 2006, 19, 495–506.
- Kuhnlein, H.V.; Erasmus, B.; Spigelski, D. Indigenous Peoples’ Food Systems: The Many Dimensions of Culture, Diversity and Environment for Nutrition and Health; United Nations Food and Agriculture Organization: Rome, Italy, 2009; 337p, ISBN 978-92-5-106071-1. Available online: http://www.fao.org/3/a-i0370e.pdf (accessed on 10 March 2021).
- Nobmann, E. Nutrient Value of Alaska Native Foods; U.S. Department of Health and Human Services, Indian Health Service, Alaska Area Native Health Service: Anchorage, AK, USA, 1993.
- USDA Nutrient Database for Standard Reference, Legacy Release 22; Ag Data Commons, U.S. Department of Agriculture: Beltsville, MD, USA, 2009. Available online: https://data.nal.usda.gov/dataset/usda-national-nutrient-database-standard-reference-legacy-release (accessed on 10 March 2021).
- Lobanov, A.A.; Lobanova, L.P.; Popov, A.I.; Andronov, S.V.; Kochkin, R.A.; Kostritsyn, V.V.; Protasova, I.V. The Composition for the Preparation of Crackers, Food Additive for It and the Method of Its Preparation. Patent RU 2690451 C1, 3 June 2019.
- Andronov, S.; Lobanov, A.; Popov, A.; Lobanova, L.; Kochkin, R.; Bogdanova, E.; Protasova, I. The impact of traditional nutrition on reduction of the chronic nonobstructive bronchitis risk in the indigenous peoples living in tundra of the Arctic zone in Western Siberia, Russia. Eur. Respir. J. 2018, 52, PA796.
- Romanenko, T.M. Struktura raciona severnyh olenej v ekologicheskih usloviyah vypasa bol’shezemel’skoj tundry Neneckogo avtonomnogo okruga . In Global’nye Problemy Arktiki i Antarktiki; FITS RAN: Arkhangelsk, Russia, 2020; pp. 1111–1113.
- Ilyina, L.A.; Filippova, V.A.; Laishev, K.A.; Yildirim, E.A.; Dunyashev, T.P.; Brazhnik, E.A.; Dubrovin, A.V.; Sobolev, D.V.; Tyurina, D.G.; Novikova, N.I.; et al. Sezonnye izmeneniya mikro-bioma rubca u severnogo olenya (rangifer tarandus) v usloviyah rossijskoj Arktiki . Agric. Biol. 2020, 55, 697–713.
- Ilyina, L.A.; Laishev, K.A.; Yildirim, E.A.; Filippova, V.A.; Dunyashev, T.P.; Dubrovin, A.V.; Sobolev, D.V.; Novikova, N.I.; Laptev, G.Y.; Yuzhakov, A.A.; et al. Mesto obitaniya kak opredelyayushchij faktor formirovaniya mikrobioma rubca u severnyh olenej v Arkticheskoj Rossii . Agric. Biol. 2019, 54, 1177–1187.
- Kim, Y.M. O biologicheskoj cennosti myasa severnogo olenya v zavisimosti ot vremeni goda . Bull. Sci. Tech. Inf. Res. Inst. High North 1972, 2, 5–7.
- Kim, Y.M. Himicheskij Sostav i Pishchevaya Cennost’ Myasa Domashnih Severnyh Olenej ; Moscow Veterinary Academy named after K.I.Skryabin: Moscow, Russia, 1973; 23p.
- Kim, Y.M. Kolichestvennyj i kachestvennyj sostav svobodnyh aminokislot myshechnoj tkani severnyh olenej v zavisimosti ot vremeni goda . Bull. Sci. Tech. Inf. Res. Inst. High North 1974, 2–4, 17–19.
- Kondrat, A.M. Soderzhanie Makro- (Ca, P, Mg, Na, K) i Mikroelementov (Fe, Cu, Mn, Co) v Tkanyah, Organah Domashnih Olenej i Pastbishchnyh Rasteniyah Severo-Vostochnogo Zabajkal’ya ; All-Union Academy of Agricultural Sciences Sciences named after V. I. Lenin: Borovsk, Russia, 1975; 16p.
- Bogdan, E.G.; Turshuk, E.G. Harakteristika oleniny. Issledovanie vitaminnogo i zhirno-kislotnogo sostava myasa odomashnennogo severnogo olenya . Bull. MSTU 2016, 19, 842–847.
- Bogdan, E.G.; Turshuk, E.G. Sposob Proizvodstva Marinovannyh Melkokuskovyh Myasnyh Polufabrikatov . Patent of the Russian Federation RU2649641C1, 4 April 2018.
- Bogdan, E.G. Razrabotka Tekhnologii i Tovarovednaya Ocenka Myasnyh Kulinarnyh Izdelij iz Myasa Odomashnennogo Severnogo Olenya . Ph.D. Thesis, Moscow State University of Food Production, Moscow, Russia, 2019; 201p.
- Tutelyan, V.A. Himicheskij Sostav i Kalorijnosti Rossijskih Produktov Pitaniya ; DeLi plus: Moscow, Russia, 2012; 284p.
- Ermosh, L.G.; Safronova, T.N.; Evtukhova, O.M.; Kazina, V.V. Analiz pitaniya rabotnikov tyazhelogo truda, vahtovym metodom v usloviyah Krajnego Severa. Rossijskaya Arktika . Russ. Arct. 2018, 3, 71–92.
- Caballero, B.; Allen, L.; Prentice, A. Encyclopedia of Human Nutrition; Elsevier Inc.: Amsterdam, The Netherlands, 2012; 2190p.
- Garry, M.R.; Shock, S.S.; Salatas, J.; Dau, J. Application of a weight of evidence approach to evaluating risks associated with subsistence caribou consumption near a lead/zinc mine. Sci. Total Environ. 2018, 619–620, 1340–1348.
- Petrenya, N.; Rylander, C.; Brustad, M. Dietary patterns of adults and their associations with Sami ethnicity, sociodemographic factors, and lifestyle factors in a rural multiethnic population of northern Norway—The SAMINOR 2 clinical survey. BMC Public Health 2019, 19, 1632.
- Borch-Iohnsen, B.; Nilssen, K.J.; Norheim, G. Influence of season and diet on liver and kidney content of essential elements and heavy metals in svalbard reindeer. Biol. Trace Elem. Res. 1996, 51, 235–247.
More
Information
Contributor
MDPI registered users' name will be linked to their SciProfiles pages. To register with us, please refer to https://encyclopedia.pub/register
:
View Times:
759
Revisions:
2 times
(View History)
Update Date:
28 Jan 2022
Notice
You are not a member of the advisory board for this topic. If you want to update advisory board member profile, please contact office@encyclopedia.pub.
OK
Confirm
Only members of the Encyclopedia advisory board for this topic are allowed to note entries. Would you like to become an advisory board member of the Encyclopedia?
Yes
No
${ textCharacter }/${ maxCharacter }
Submit
Cancel
Back
Comments
${ item }
|
More
No more~
There is no comment~
${ textCharacter }/${ maxCharacter }
Submit
Cancel
${ selectedItem.replyTextCharacter }/${ selectedItem.replyMaxCharacter }
Submit
Cancel
Confirm
Are you sure to Delete?
Yes
No


