 +1 credit
| Version | Summary | Created by | Modification | Content Size | Created at | Operation |
|---|---|---|---|---|---|---|
| 1 | Luigi Duraccio | + 484 word(s) | 484 | 2022-01-14 04:58:13 | | | |
| 2 | Conner Chen | Meta information modification | 484 | 2022-01-27 03:41:35 | | | | |
| 3 | Conner Chen | + 1004 word(s) | 1488 | 2022-01-29 01:27:39 | | | | |
| 4 | Conner Chen | + 1004 word(s) | 1488 | 2022-01-29 01:28:37 | | |
Video Upload Options
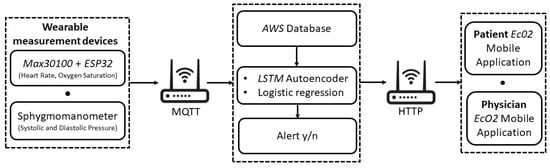
This work addresses the design, development and implementation of a 4.0-based wearable soft transducer for patient-centered, vitals telemonitoring. In particular, first, the soft transducer measures hypertension-related vitals (heart rate, oxygen saturation and systolic/diastolic pressure), and sends the data to a remote database (which can be easily consulted both by the patient and the physician). In addition to this, a dedicated deep learning algorithm, based on a Long-Short-Term-Memory Autoencoder, was designed, implemented and tested for providing an alert when the patient's vitals exceed certain thresholds, which are automatically personalized for the specific patient. Furthermore, a mobile application (EcO2u) was developed to manage the entire data flow and facilitate the data fruition; this application also implements an innovative face-detection algorithm that ensures the identity of the patient. The robustness of the proposed soft transducer was validated experimentally on five individuals, who used the system for 30 days. Experimental results demonstrated an accuracy in anomaly detection greater than 93 %, with a true positive rate of more than 94 %.
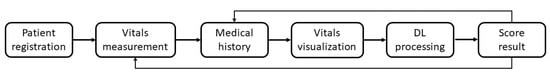
1. Design and Overall Architecture
-
Patient registration
-
Vitals measurement
-
Management of the patient’s Medical History
-
Remote Vitals Visualization
-
AI processing
-
Delivery of the Score result
2. Wearable Sensing Platform

3. Mobile Application
-
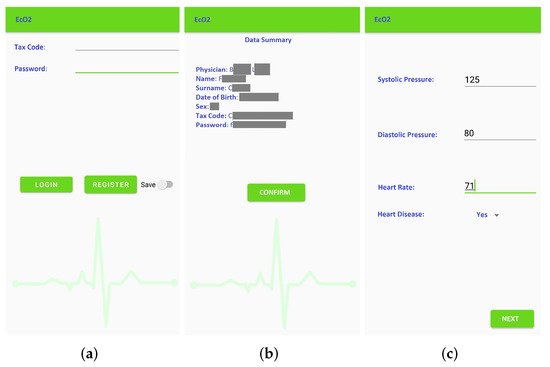
Patient registration: Figure 2 shows the window for registration and/or log in. During registration, the patient inserts their tax code (which is automatically verified), and the patient is associated to the reference physician. The user also enters additional personal information (such as name, surnames, date of birth). The association to the wearable measurement devices is carried out by scanning a QR code generated specifically for a single device. These sensitive data are treated in full compliance with anonymity requirements. In fact, only when an anomaly is detected, the doctor is warned and is able to trace the patient’s identity. Figure 2b shows the window that summarizes the user’s data before they are sent to the cloud database, which checks the data and sends a feedback on the correct registration. Once the registration phase is completed, the patient is brought back to the log-in window to make the first log in. Furthermore, at this stage, there is a check with the database to verify that the password and tax code entered are correct.
-
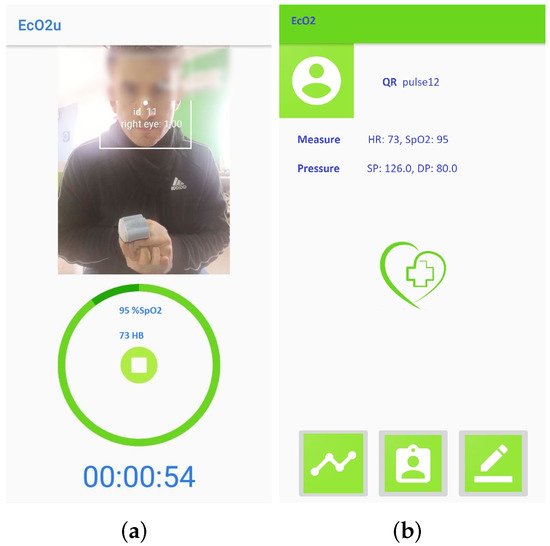
Vitals measurement: To allow the successive automated estimation of the systolic and diastolic pressure, a preliminary calibration procedure has to be carried out. In particular, the patient uses a sphygmomanometer to measure the systolic and diastolic pressure values, while the wearable sensing platform sensor is measuring HR and SpO2. Then, the patient manually enters these data in the application (Figure 2c). This phase, which has to be carried out only once, is necessary to identify the parameters that will subsequently allow the soft transducer to estimate the pressure. After the calibration, the patient can start using the soft transducer.The mobile application was also endowed with an important identification feature that allows associating (and later verify) the patient’s identity acquired through the smartphone camera, as shown in Figure 3a. Finally, the monitored vitals are displayed to the patient, as shown in Figure 3b.
-
Management of the patient’s Medical History: The management of the patient’s medical history is conducted by: (a) showing the daily progress by a graph of the measurements made, (b) reporting the symptoms during the day and (c) indicating any symptoms not present to study a certain correspondence. The cloud database is updated in real-time after each measurement session.
-
Remote Vitals Visualization: The physician can access the EcO2u mobile application with the master credentials to view their patient list; after selecting the specific patient, the physician can display the most recent medical parameters, the graph of past trends and the list of notes, which can be also entered by the patient, in order to see if there is an onset of new symptoms that require a change in therapy (see Figure 3b).
-
AI processing: The AI-based processing of the acquired vitals provides a diagnostic tool to detect anomalies in real-time. In particular, as detailed in the following section, a multivariate linear regression is used to estimate the value of SP and DP, starting from the HR and SpO2 values coming from the MAX30100 and taking into account the age and the presence of diabetes for each patient, while a DL algorithm, based on an LSTM Autoencoder, is used to process the entire set of obtained data (HR, SpO2, SP, DP).
-
Delivery of the Score result: The Score result is a synthetic quantity that indicates if an anomaly is detected based on the patient’s history and current data. In that case, the physician and the patient are immediately warned about the patient’s condition.
References
- MAX30100 Technical Specification. Available online: https://www.maximintegrated.com/en/products/sensors/MAX30100.html?utm_source=google&utm_campaign=corp-sensors&s_kwcid=AL!8732!3!517495051369!b!!g!!&gclid=CjwKCAjwzt6LBhBeEiwAbPGOgU6XlnaLwAiRQZfmrDWlxDbKuBd9_edSl_jfpszGaTb4nB7qWRj94RoCXpIQAvD_BwE (accessed on 12 November 2021).
- ESP32 Technical Specification. Available online: https://www.espressif.com/en/products/socs/esp32 (accessed on 12 November 2021).
- Lazazzera, R.; Belhaj, Y.; Carrault, G. A new wearable device for blood pressure estimation using photoplethysmogram. Sensors 2019, 19, 2557.
- Hsieh, Y.Y.; Wu, C.D.; Lu, S.S.; Tsao, Y. A linear regression model with dynamic pulse transit time features for noninvasive blood pressure prediction. In Proceedings of the 2016 IEEE Biomedical Circuits and Systems Conference (BioCAS), Shanghai, China, 17–19 October 2016; pp. 604–607.
- Haddad, S.; Boukhayma, A.; Caizzone, A. Continuous PPG-Based Blood Pressure Monitoring Using Multi-Linear Regression. IEEE J. Biomed. Health Inform. 2021. aheadofprint.
- Khalid, S.G.; Zhang, J.; Chen, F.; Zheng, D. Blood pressure estimation using photoplethysmography only: Comparison between different machine learning approaches. J. Healthc. Eng. 2018, 2018, 1548647.
- Zhang, B.; Ren, H.; Huang, G.; Cheng, Y.; Hu, C. Predicting blood pressure from physiological index data using the SVR algorithm. BMC Bioinform. 2019, 20, 1–15.

