 +1 credit
| Version | Summary | Created by | Modification | Content Size | Created at | Operation |
|---|---|---|---|---|---|---|
| 1 | Andra Dinache | + 7551 word(s) | 7551 | 2021-12-30 09:04:18 | | | |
| 2 | Mihail Mihail Pascu | Meta information modification | 7551 | 2022-01-19 18:53:37 | | | | |
| 3 | Amina Yu | -36 word(s) | 7515 | 2022-01-20 02:18:52 | | |
Video Upload Options
Foams and emulsions are collections of different kinds of bubbles or drops with particular properties. They provide exceptional sensitive bases for measuring low concentrations of molecules down to the level of traces using spectroscopy techniques, thus opening new horizons in microfluidics. The optical and spectral properties of foams and emulsions provide information about their micro-/nanostructures, chemical and time stability, and molecular data of their components.
1. Foams
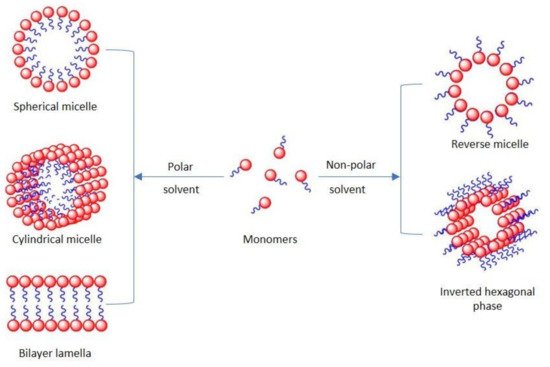
1.1. Surfactants
1.2. Particles as Emulsion and Foam Stabilizers
1.3. Spectral Studies of Foams
The optical processes, like absorption and scattering, jointly govern the light propagation in turbid environments. In this respect, the study of optical properties of surface-active agents might be useful in order to elucidate the mechanisms involved in foam generation and its behavior in connection with different external parameters that may affect foam characteristics. To further understand their function in foam formation, Xiang and al. [51] investigated the release of non-cellulosic components from swollen wood fibers in the presence of an anionic surfactant (SDS) at submicellar concentrations. Between SDS and the leached, non-cellulosic components, highly surface-active aggregates develop, which do not form in the presence of cationic or nonionic surfactants. Using analytical techniques at the interface as well as optical approaches such as UV-Vis Spectroscopy and Attenuated Total Reflection Fourier Transform Infrared Spectroscopy (ATR-FTIR), the in situ and efficient formation of liquid foams in the presence of the leached species was proven. By comparing the respective ATR-FTIR spectra with those obtained from SDS and referenced hemicelluloses[52], the characteristic peaks of hemicellulose are identified at 3355 (O–H bond stretching), 1040 (C–O bond stretching of the ether groups), and 897 cm−1 (β-1,4 glycosidic bond stretching). Additionally, the peak at 1215 cm−1 was assigned to the stretching of skeletal vibration of S–O in SDS. The presence of lignin in hemicellulose was confirmed by the UV-Vis absorbance analysis with a maximum intensity at 205 nm. The foaming capacity, foam stability, and structure were all determined as a function of the aqueous suspension’s composition. The results suggest that only aqueous solutions of the anionic surfactant can remove naturally occurring components attached to wood fibers. They can also generate high-foaming surface-active aggregates[51].
In an attempt to develop multifunctional microwave absorbers that worked in complex environments, He et al. proposed a hybrid foam with a high light adsorption capacity that is promising for use in photo-thermal conversion or as a photoresponsive material. The photo-thermal conversion properties of the hybrid foam were investigated based on the transmittance and diffuse reflectance spectra [53].
The effects of different surfactants (polyvinyl alcohol-PVOH, SDS, cetyl-trimethyl ammonium bromide-CTAB) and gases (N2 and CO2) on the ability of foams to coalesce and remain stable in the context of their applications in the pulp and paper industry was studied using high-speed camera observations and FTIR spectroscopy. Based on the FTIR spectra analysis, the results showed that when the liquid film was newly formed, the corresponding peak of O–H group vibration at 3400 cm−1 for SDS was the strongest, followed in order by those for CTAB and PVOH. The evolution in time of FTIR spectra indicates a quick liquid drainage process for both samples based on SDS and CTAB surfactants while the absorption peak of O–H decreased slowly when PVOH was used, which indicates good stability foam in this case. These results are further linked with the gas diffusion rate of the foam with impact on its stability [54].
The stability of decontamination foams that contain a chemical reagent is a necessity for their usage in nuclear power plant decontamination. The effects of adding silica NPs modified with various functional groups, such as propyl (–CH3), amine (–NH2) and thiol (–SH) on decontamination foam stability was recently reported [55]. The surface properties of these silica NPs were characterized using ATR-FTIR analyses. Because of their extensive dispersion in the liquid layer, the amine-modified silica NPs’ agglomeration in such foams is weaker than that of the other modified silica NPs. Furthermore, at pH = 2, the foam containing amine-modified silica NPs was shown to be stable for 60 min, indicating that it might be used for decontamination. The study found that the decontamination foam with amine-modified silica NPs has the best foam structure of the three investigated foams. The foam stability is improved by the well-dispersed and smaller amine-modified silica NPs, which act as a barrier between the gas bubbles and prevent their coalescence. The thiol and propyl-modified silica NPs create large-diameter aggregates that diminish the maximal capillary pressure of coalescence and hence reduce foam stability[55] .
It has been reported that polyurethane foams functionalized with sulfonic acid groups have been utilized to remove lead (Pb2+) ions from aqueous solutions [56]. The functionalized polyurethane foam characterized by FTIR spectroscopy indicated that the sulfonic acid functional groups were successfully integrated into the polyurethane backbone.
Sclerosant medicines that have been foamed are frequently used in biological applications[57][58][59][60][61]. The most popular medicines used worldwide for varicose vein foam sclerotherapy are detergent-like sclerosants. By displacing intravascular blood, the injection of foamed medications maximizes the interaction of the active substance with the vessel wall. As a result, the medicine is diluted and deactivated as little as possible by blood components. In addition, a lower concentration of active ingredient is required for therapy. Results regarding the elements that may influence the foam stability of the sclerosing agent are discussed in [62] with the aim to better understand the physical processes involved in the evolution of foaming polidocanol (POL) for further biomedical applications. Foam stability improves with an enhancement of sclerosant concentration and an increase in air percentage.
In both fresh and laser irradiated samples, the FTIR spectra reveal molecular structural changes of foam when compared to liquid POL. It is interesting to observe that when POL is foamed, C–H out-of-plane bending vibrations occur, and C–O–H bending vibrations are also influenced (Figure 3a). The optical characterization of POL based on the absorption spectrum registered in UV/Vis/NIR spectral ranges highlights absorption peaks centered in NIR, while it totally transmits in UV/Vis. Previous research has yielded similar results for commercially available Aetoxisclerol (Kreussler Pharma), which contains POL as an active ingredient, owing to the superimposed absorption properties of all the compounds present in the drug solution (Figure 3b)[63].
|
|
|
|
(a) |
(b) |
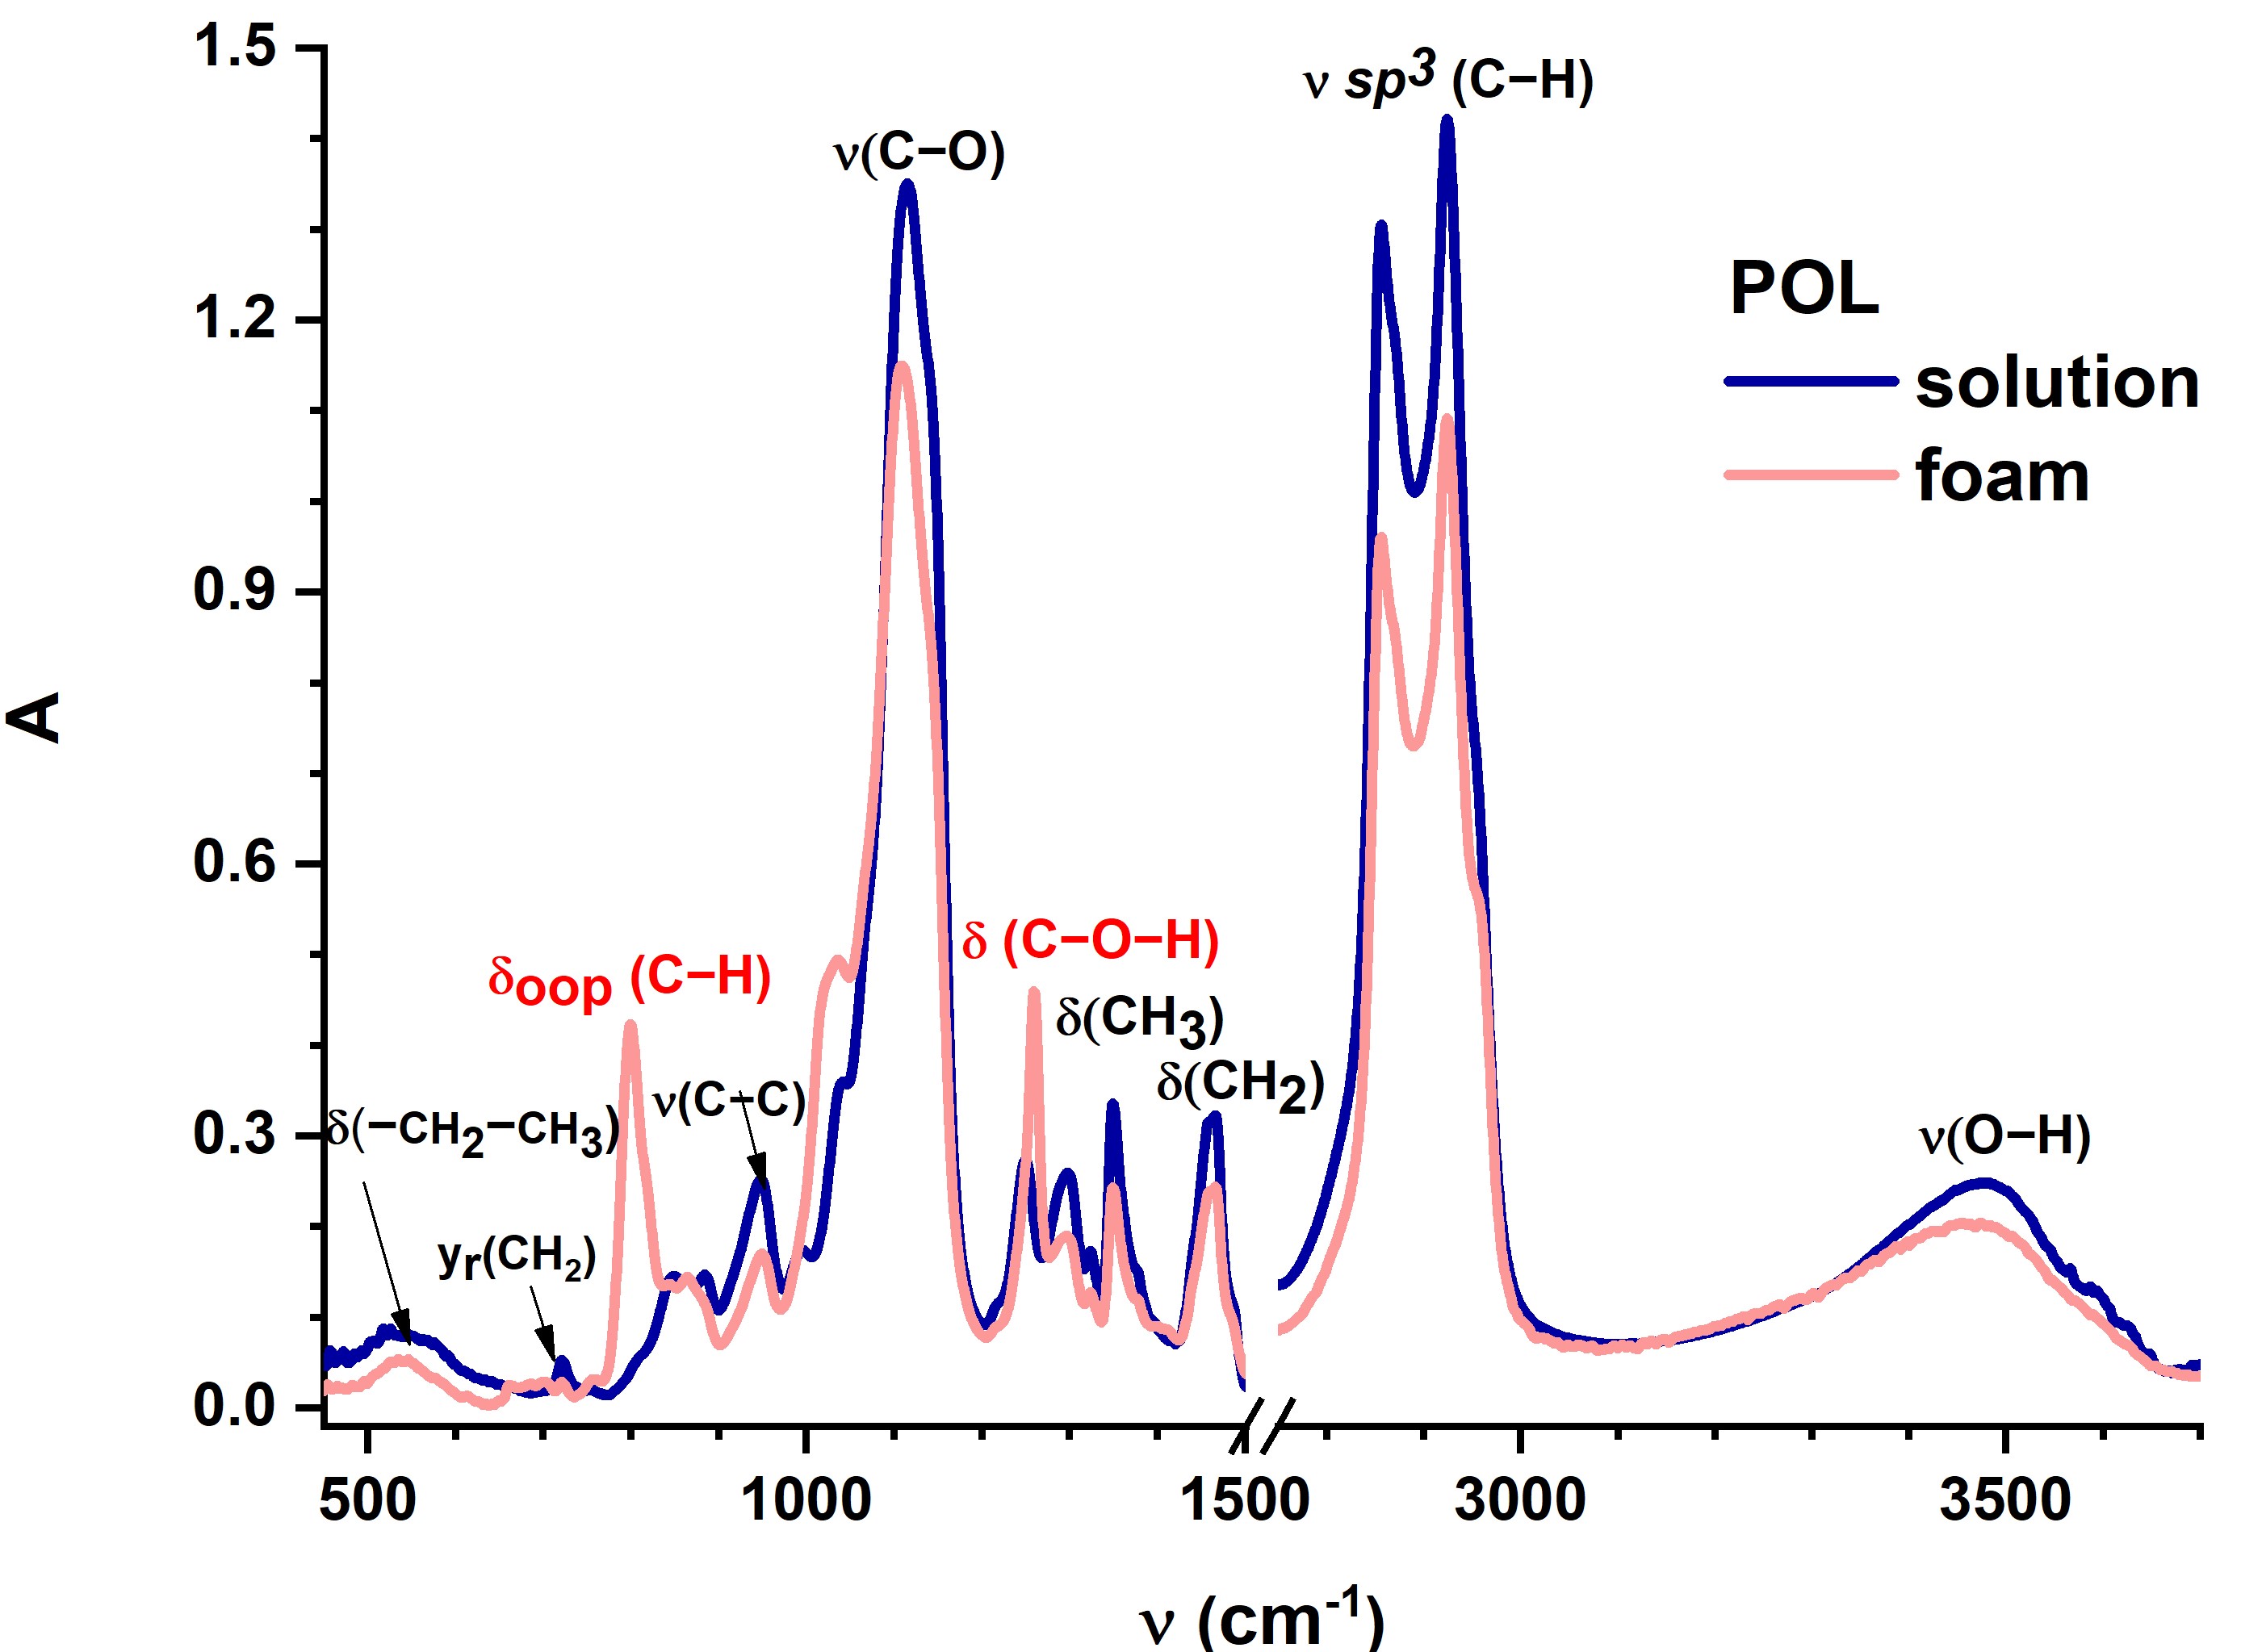
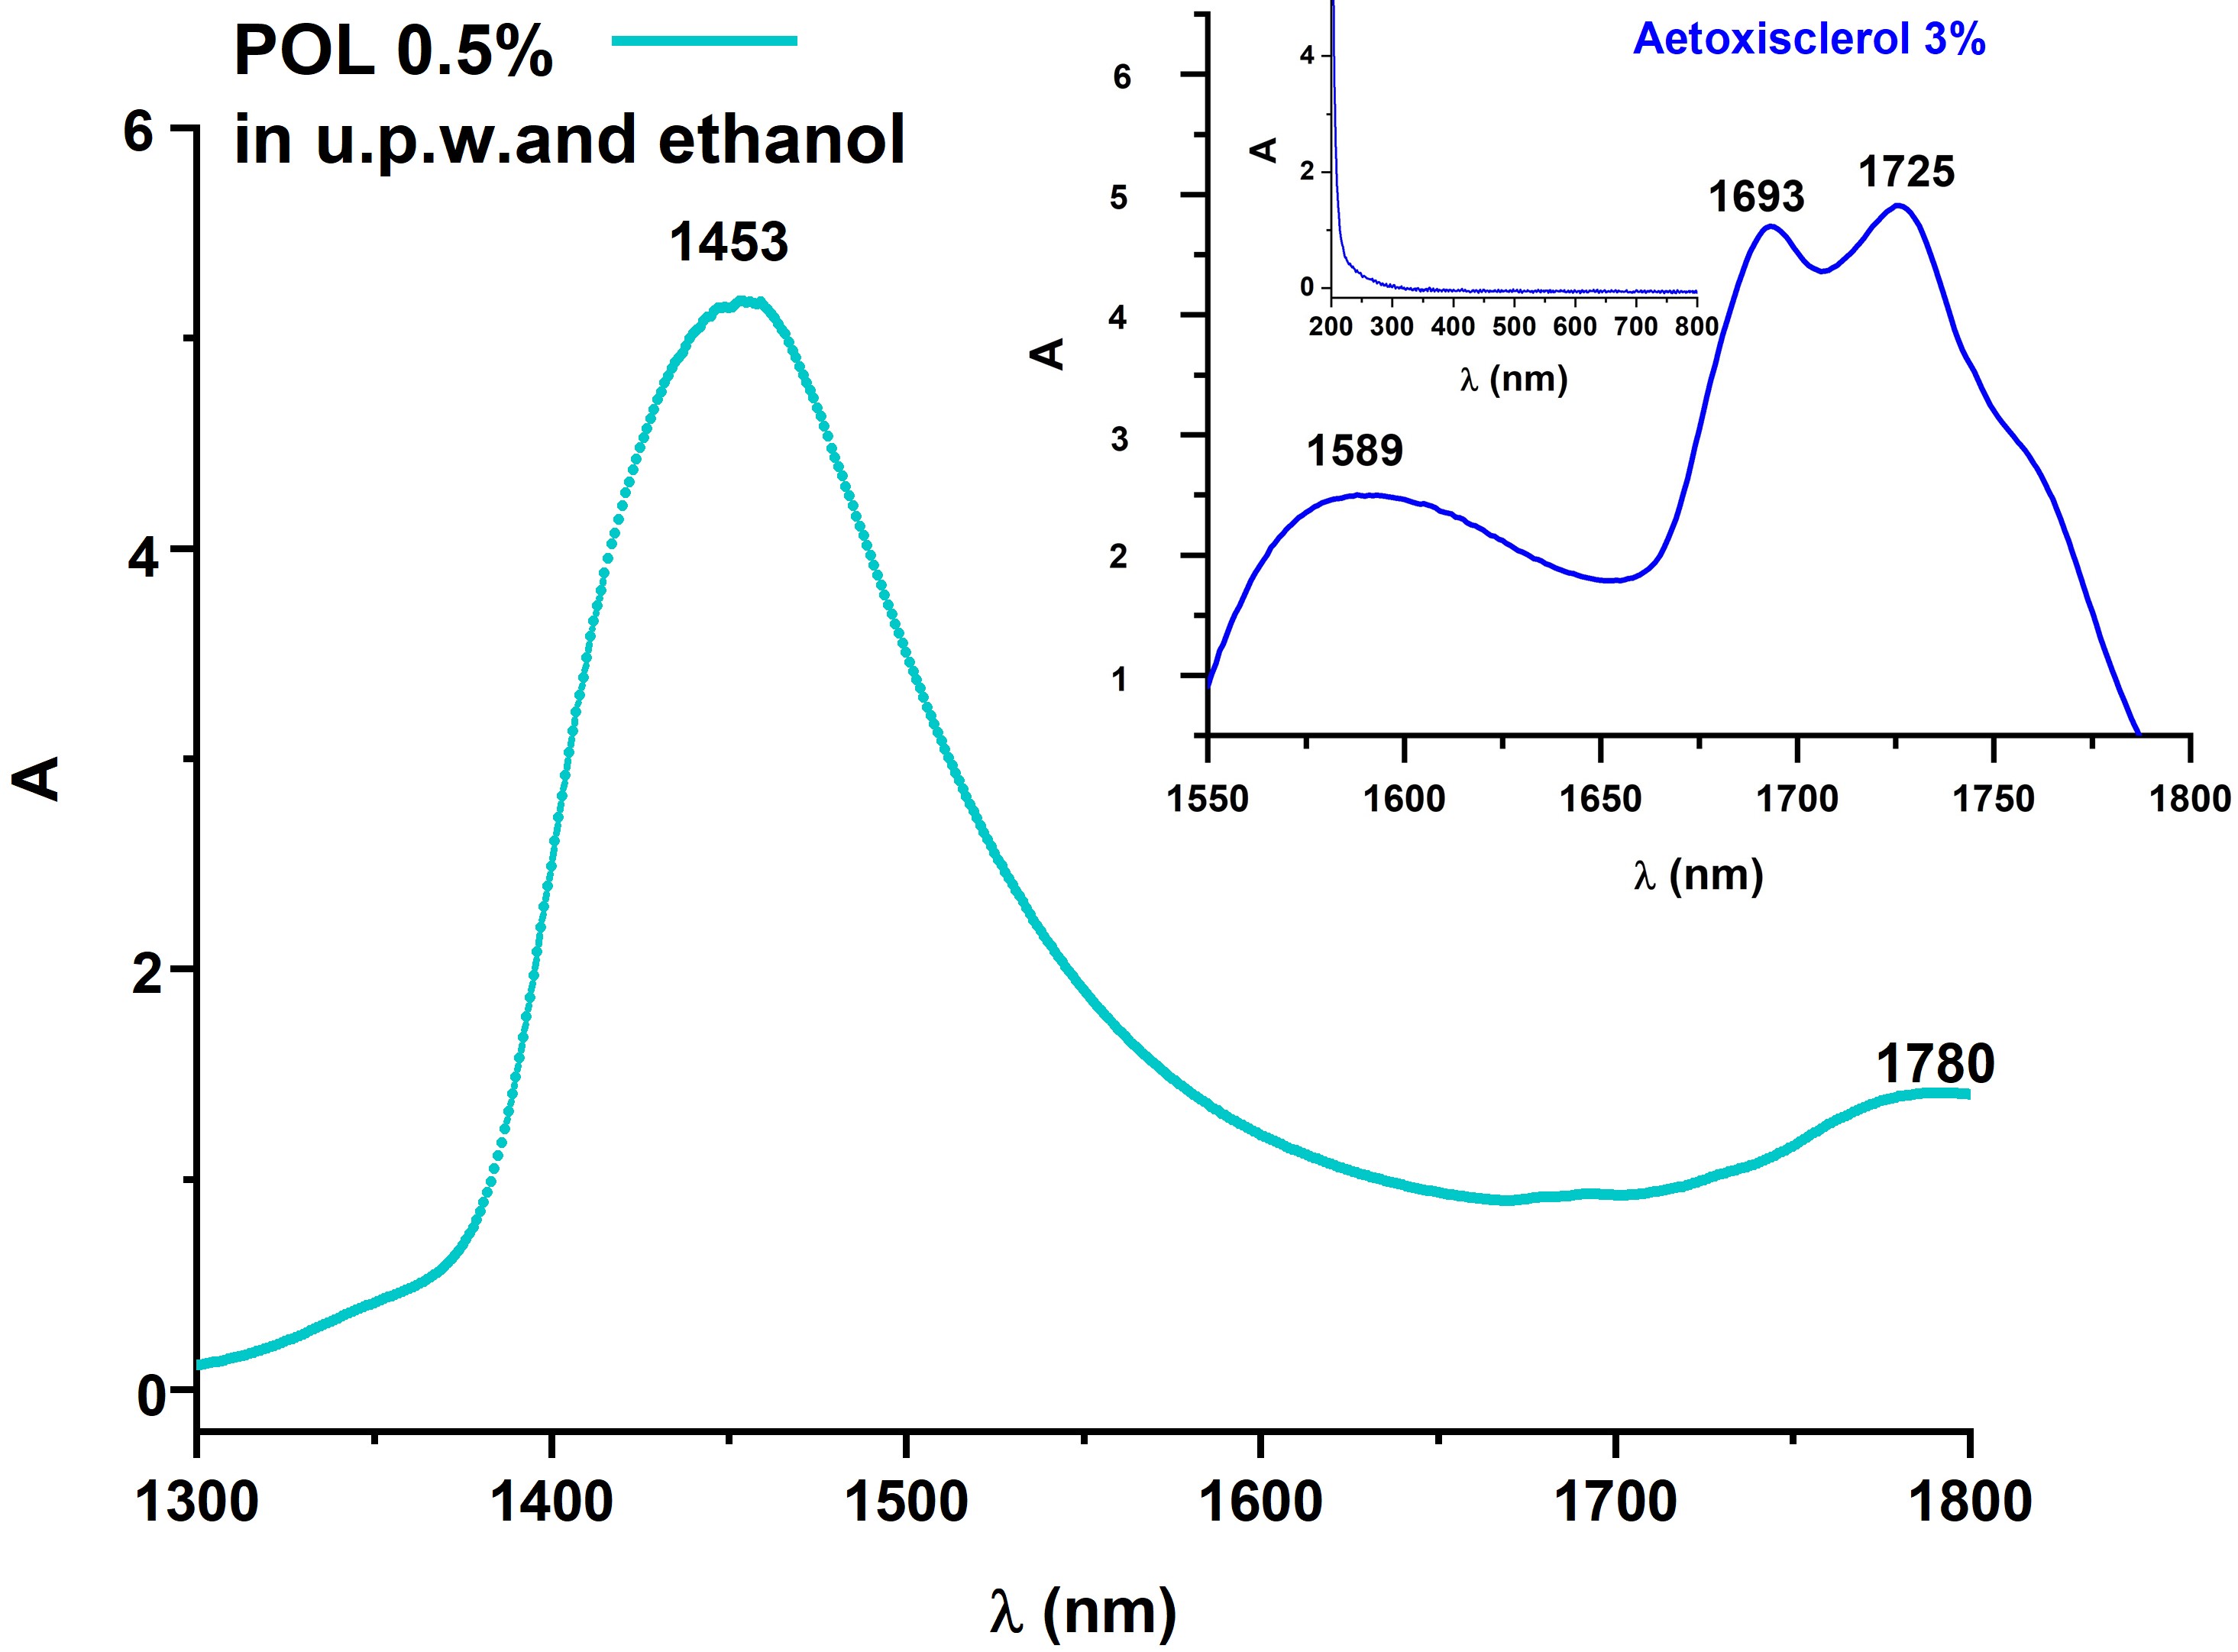
Figure 2. Optical characterization of POL: FTIR spectra of both solution and foam sample showing the vibrational changes of molecules induced by foam generation procedure (Tessari’s double syringe method) (a), and UV-Vis-NIR absorption spectra, with the spectrum of commercially available Aetoxisclerol (Kreussler Pharma) (b).
Raman spectroscopy is a powerful noninvasive technique to assess the structure and dynamics of a system at molecular level. Despite its powerful characterization capabilities, Raman spectroscopy has not been widely used in the study of foams. Because surfactant molecules are so important in the formation and stabilization of foam, Raman spectroscopy, with its ability to monitor molecular vibrations, can provide critical information on their packing, mobility, and conformation [64].
Raman scattering is caused by deformation/stretching of different vibrational bonds of molecules. If the macroscopic and microscopic properties of a foam are linked, the analysis of Raman line profiles is able to indirectly assess its elastic properties by investigating its molecular inner activity.
The work of Zhao et al. presents the graphene foam characteristics obtained by using Raman spectroscopy [65]. The Raman spectrum of 3D graphene foam displays two characteristic peaks: at 1583 cm−1 (G band), due to the doubly degenerate zone center E2g mode, and 2710 cm−1 (2D band). No obvious graphene D band at ~1350 cm−1 was observed, thus indicating that the graphene foam is of high quality. The D band is used for the characterization of defects or the disorder of the graphene, its density being proportional to the amount of disorder in the sample [66].
Different studies on wet foam have explained the gross properties of wet foam in the light of its characteristic molecular structure using Raman measurements. Their results highlighted the observed shift in the low frequency Raman peak position of the methylene rocking mode with the variation in internal stress in the foam. Wet foam exhibits a steady structural shift from an all-trans conformation to a crystalline structure as it ages, according to Raman measurements in the 1000 cm−1 to 1450 cm−1 region [67]. Drainage of water from wet foam is discussed and, in addition to free water molecules which drain out with aging of foam, water clusters of only a few water molecules are also present in foam. The correlation between the internal stress and the characteristics of a vibrational mode in wet foam is also shown. The fundamental challenge in utilizing Raman spectroscopy to examine wet foam is due to multiple light scattering within the bubbles. This affects the Raman signal from the bubbly structure, impacting the signal to noise ratio in the spectrum. To overcome this difficulty and provide an optimum Raman signal collection, the spectrometer slit width should be adjusted to match the mean bubble size of foam [68]. The investigations carried out by Goutev and Nickolov demonstrate the capabilities of Raman spectroscopy to study the microstructure of three-dimensional foams and their dynamics. The Raman experiment set-ups were performed in backscattering, the laser beam making an angle of 50° with the cell. The foam was placed in a closed glass rectangular cell to prevent changes due to evaporation or was probed directly in the case of dry or semidry residue. The liquid that drained off the foam was studied in 2 mm internal diameter capillaries in the conventional 90° geometry with the laser beam parallel to the long axis of the capillaries. The scattered signal was collected by a lens (F = 40 cm), passed through a Raman notch filter and imaged on the entrance slit of a single 60 cm focal length polychromator. Detection of spectra was accomplished by an intensified vidicon and computer controlled multichannel system. An argon ion laser emitting at 488 nm was used as excitation source. The beam with typically 120 mW was focused on the sample using a lens (f = 100 mm). The detection system was calibrated by Ne emission lines. It is seen from the Raman spectra of ‘‘wet’’ foam in the C–H region (2800–3000 cm−1) that the band shape changes weakly with aging. Its subcomponents are comparatively well expressed in all stages of foam evolution and only their relative intensities change[68].
Aetoxisclerol solution and foam samples were analyzed by Raman spectroscopy in an attempt to improve the efficacy of the laser sclerotherapy for small varicose veins if the sclerosing agent is used as foam. The Raman vibrational lines associated with foam samples are more organized and powerful than those associated with liquid specimens[69]. When a laser beam interacts with a 3D foam, the movement of light through this scattering medium is essentially a random process with a mean free path, l*, which is referred to as diffusive propagation. This causes so-called diffusive excitation, which results in a distribution of elementary Raman scattering centers in the bulk of the foam. In turn, the Raman signal will diffuse in all directions, reaching in the end the foam cell boundaries and allowing the Raman signal from the bulk foam to be detected. According to the relationship l* = 3.5 × d [110], the specific dimension of the Raman intensity distribution at the scattering focal plane (usually the surface of the foam) is proportional to the transport mean free path l*, which has been linked with the size of the foam bubble (d)[70] .
Raman spectra were also recorded at various times after foam samples were prepared. The Raman spectra (Figure 3) appears to shift very quickly, with Raman lines 10 times less strong than initial values after 5 min of foam generation.
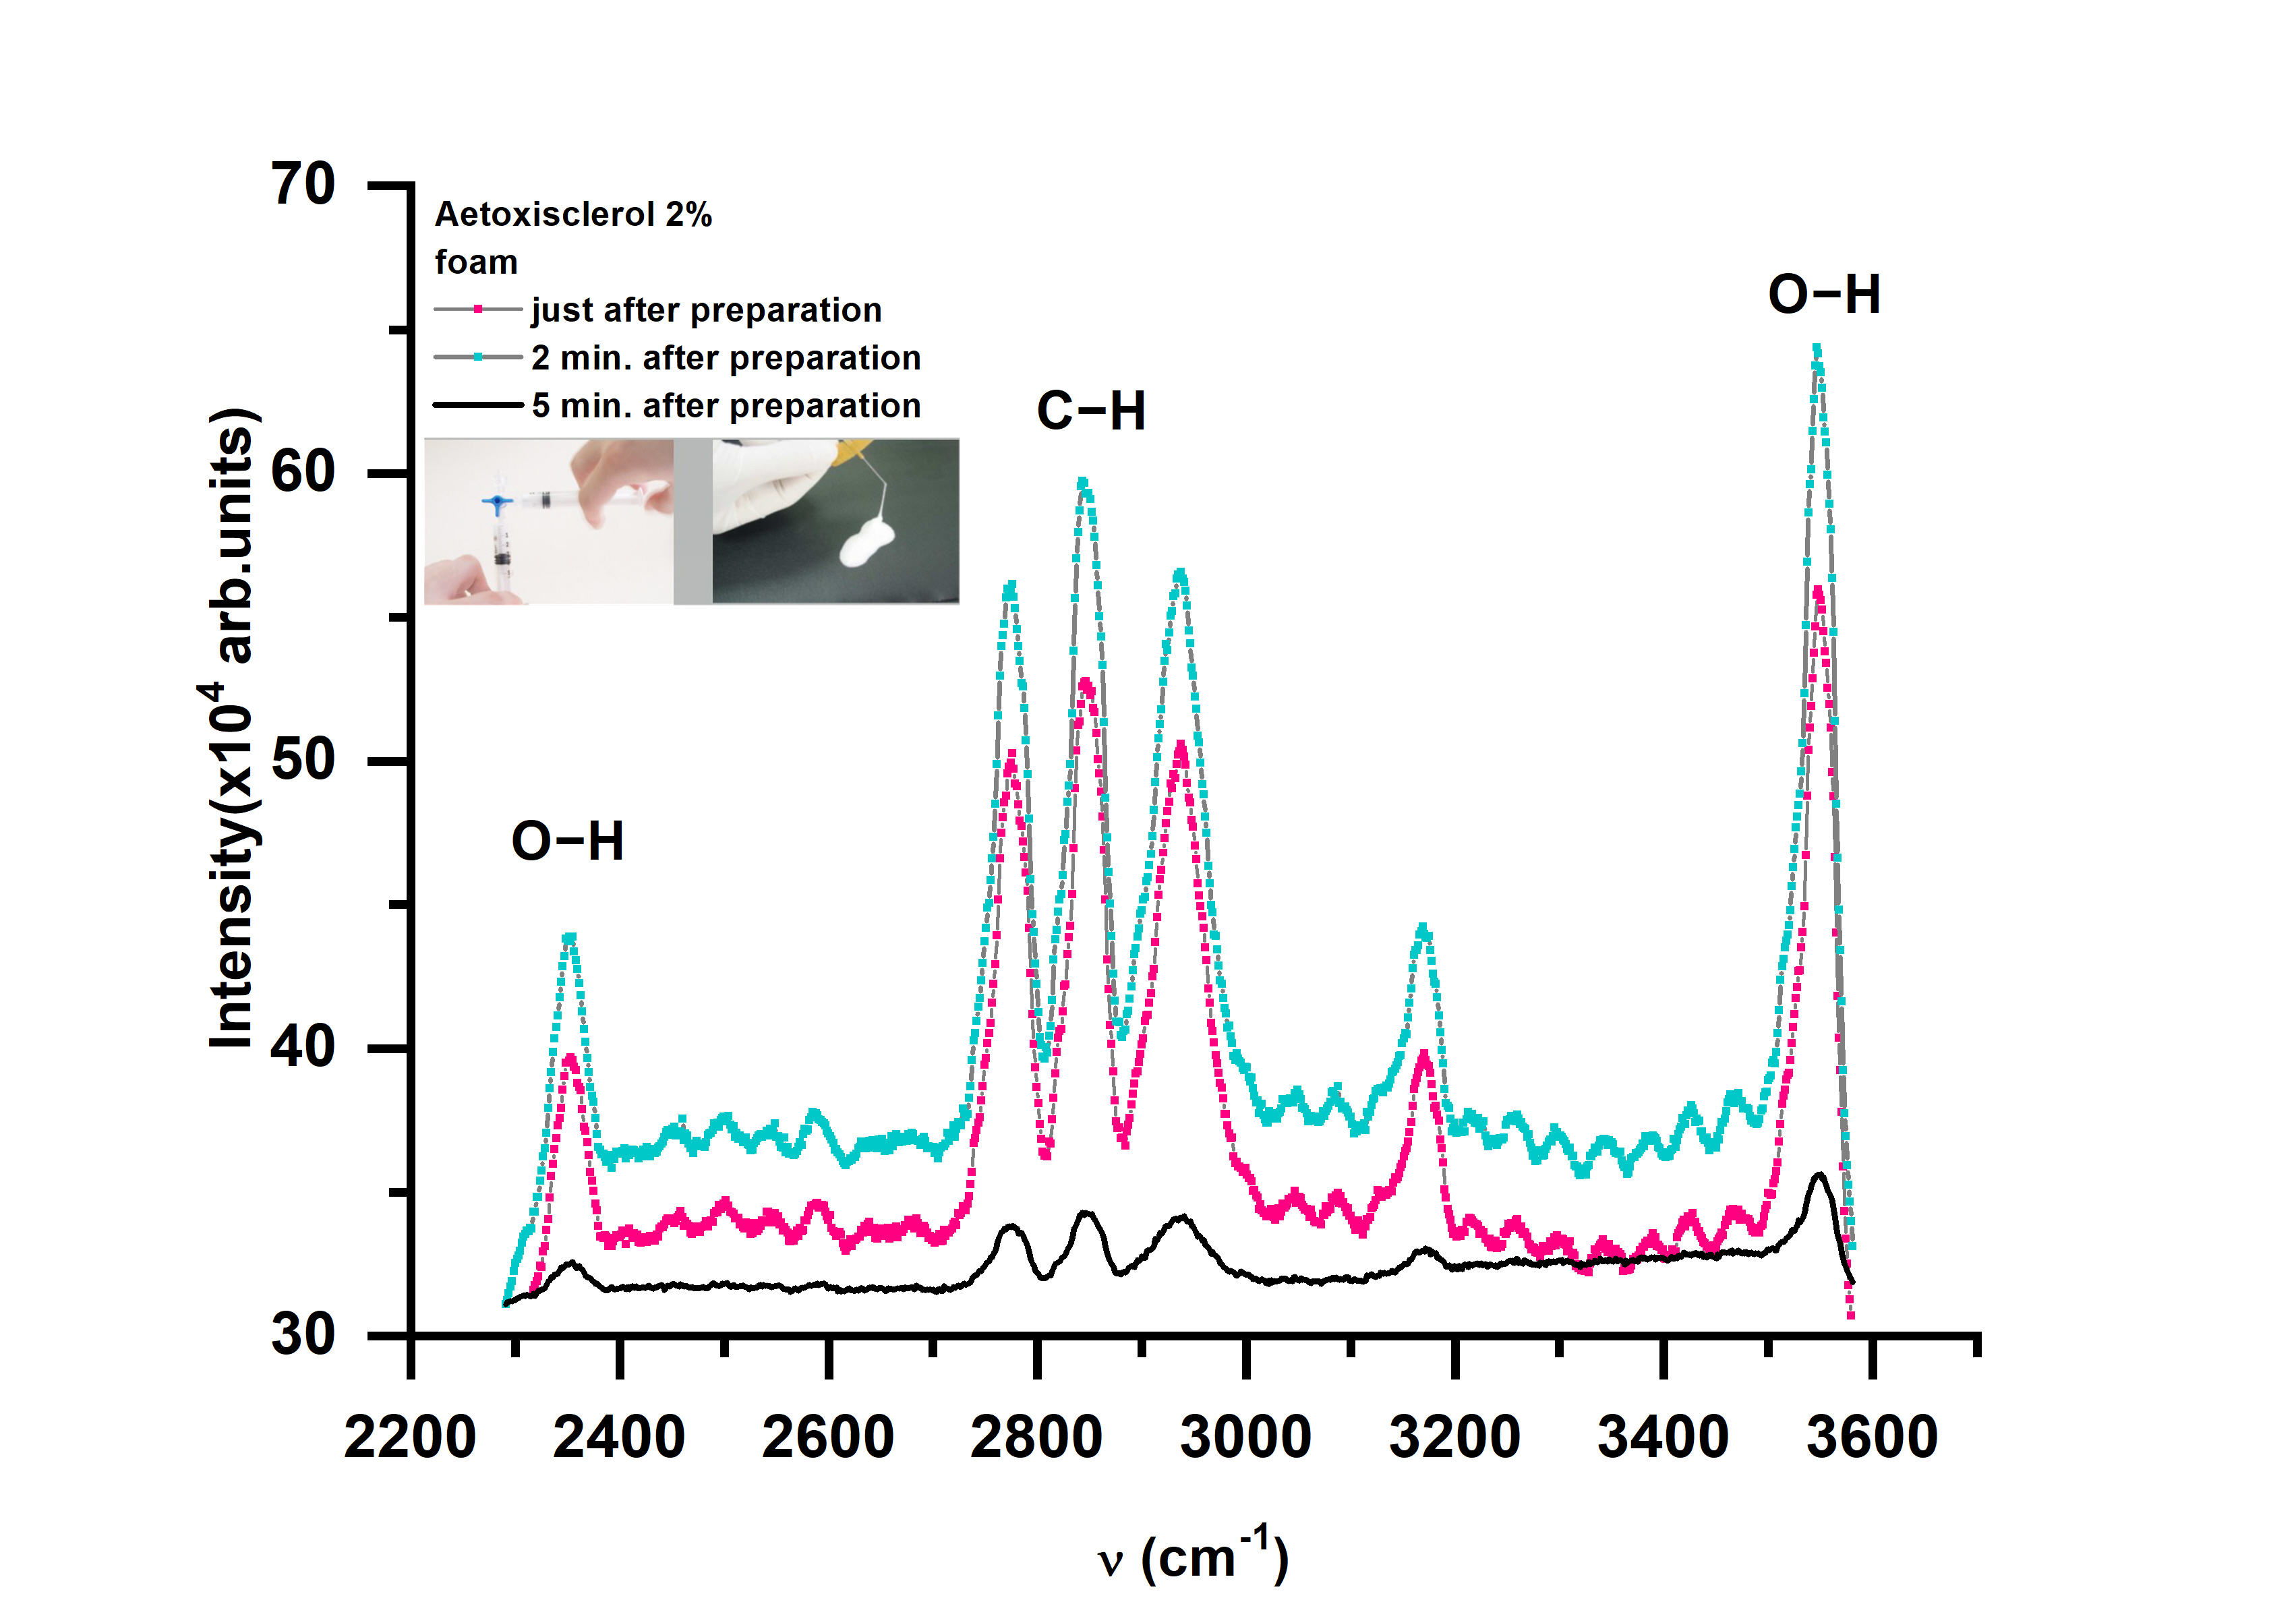
Figure 3. The influence of foam stability on the Raman spectra of Aetoxisclerol sclerosant drug.
The findings suggest that various aspects, such as bubble diameters related to foam cohesiveness, must be taken into account when considering the temporal moment of exposure of the varicose vein injected with foamed medication and exposed in the tissue to laser radiation [69].
The multiple scattering of light by aqueous foams was systematically studied as a function of wavelength, bubble size, and liquid fraction. Results are analyzed in terms of the transport mean free path of the photons and an extrapolation length ratio for the diffuse photon concentration field. An experimental study of the dependence of these parameters on structure and composition of foams was detailed in Ref. [71]. The transport mean free path was found to be proportional to the bubble diameter and the reciprocal of the square root of liquid fraction. The extrapolation length ratio varies almost linearly with liquid fraction between the values for water–glass–air and air–glass–air interfaces.
Diffusing Wave Spectroscopy (DWS) can be employed as an optical rheology tool with numerous applications for studying the structure, dynamics and linear viscoelastic properties of complex fluid systems like foams and emulsions. Improved DWS based on the automatized determination of the optical transport and absorption mean free path was reported in[72] by simply measuring the photon count rate of both the light scattered in transmission and backscattering geometry.
The gas–liquid or liquid–liquid interfaces substantially scatter light propagating in foams or emulsions. This property makes it difficult to directl[73]y detect the structure and dynamics deep within the bulk of such samples. Multiple light scattering, on the other hand, can be used to develop non-invasive experimental approaches for measuring average bubble size, droplet size, and dispersed volume fraction. When a laser is used to illuminate a sample, the transmitted or backscattered light generates a speckled interference pattern, revealing the dynamics of intrinsic structural changes (coarsening, flocculation or external stress) through temporal variations [74].
Diffuse Transmission Spectroscopy (DTS) was introduced by Kaplan et al. to investigate the structure of opaque colloidal suspensions [75]. This technique is suitable for determining the temporal dynamics of average bubble dimensions during foams’ coarsening or of the liquid fraction of a foam during drainage[76] .
For investigation of foams, DWS gives information about stationary dynamics of bubbles reconfigurations in time, as an average of the whole sample through the transmitted light or just near the surface of the foam, through backscattered light[74] .
Thus, DWS was employed to probe the reorganization of bubbles after an aqueous foam is subject to transient shear deformation, determining that the bubble dynamics returns to the behavior of a stationary foam via a nonlinear relaxation depending on the age of the foam and amplitude of shear [77]. In earlier studies, when shear stress was applied to shaving cream foam, DWS showed that the decay of the correlation functions is associated with intrinsic rearrangements of bubbles[78] .
In [79]DWS was employed to investigate the elastic response of an aqueous foam (shaving cream) when it was subjected to oscillating shear strain. It was observed that for small amplitudes of the strain, the response in bubble rearrangement is linear, but if the strain amplitude is larger than 0.05% the response is nonlinear.
Also, DWS provided insights about the bubble dynamics when shear stress is applied continuously to an aqueous foam. It was discovered that the bubble dynamics depend on the relationship between the strain rates and the macroscopic deformation. For slow shear, the deformation is due only to localized rearrangements of bubbles occurring because of foam aging and applied shear; for intermediate shear, the deformation appears because of bubble reorganization induced by nonaffine and directed shear; and for fast shear, the foam bubbles are moving constantly, leading to “melting” of the foam[73].
DWS analysis of the coarsening of an aqueous foam loaded with monodisperse latex beads revealed that the temporal autocorrelation function of the scattering intensity presents two decays decoupled and separated in time. These distinct decays are due to two different processes: bubble rearrangements during foam aging, which is responsible for the longer decay, and Brownian motion of the colloidal particles in the liquid fraction, giving rise to the shorter decay [80].
Marze et al. showed that DWS helps distinguish between foams subjected to slip and foams subjected to shear. The slip velocity was determined to be maximum at the yield stress[81].
Multispeckle DWS was employed to study the bubble dynamics during coarsening of levitated foams. Different liquid fractions were analyzed, showing that local bubble reorganization dominates the dynamics of dry foams, but the bubbles have a ballistic motion for high-liquid-fraction foams. Multispeckle DWS enabled studying the non-local dynamics at different times, showing that during aging of dry foams, a substantial reorganization of bubbles is responsible for intermittent bursts observed in the bubble dynamics. Opposite to this, for wet foams, the large-scale dynamics of bubbles undergo ballistic and convection motions[82].
2. Emulsions
2.1. Emulsifiers
2.2. Techniques of Emulsification
2.3. Spectral Properties of Emulsions
It is known that the UV-Vis absorption spectrum of an emulsion can give information about the absorption and scattering properties of the droplets. UV-Vis spectra of decane/sodium dodecyl benzene sulfonate (SDBS)/water emulsions were recorded for several oil phase concentrations as function of temperature. The normalized UV-Vis spectra showed that the droplet size distribution was the same for emulsions having various oil phase concentrations. However, the average diameter varies with temperature. UV-Vis absorption spectroscopy was proposed as a useful technique to analyze the behavior of chromophoric emulsifiers depending on experimental parameters such as concentration and temperature[116].
UV-Vis spectral measurements of hydrocarbons/SDBS/water emulsions in the range 300–820 nm suggested that the dimensions of the droplets were between 1 µm and 20 µm. These studies show the importance of the absorption and scattering properties obtained from the UV-Vis spectra, which give information about droplets’ shape, size distribution and chemical composition[117] .
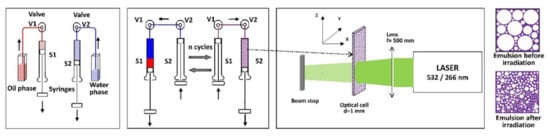
UV-Vis-NIR reflectance spectra of sodium tetradecyl sulfate (STS) in water and oily vitamin A emulsions showed an increase in reflectance after the sample was exposed to laser radiation, suggesting a decrease in size of the droplets (Figure 5). This finding was supported by surface tension analyses, optical spectroscopy analyses and dynamic light scattering measurements of the emulsions before and after laser irradiation [118][119].
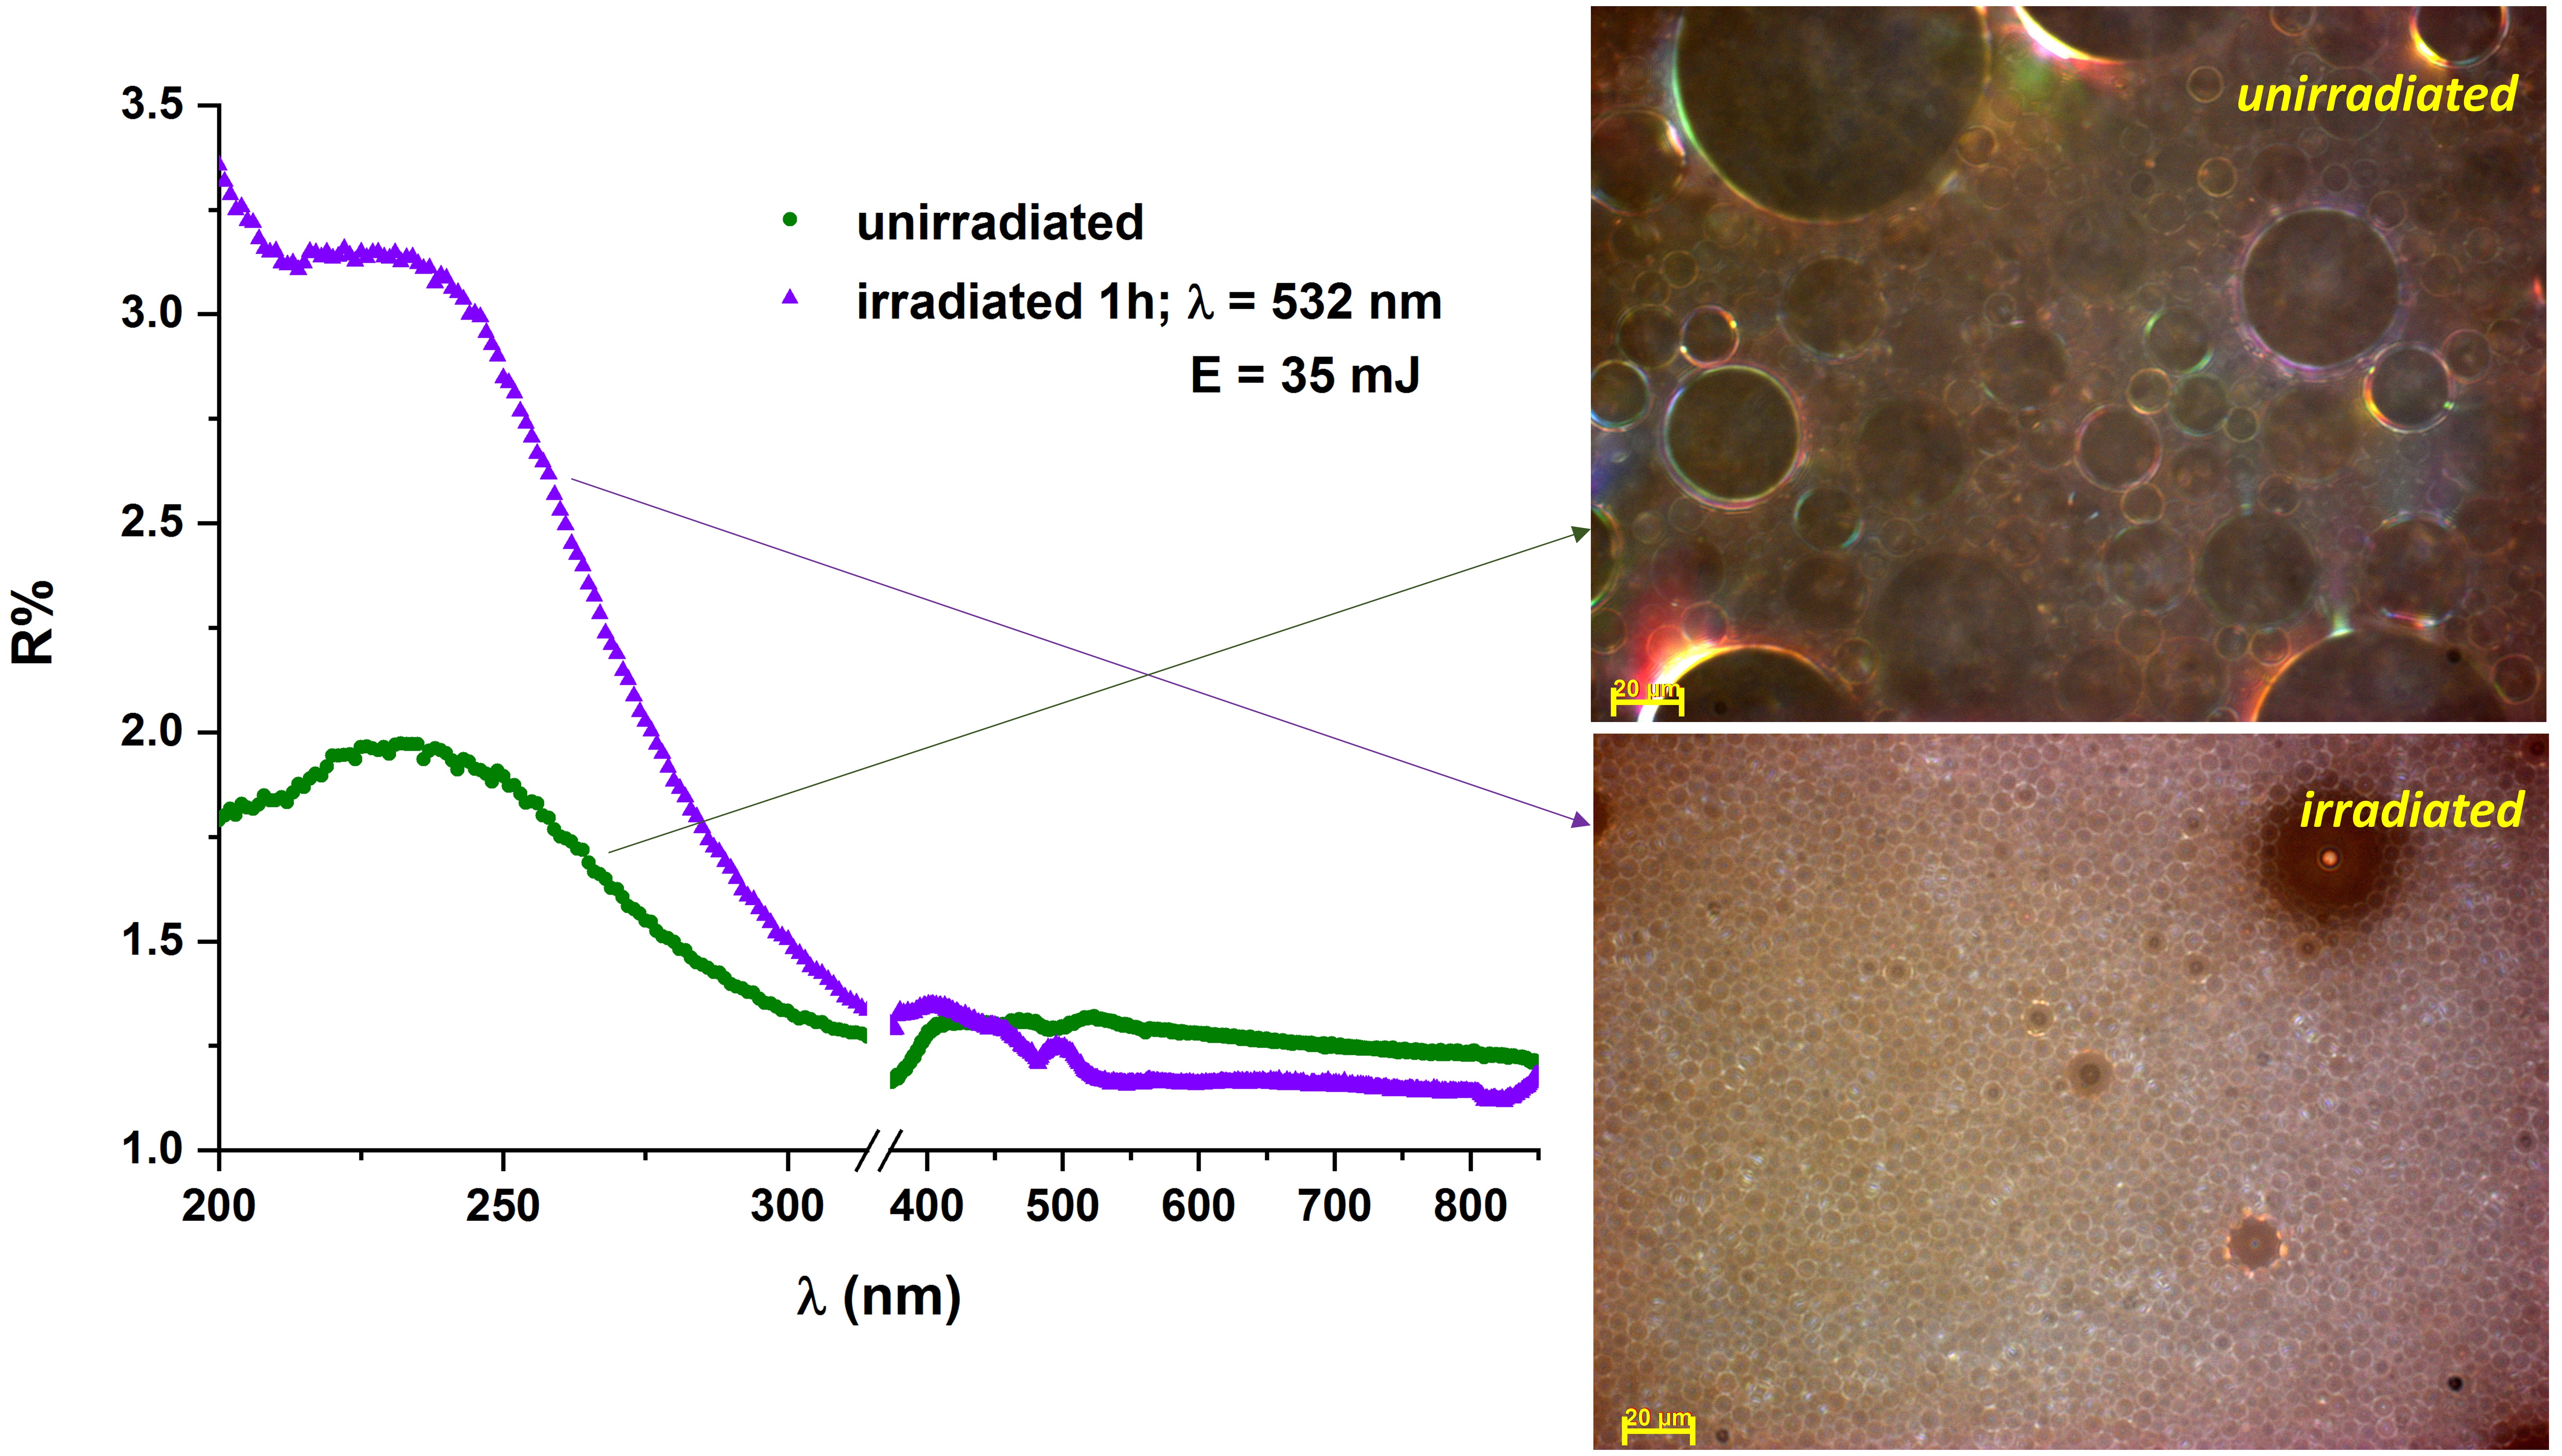
Figure 5. UV-Vis absorbance spectra of vitamin A and STS 10% emulsion, 1:1 ratio, before and after exposure to laser radiation. Optical microscopy images (reflected light-DIC mode, 50X magnification) of the same samples.
UV-Vis absorbances recorded at two wavelengths (450 nm and 850 nm) were employed to evaluate the stability of W/O emulsions, using the turbidity ratio method. For Diesel oil emulsions, these measurements allowed to determine that the stability of the emulsion was enhanced with concentration increase in the emulsifier and that the necessary HLB of Diesel oil is around 9 [120].
UV-Vis spectroscopy and Polarization Modulation Infrared Reflection–Absorption Spectroscopy (PM-IRRAS) helped to determine the best position of the components (Bovine Serum Albumin—BSA, Tannic Acid—TA, chitosan, and pectin) in the design of a multilayer O/W emulsion. UV-Vis and PM-IRRAS spectral measurements were employed to evaluate protein/polysaccharide multilayer arrangement on a solid surface [121].
UV-Vis transmittance spectra of O/W toluene emulsions showed that their turbidity decreased over time. These measurements, completed by multiphoton ionization time-of-flight mass spectrometry (MPI-TOFMS) measurements, give information about the creaming behavior of the analyzed emulsions[122].
Other powerful tools in emulsion analysis are Fourier transform infrared (FTIR), attenuated total reflection FTIR spectroscopy (FTIR-ATR) and Raman spectroscopy. FTIR spectroscopy enables the identification of the molecular vibrations from each component of the emulsion, providing real-time information about the destabilization of the emulsion. In [119], FTIR-ATR measurements showed the influence of STS on water molecules. Even if the concentration of STS was undetectable, its action on water molecules was observed due to O–H stretching vibrations. In the same study, Raman signals revealed modifications of the C=O band at 1800 cm−1, allowing to observe the polymerization of STS molecules [119].
FTIR and Raman spectroscopies were also employed to study vinyl acetate-based (VAc-based) emulsions usually utilized in paintings. More exactly, FTIR-ATR and micro-Raman spectroscopy (µ-Raman) successfully identified VAc-based emulsions from different samples and determined the addition of phthalates/benzoates as plasticizers. µ-Raman measurements determined spectral markers of VAc copolymers with the monomer vinyl versatate and FTIR-ATR detected poly(vinyl alcohol) as a stabilizer of the emulsion[123].
FTIR-ATR spectroscopy was utilized to study the effect of polyglycerin-polyricinoleat emulsifier concentration on the molecular stabilization mechanisms of W/O emulsions of anthocyanin-rich bilberry extract water solution dispersed in in a medium chain triglyceride (MCT) oil phase. The modification of the O–H stretching vibration band was analyzed to evaluate the molecular interactions at water–oil interface. This study concluded that in this case, the changes in emulsifier concentration, in the range 1–10%wt, have an insignificant effect on emulsions’ stabilization [124]. For a similar emulsion, FTIR-ATR measurements showed that the emulsifier increases the intramolecular covalent O–H bonds, leading to a modification of the hydrogen bond network. This also implies a reduction of intermolecular interactions in the interfacial water layer[125].
Another study uses FTIR spectroscopy to analyze the destabilization of emulsions used in cosmetics and pharmaceutics. Reduction of the unsaturation index, increase in the carbonyl index and broadening of the C=O band are indicative of the aging of emulsions. The modification of the carbonyl band suggested that free fatty acids appear during the aging process. FTIR measurements allowed to comprehend the chemical mechanisms involved in the oxidation of these emulsions[126].
FTIR studies of sodium bis(2-ethylhexyl)sulfosuccinate (Aerosol-OT, AOT)/isooctane/water microemulsions analyzed the states of water and the conformations of AOT in these microemulsions. Four bands were recorded for O–H stretching vibrations and they were assigned to the trapped water in the palisade layer (3610 cm−1), the water bound to the sulfo group (3540 cm−1), the free water (3440 cm−1) and to the water bound to the sodium counterion (3225 cm−1). Gauche and trans conformations of AOT molecules were identified based on the absorption bands at 1739 cm−1 and 1725 cm−1, originating from carbonyl stretching vibrations[127].
O–H stretching bands were also studied to determine absorptions of bulk and interfacial water from sodium dioctyl sulfosuccinate reverse micelles. The study showed that the main absorption on the red side of the O–H band originates in the bulk water, and the interfacial water is responsible for the absorption on the blue side O–H band [128].
The modifications of O–H stretching bands were also assessed to study the structure of water in W/O microemulsions utilized to synthesize oxalate precursor NPs. NPs are obtained through a precipitation reaction in the core of the reverse micelles formed when two initial microemulsions are mixed. In order to identify the water structure, the O–H stretching band was decomposed into three components, each corresponding to a different type of hydrogen bonding. The findings lead to the conclusion that after the synthesis of NPs, the number of bound water molecules was increased [129].
FTIR spectroscopy was one of the techniques employed to determine the structural changes of proteins incorporated in W/O emulsions. This method allowed to determine that the secondary structures of BSA and human serum albumin (HSA) changed after their incorporation in emulsions [130]. ATR-FTIR measurements allowed to determine the heat-induced modification in the structure of edible coconut protein concentrate (CPC), which is also used as oil-in-water emulsifier[131].
The effect of temperature on emulsion stabilized by soy lecithin was studied also through FTIR spectroscopy. Analysis of bands originating in –OH vibration, –CH2 stretching, H–O–H bending vibrations, and P=O, C–O–C, and P–O–C vibrations allowed to determine that the emulsions stabilized by phospholipids remained stable when the temperature was varied, as opposed to the control emulsion that had no emulsifier added[132].
FTIR spectroscopy was useful in determining the chemical groups in the crude oils responsible for emulsifications. This study is important for separation of oil from O/W emulsions, which is a significant problem for the petroleum industry [133].
As in the case of foams, the internal dynamics and structure of emulsions can be studied with spectroscopy techniques based on multiple scattering of light, like DWS.
Marze et al. employed DWS in back- and forward-multiple scattering to evaluate the in vitro digestion of eight emulsion samples, determining that the type of triglyceride in the emulsions is the main parameter to influence the digestion. The advantage of using DWS is that the emulsions can be analyzed at their normal appearance, without the need to dilute them. When comparing the particle size distribution (PSD) determined through DLS with the PDS determined from DWS measurements for multiple scattering, Marze et al. found the results to be in good agreement. In order to determine the PDS, the statistical analysis of cumulants and moments employed for single scattering was applied to DWS data. This method could not have been successfully applied to long term digestion. Forward-scattering DWS measurements, complementary to nuclear magnetic resonance diffusion measurements, permitted to determine the diffusion coefficients. It was observed that during digestion, the transitions were from a droplet to a vesicle and afterwards to a micelle[134].
DWS has the potential to monitor the manufacturing process of turbid pharmaceutical emulsions, being able to offer information about the dynamics and the statics of the emulsions. Continuous DWS analysis during generation of pharmaceutical emulsions can give data about optimal homogenization conditions, showing when to stop the manufacturing process in order to prevent overprocessing of emulsions. Emulsion dynamics correlated with static analysis were in agreement with the modification of the droplet size distribution, during emulsion generation[135].
A series of model pharmaceutical emulsions were analyzed through DWS and the results were compared to other stability analysis methods. Obtained results regarding the stability were similar to those from the other methods. This, along with the fact that the technique is non-invasive, fast, and needs only small volumes of emulsions, makes DWS suitable for analyzing the stability of pharmaceutical emulsions [136].
A new model for fitting DWS measurements of emulsions during their creaming/ sedimentation is presented in [137]. This model starts from a Monte Carlo simulation of the light that diffuses in the volume of the emulsion in order to determine the averages and the distributions of the droplet size and dynamics.
DWS proved to be a useful technique not only in pharmaceutics, but also in cosmetics. The stability of cosmetic formulations was assessed via DWS and it was observed that the instability of the emulsion was higher for larger values of mean square displacement (MSD) [138].
References
- Langevin, D. Coalescence in Foams and Emulsions: Similarities and Differences. Curr. Opin. Colloid Interface Sci. 2019, 44, 23–31.
- Drenckhan, W.; Testouri, A.; Saint-Jalmes, A. Fundamentals of Foam Formation. In Foam Films and Foams: Fundamentals and Applications, 1st ed.; Ekserova, D.R., Gochev, G., Platikanov, D., Liggieri, L., Miller, R., Eds.; CRC Press, Taylor and Francis Group: Boca Raton, FL, USA, 2019; ISBN 978-1-351-11772-2.
- Maestro, A.; Rio, E.; Drenckhan, W.; Langevin, D.; Salonen, A. Foams Stabilised by Mixtures of Nanoparticles and Oppositely Charged Surfactants: Relationship between Bubble Shrinkage and Foam Coarsening. Soft Matter 2014, 10, 6975–6983.
- Parsa, M.; Trybala, A.; Malik, D.J.; Starov, V. Foam in Pharmaceutical and Medical Applications. Curr. Opin. Colloid Interface Sci. 2019, 44, 153–167.
- Fameau, A.-L.; Fujii, S. Stimuli-Responsive Liquid Foams: From Design to Applications. Curr. Opin. Colloid Interface Sci. 2020, 50, 101380.
- Denkov, N.; Tcholakova, S.; Politova-Brinkova, N. Physicochemical Control of Foam Properties. Curr. Opin. Colloid Interface Sci. 2020, 50, 101376.
- Morrison, I.D. Ross’s Rule: Sydney Ross and the Phase Diagram. Colloids Surf. Physicochem. Eng. Asp. 1996, 118, 257–261.
- Pugh, R.J. Bubble and Foam Chemistry; Cambridge University Press: Cambridge, UK, 2016; ISBN 978-1-107-09057-6.
- Burlatsky, S.F.; Atrazhev, V.V.; Dmitriev, D.V.; Sultanov, V.I.; Timokhina, E.N.; Ugolkova, E.A.; Tulyani, S.; Vincitore, A. Surface Tension Model for Surfactant Solutions at the Critical Micelle Concentration. J. Colloid Interface Sci. 2013, 393, 151–160.
- Denkov, N.D.; Tcholakova, S.; Golemanov, K.; Ananthpadmanabhan, K.P.; Lips, A. The Role of Surfactant Type and Bubble Surface Mobility in Foam Rheology. Soft Matter 2009, 5, 3389–3408.
- Monteux, C. Adsorption of Soluble Polymers at Liquid Interfaces and in Foams. Comptes Rendus Phys. 2014, 15, 775–785.
- Wilson, A. Foams: Physics, Chemistry and Structure; Springer: Berlin/Heidelberg, Germany, 1989; ISBN 978-1-4471-3807-5.
- Briceño-Ahumada, Z.; Soltero-Martínez, J.F.A.; Castillo, R. Aqueous Foams and Emulsions Stabilized by Mixtures of Silica Nanoparticles and Surfactants: A State-of-the-Art Review. Chem. Eng. J. Adv. 2021, 7, 100116.
- Petkova, R.; Tcholakova, S.; Denkov, N.D. Foaming and Foam Stability for Mixed Polymer–Surfactant Solutions: Effects of Surfactant Type and Polymer Charge. Langmuir 2012, 28, 4996–5009.
- Miyazawa, T.; Itaya, M.; Burdeos, G.C.; Nakagawa, K.; Miyazawa, T. A Critical Review of the Use of Surfactant-Coated Nanoparticles in Nanomedicine and Food Nanotechnology. Int. J. Nanomed. 2021, 16, 3937–3999.
- Heinz, H.; Pramanik, C.; Heinz, O.; Ding, Y.; Mishra, R.K.; Marchon, D.; Flatt, R.J.; Estrela-Lopis, I.; Llop, J.; Moya, S.; et al. Nanoparticle Decoration with Surfactants: Molecular Interactions, Assembly, and Applications. Surf. Sci. Rep. 2017, 72, 1–58.
- Alexandrov, D.V.; Alexandrova, I.V. From Nucleation and Coarsening to Coalescence in Metastable Liquids. Philos. Trans. R. Soc. Math. Phys. Eng. Sci. 2020, 378, 20190247.
- Dutta, A.K. Introductory Chapter: Surfactants in Household and Personal Care Formulations—An Overview; IntechOpen: London, UK, 2019; ISBN 978-1-78984-661-4.
- Deamer, D.W.; Pashley, R.M. Amphiphilic Components of the Murchison Carbonaceous Chondrite: Surface Properties and Membrane Formation. Orig. Life Evol. Biosphere J. Int. Soc. Study Orig. Life 1989, 19, 21–38.
- Schramm, L.L.; Stasiuk, E.N.; Marangoni, D.G. 2 Surfactants and Their Applications. Annu. Rep. Sect. C Phys. Chem. 2003, 99, 3–48.
- Micelle Formation by Surfactants. In Surfactants and Interfacial Phenomena; John Wiley & Sons, Ltd.: Hoboken, NJ, USA, 2004; pp. 105–177. ISBN 978-0-471-67056-8.
- Abel, S.; Waks, M.; Marchi, M.; Urbach, W. Effect of Surfactant Conformation on the Structures of Small Size Nonionic Reverse Micelles: A Molecular Dynamics Simulation Study. Langmuir 2006, 22, 9112–9120.
- Cortés, H.; Hernández-Parra, H.; Bernal-Chávez, S.A.; Prado-Audelo, M.L.D.; Caballero-Florán, I.H.; Borbolla-Jiménez, F.V.; González-Torres, M.; Magaña, J.J.; Leyva-Gómez, G. Non-Ionic Surfactants for Stabilization of Polymeric Nanoparticles for Biomedical Uses. Materials 2021, 14, 3197.
- Mashaghi, S.; Jadidi, T.; Koenderink, G.; Mashaghi, A. Lipid Nanotechnology. Int. J. Mol. Sci. 2013, 14, 4242–4282.
- Katz, J.S.; Nolin, A.; Yezer, B.A.; Jordan, S. Dynamic Properties of Novel Excipient Suggest Mechanism for Improved Performance in Liquid Stabilization of Protein Biologics. Mol. Pharm. 2019, 16, 282–291.
- McCoy, T.M.; Marlow, J.B.; Armstrong, A.J.; Clulow, A.J.; Garvey, C.J.; Manohar, M.; Darwish, T.A.; Boyd, B.J.; Routh, A.F.; Tabor, R.F. Spontaneous Self-Assembly of Thermoresponsive Vesicles Using a Zwitterionic and an Anionic Surfactant. Biomacromolecules 2020, 21, 4569–4576.
- Clendennen, S.K.; Boaz, N.W. Chapter 14 - Betaine Amphoteric Surfactants—Synthesis, Properties, and Applications. In Biobased Surfactants, 2nd ed.; Hayes, D.G., Solaiman, D.K.Y., Ashby, R.D., Eds.; Academic Press: Cambridge, MA, USA; AOCS Press (Elsevier): Amsterdam, The Netherlands, 2019; pp. 447–469. ISBN 978-0-12-812705-6.
- Lin, W.; Kampf, N.; Klein, J. Designer Nanoparticles as Robust Superlubrication Vectors. ACS Nano 2020, 14, 7008–7017.
- Nastasa, V.; Samaras, K.; Ampatzidis, C.; Karapantsios, T.D.; Trelles, M.A.; Moreno-Moraga, J.; Smarandache, A.; Pascu, M.L. Properties of Polidocanol Foam in View of Its Use in Sclerotherapy. Int. J. Pharm. 2015, 478, 588–596.
- Raffa, P.; Wever, D.A.Z.; Picchioni, F.; Broekhuis, A.A. Polymeric Surfactants: Synthesis, Properties, and Links to Applications. Chem. Rev. 2015, 115, 8504–8563.
- Uversky, V.N. Natively Unfolded Proteins: A Point Where Biology Waits for Physics. Protein Sci. 2002, 11, 739–756.
- Wang, Y.; Zhang, Y.; Li, X.; Sun, M.; Wei, Z.; Wang, Y.; Gao, A.; Chen, D.; Zhao, X.; Feng, X. Exploring the Effects of Different Types of Surfactants on Zebrafish Embryos and Larvae. Sci. Rep. 2015, 5, 10107.
- Lémery, E.; Briançon, S.; Chevalier, Y.; Bordes, C.; Oddos, T.; Gohier, A.; Bolzinger, M.-A. Skin Toxicity of Surfactants: Structure/Toxicity Relationships. Colloids Surf. Physicochem. Eng. Asp. 2015, 469, 166–179.
- Hoc, D.; Haznar-Garbacz, D. Foams as Unique Drug Delivery Systems. Eur. J. Pharm. Biopharm. 2021, 167, 73–82.
- AlYousef, Z.; Almobarky, M.; Schechter, D. Enhancing the Stability of Foam by the Use of Nanoparticles. Energy Fuels 2017, 31, 10620–10627.
- Bayat, A.E.; Rajaei, K.; Junin, R. Assessing the Effects of Nanoparticle Type and Concentration on the Stability of CO2 Foams and the Performance in Enhanced Oil Recovery. Colloids Surf. Physicochem. Eng. Asp. 2016, 511, 222–231.
- Arditty, S.; Schmitt, V.; Giermanska-Kahn, J.; Leal-Calderon, F. Materials Based on Solid-Stabilized Emulsions. J. Colloid Interface Sci. 2004, 275, 659–664.
- Emile, J.; Werts, M.H.V.; Artzner, F.; Casanova, F.; Emile, O.; Navarro, J.R.G.; Meneau, F. Foam Films in the Presence of Functionalized Gold Nanoparticles. J. Colloid Interface Sci. 2012, 383, 124–129.
- Zhang, Y.; Liu, Q.; Ye, H.; Yang, L.; Luo, D.; Peng, B. Nanoparticles as Foam Stabilizer: Mechanism, Control Parameters and Application in Foam Flooding for Enhanced Oil Recovery. J. Pet. Sci. Eng. 2021, 202, 108561.
- Yekeen, N.; Padmanabhan, E.; Idris, A.K.; Ibad, S.M. Surfactant Adsorption Behaviors onto Shale from Malaysian Formations: Influence of Silicon Dioxide Nanoparticles, Surfactant Type, Temperature, Salinity and Shale Lithology. J. Pet. Sci. Eng. 2019, 179, 841–854.
- Yang, K.; Li, S.; Zhang, K.; Wang, Y. Synergy of Hydrophilic Nanoparticle and Nonionic Surfactant on Stabilization of Carbon Dioxide-in-Brine Foams at Elevated Temperatures and Extreme Salinities. Fuel 2021, 288, 119624.
- Binks, B.P. Particles as Surfactants—Similarities and Differences. Curr. Opin. Colloid Interface Sci. 2002, 7, 21–41.
- Kaptay, G. Interfacial Criteria for Stabilization of Liquid Foams by Solid Particles. Colloids Surf. Physicochem. Eng. Asp. 2003, 230, 67–80.
- Shojaei, M.J.; Méheust, Y.; Osman, A.; Grassia, P.; Shokri, N. Combined Effects of Nanoparticles and Surfactants upon Foam Stability. Chem. Eng. Sci. 2021, 238, 116601.
- Srivastava, A.; Qiao, W.; Wu, Y.; Li, X.; Bao, L.; Liu, C. Effects of Silica Nanoparticles and Polymers on Foam Stability with Sodium Dodecylbenzene Sulfonate in Water–Liquid Paraffin Oil Emulsions at High Temperatures. J. Mol. Liq. 2017, 241, 1069–1078.
- Ahmed, S.; Alameri, W.; Ahmed, W.W.; Khan, S.A. Rheological Behavior of ScCO2-Foam for Improved Hydrocarbon Recovery: Experimental and Deep Learning Approach. J. Pet. Sci. Eng. 2021, 203, 108646.
- Zhang, W.; Shen, J.; Su, H.; Mu, G.; Sun, J.-H.; Tan, C.-P.; Liang, X.-J.; Ji, L.-N.; Mao, Z.-W. Co-Delivery of Cisplatin Prodrug and Chlorin E6 by Mesoporous Silica Nanoparticles for Chemo-Photodynamic Combination Therapy to Combat Drug Resistance. ACS Appl. Mater. Interfaces 2016, 8, 13332–13340.
- Kumar, B.; Kulanthaivel, S.; Mondal, A.; Mishra, S.; Banerjee, B.; Bhaumik, A.; Banerjee, I.; Giri, S. Mesoporous Silica Nanoparticle Based Enzyme Responsive System for Colon Specific Drug Delivery through Guar Gum Capping. Colloids Surf. B Biointerfaces 2017, 150, 352–361.
- Salatin, S.; Maleki Dizaj, S.; Yari Khosroushahi, A. Effect of the Surface Modification, Size, and Shape on Cellular Uptake of Nanoparticles. Cell Biol. Int. 2015, 39, 881–890.
- Voigt, N.; Henrich-Noack, P.; Kockentiedt, S.; Hintz, W.; Tomas, J.; Sabel, B.A. Surfactants, Not Size or Zeta-Potential Influence Blood–Brain Barrier Passage of Polymeric Nanoparticles. Eur. J. Pharm. Biopharm. 2014, 87, 19–29.
- Xiang, W.; Preisig, N.; Laine, C.; Hjelt, T.; Tardy, B.L.; Stubenrauch, C.; Rojas, O.J. Surface Activity and Foaming Capacity of Aggregates Formed between an Anionic Surfactant and Non-Cellulosics Leached from Wood Fibers. Biomacromolecules 2019, 20, 2286–2294. [Google Scholar] [CrossRef]
- Nypelö, T.; Laine, C.; Aoki, M.; Tammelin, T.; Henniges, U. Etherification of Wood-Based Hemicelluloses for Interfacial Activity. Biomacromolecules 2016, 17, 1894–1901. [Google Scholar] [CrossRef]
- He, Y.; Li, S.; Zhou, L.; Wei, C.; Yu, C.; Chen, Y.; Liu, H. Cellulose Nanofibrils-Based Hybrid Foam Generated from Pickering Emulsion toward High-Performance Microwave Absorption. Carbohydr. Polym. 2021, 255, 117333. [Google Scholar] [CrossRef] [PubMed]
- Zhao, W.; Hou, Q.; Wang, X. The Influence of Gas Diffusion Mechanisms on Foam Stability for Foam Forming of Paper Products. BioResources 2019, 14, 9893–9903. [Google Scholar]
- Yoon, I.-H.; Yoon, S.B.; Sihn, Y.; Choi, M.-S.; Jung, C.-H.; Choi, W.-K. Stabilizing Decontamination Foam Using Surface-Modified Silica Nanoparticles Containing Chemical Reagent: Foam Stability, Structures, and Dispersion Properties. RSC Adv. 2021, 11, 1841–1849. [Google Scholar] [CrossRef]
- Gunashekar, S.; Abu-Zahra, N. Characterization of Functionalized Polyurethane Foam for Lead Ion Removal from Water. Int. J. Polym. Sci. 2014, 2014, e570309. [Google Scholar] [CrossRef]
- Seyam, O.A.; Elshimy, A.S.; Niazi, G.E.M.; ElGhareeb, M. Ultrasound-Guided Percutaneous Injection of Foam Sclerotherapy in Management of Lower Limb Varicose Veins (Pilot Study). Egypt. J. Radiol. Nucl. Med. 2020, 51, 175. [Google Scholar] [CrossRef]
- Jeong, S.; Kim, S.; Choi, Y.; Jung, H.N.; Lee, K.; Park, M.H. Development of Glycerol-Rose Bengal-Polidocanol (GRP) Foam for Enhanced Sclerosis of a Cyst for Cystic Diseases. PLoS ONE 2021, 16, e0244635. [Google Scholar] [CrossRef] [PubMed]
- Moreno-Moraga, J.; Pascu, M.L.; Alcolea, J.M.; Smarandache, A.; Royo, J.; David, F.; Trelles, M.A. Effects of 1064-Nm Nd:YAG Long-Pulse Laser on Polidocanol Microfoam Injected for Varicose Vein Treatment: A Controlled Observational Study of 404 Legs, after 5-Year-Long Treatment. Lasers Med. Sci. 2019, 34, 1325–1332. [Google Scholar] [CrossRef] [PubMed]
- Smarandache, A.; Moreno, J.; Staicu, A.; Trelles, M.; Pascu, M.-L. Applications of Polidocanol in Varicose Vein Treatment Assisted by Exposure to Nd:YAG Laser Radiation. Nd YAG Laser 2019. [Google Scholar]
- Star, P.; Connor, D.E.; Parsi, K. Novel Developments in Foam Sclerotherapy: Focus on Varithena® (Polidocanol Endovenous Microfoam) in the Management of Varicose Veins. Phlebology 2018, 33, 150–162. [Google Scholar] [CrossRef]
- Smarandache, A.; Staicu, A.; Nastasa, V.; Moreno-Moraga, J.; Royo de la Torre, J.; Trelles, M.; Pascu, M.-L. Physical Properties of Laser Irradiated Sclerosing Foams. Romanian Rep. Phys. 2015, 67, 1480–1490. [Google Scholar]
- Smarandache, A.; Trelles, M.; Pascu, M.L. Measurement of the Modifications of Polidocanol Absorption Spectra after Exposure to NIR Laser Radiation. J. Optoelectron. Adv. Mater. 2010, 12, 1942–1945. [Google Scholar]
- Hsu, S.L. Raman Spectroscopic Studies of Polymer Structure. In Raman Scattering in Materials Science; Weber, W.H., Merlin, R., Eds.; Springer Series in Materials Science; Springer: Berlin/Heidelberg, Germany, 2000; pp. 369–445. ISBN 978-3-662-04221-2. [Google Scholar]
- Zhao, D.; Zhang, L.; Siebold, D.; DeArmond, D.; Alvarez, N.T.; Shanov, V.N.; Heineman, W.R. Electrochemical Studies of Three Dimensional Graphene Foam as an Electrode Material. Electroanalysis 2017, 29, 1506–1512. [Google Scholar] [CrossRef]
- Liu, J.; Zhang, L.; Wu, H.B.; Lin, J.; Shen, Z.; Lou, X.W.D. High-Performance Flexible Asymmetric Supercapacitors Based on a New Graphene Foam/Carbon Nanotube Hybrid Film. Energy Environ. Sci. 2014, 7, 3709–3719. [Google Scholar] [CrossRef]
- Barik, T.K.; Bandyopadhyay, P.; Roy, A. Probing Internal Stress and Crystallinity in Wet Foam via Raman Spectroscopy. Int. J. Mod. Phys. B 2009, 23, 3913–3924. [Google Scholar] [CrossRef]
- Goutev, N.; Nickolov, Z.S. Raman Studies of Three-Dimensional Foam. Phys. Rev. E 1996, 54, 1725–1733. [Google Scholar] [CrossRef]
- Smarandache, A. Laser Beams Interaction with Polidocanol Foam: Molecular Background. Photomed. Laser Surg. 2012, 30, 262–267. [Google Scholar] [CrossRef]
- Amer, M.S. (Ed.) Raman Spectroscopy for Soft Matter Applications; John Wiley & Sons, Inc.: Hoboken, NJ, USA, 2009; ISBN 978-0-470-47599-7. [Google Scholar]
- Vera, M.U.; Saint-Jalmes, A.; Durian, D.J. Scattering Optics of Foam. Appl. Opt. 2001, 40, 4210–4214. [Google Scholar] [CrossRef]
- Zhang, C.; Reufer, M.; Gaudino, D.; Scheffold, F. Improved Diffusing Wave Spectroscopy Based on the Automatized Determination of the Optical Transport and Absorption Mean Free Path. Korea-Aust. Rheol. J. 2017, 29, 241–247. [Google Scholar] [CrossRef]
- Gopal, A.D.; Durian, D.J. Shear-Induced “Melting” of an Aqueous Foam. J. Colloid Interface Sci. 1999, 213, 169–178. [Google Scholar] [CrossRef]
- Höhler, R.; Cohen-Addad, S.; Durian, D.J. Multiple Light Scattering as a Probe of Foams and Emulsions. Curr. Opin. Colloid Interface Sci. 2014, 19, 242–252. [Google Scholar] [CrossRef]
- Kaplan, P.D.; Dinsmore, A.D.; Yodh, A.G.; Pine, D.J. Diffuse-Transmission Spectroscopy: A Structural Probe of Opaque Colloidal Mixtures. Phys. Rev. E 1994, 50, 4827–4835. [Google Scholar] [CrossRef]
- Cantat, I. Foams: Structure and Dynamics; First English edition; Oxford University Press: New York, NY, USA, 2013; ISBN 978-0-19-966289-0. [Google Scholar]
- Cohen-Addad, S.; Höhler, R. Bubble Dynamics Relaxation in Aqueous Foam Probed by Multispeckle Diffusing-Wave Spectroscopy. Phys. Rev. Lett. 2001, 86, 4700–4703. [Google Scholar] [CrossRef]
- Earnshaw, J.C.; Jaafar, A.H. Diffusing-Wave Spectroscopy of a Flowing Foam. Phys. Rev. E 1994, 49, 5408–5411. [Google Scholar] [CrossRef]
- Höhler, R.; Cohen-Addad, S.; Hoballah, H. Periodic Nonlinear Bubble Motion in Aqueous Foam under Oscillating Shear Strain. Phys. Rev. Lett. 1997, 79, 1154–1157. [Google Scholar] [CrossRef]
- Crassous, J.; Saint-Jalmes, A. Probing the Dynamics of Particles in an Aging Dispersion Using Diffusing Wave Spectroscopy. Soft Matter 2012, 8, 7683. [Google Scholar] [CrossRef]
- Marze, S.; Langevin, D.; Saint-Jalmes, A. Aqueous Foam Slip and Shear Regimes Determined by Rheometry and Multiple Light Scattering. J. Rheol. 2008, 52, 1091–1111. [Google Scholar] [CrossRef]
- Isert, N.; Maret, G.; Aegerter, C.M. Studying Foam Dynamics in Levitated, Dry and Wet Foams Using Diffusing Wave Spectroscopy. Colloids Surf. Physicochem. Eng. Asp. 2015, 473, 40–45. [Google Scholar] [CrossRef]
- Chang, Q. Emulsion, Foam, and Gel. In Colloid and Interface Chemistry for Water Quality Control; Elsevier: Amsterdam, The Netherlands, 2016; pp. 227–245. ISBN 978-0-12-809315-3.
- McClements, D.J. Nanoemulsions versus Microemulsions: Terminology, Differences, and Similarities. Soft Matter 2012, 8, 1719–1729.
- Miller, R. Emulsifiers: Types and Uses. In Encyclopedia of Food and Health; Elsevier: Amsterdam, The Netherlands, 2016; pp. 498–502. ISBN 978-0-12-384953-3.
- Wong, S.F.; Lim, J.S.; Dol, S.S. Crude Oil Emulsion: A Review on Formation, Classification and Stability of Water-in-Oil Emulsions. J. Pet. Sci. Eng. 2015, 135, 498–504.
- Mason, T.G.; Wilking, J.N.; Meleson, K.; Chang, C.B.; Graves, S.M. Nanoemulsions: Formation, Structure, and Physical Properties. J. Phys. Condens. Matter 2006, 18, R635.
- Anton, N.; Vandamme, T.F. Nano-Emulsions and Micro-Emulsions: Clarifications of the Critical Differences. Pharm. Res. 2011, 28, 978–985.
- Schulman, J.H.; Montagne, J.B. Formation of Microemulsion by Amino Alkyl Alcohols. Ann. N. Y. Acad. Sci. 1961, 92, 366–371.
- Calvo, P.; Vila-Jato, J.L.; Alonso, M.J. Comparative in Vitro Evaluation of Several Colloidal Systems, Nanoparticles, Nanocapsules, and Nanoemulsions, as Ocular Drug Carriers. J. Pharm. Sci. 1996, 85, 530–536.
- Gupta, A.; Eral, H.B.; Hatton, T.A.; Doyle, P.S. Nanoemulsions: Formation, Properties and Applications. Soft Matter 2016, 12, 2826–2841.
- Gupta, A. Nanoemulsions. In Nanoparticles for Biomedical Applications; Elsevier: Amsterdam, The Netherlands, 2020; pp. 371–384. ISBN 978-0-12-816662-8.
- Delmas, T.; Piraux, H.; Couffin, A.-C.; Texier, I.; Vinet, F.; Poulin, P.; Cates, M.E.; Bibette, J. How To Prepare and Stabilize Very Small Nanoemulsions. Langmuir 2011, 27, 1683–1692.
- Solans, C.; Izquierdo, P.; Nolla, J.; Azemar, N.; Garciacelma, M. Nano-Emulsions. Curr. Opin. Colloid Interface Sci. 2005, 10, 102–110.
- Winsor, P.A. Hydrotropy, Solubilisation and Related Emulsification Processes. Trans. Faraday Soc. 1948, 44, 376.
- Ita, K. Microemulsions. In Transdermal Drug Delivery; Elsevier: Amsterdam, The Netherlands, 2020; pp. 97–122. ISBN 978-0-12-822550-9.
- Callender, S.P.; Mathews, J.A.; Kobernyk, K.; Wettig, S.D. Microemulsion Utility in Pharmaceuticals: Implications for Multi-Drug Delivery. Int. J. Pharm. 2017, 526, 425–442.
- Whitby, C.P. Nanoparticles at Fluid Interfaces: From Surface Properties to Biomedical Applications. In Comprehensive Nanoscience and Nanotechnology; Elsevier: Amsterdam, The Netherlands, 2019; pp. 127–146. ISBN 978-0-12-812296-9.
- Chevalier, Y.; Bolzinger, M.-A. Emulsions Stabilized with Solid Nanoparticles: Pickering Emulsions. Colloids Surf. Physicochem. Eng. Asp. 2013, 439, 23–34.
- Nakama, Y. Surfactants. In Cosmetic Science and Technology; Elsevier: Amsterdam, The Netherlands, 2017; pp. 231–244. ISBN 978-0-12-802005-0.
- Holmberg, K. Surfactants. In Ullmann’s Encyclopedia of Industrial Chemistry; Wiley-VCH Verlag GmbH & Co. KGaA: Weinheim, Germany, 2019; pp. 1–56. ISBN 978-3-527-30673-2.
- Bancroft, W.D. The Theory of Emulsification, V.J. Phys. Chem. 1913, 17, 501–519.
- Ali, A.; Ansari, V.; Ahmad, U.; Akhtar, J.; Jahan, A. Nanoemulsion: An Advanced Vehicle For Efficient Drug Delivery. Drug Res. 2017, 67, 617–631.
- Yang, Y.; Fang, Z.; Chen, X.; Zhang, W.; Xie, Y.; Chen, Y.; Liu, Z.; Yuan, W. An Overview of Pickering Emulsions: Solid-Particle Materials, Classification, Morphology, and Applications. Front. Pharmacol. 2017, 8, 287.
- Li, X.; Li, H.; Xiao, Q.; Wang, L.; Wang, M.; Lu, X.; York, P.; Shi, S.; Zhang, J. Two-Way Effects of Surfactants on Pickering Emulsions Stabilized by the Self-Assembled Microcrystals of α-Cyclodextrin and Oil. Phys. Chem. Chem. Phys. 2014, 16, 14059–14069.
- Zhao, Z.; Wang, W.; Xiao, J.; Chen, Y.; Cao, Y. Interfacial Engineering of Pickering Emulsion Co-Stabilized by Zein Nanoparticles and Tween 20: Effects of the Particle Size on the Interfacial Concentration of Gallic Acid and the Oxidative Stability. Nanomaterials 2020, 10, 1068.
- Rosi Cappellani, M.; Perinelli, D.R.; Pescosolido, L.; Schoubben, A.; Cespi, M.; Cossi, R.; Blasi, P. Injectable Nanoemulsions Prepared by High Pressure Homogenization: Processing, Sterilization, and Size Evolution. Appl. Nanosci. 2018, 8, 1483–1491.
- Dalmazzone, C. The Mechanical Generation of Emulsions. Lubr. Sci. 2005, 17, 197–237.
- Dinache, A.; Smarandache, A.; Andrei, I.R.; Urzica, I.; Nichita, C.; Boni, M.; Nastasa, V.; Pascu, M.L. Laser Assisted Generation of Micro/Nanosize Emulsions. Colloids Surf. Physicochem. Eng. Asp. 2019, 577, 265–273.
- Rocca, S.; García-Celma, M.J.; Calderó, G.; Pons, R.; Solans, C.; Stébé, M.J. Hydrophilic Model Drug Delivery from Concentrated Reverse Emulsions. Langmuir 1998, 14, 6840–6845.
- Singh, Y.; Meher, J.G.; Raval, K.; Khan, F.A.; Chaurasia, M.; Jain, N.K.; Chourasia, M.K. Nanoemulsion: Concepts, Development and Applications in Drug Delivery. J. Controlled Release 2017, 252, 28–49.
- Sánchez-López, E.; Guerra, M.; Dias-Ferreira, J.; Lopez-Machado, A.; Ettcheto, M.; Cano, A.; Espina, M.; Camins, A.; Garcia, M.L.; Souto, E.B. Current Applications of Nanoemulsions in Cancer Therapeutics. Nanomaterials 2019, 9, 821.
- Jafari, S.M.; He, Y.; Bhandari, B. Optimization of Nano-Emulsions Production by Microfluidization. Eur. Food Res. Technol. 2007, 225, 733–741.
- Piacentini, E.; Drioli, E.; Giorno, L. Membrane Emulsification Technology: Twenty-Five Years of Inventions and Research through Patent Survey. J. Membr. Sci. 2014, 468, 410–422.
- Ren, G.; Sun, Z.; Wang, Z.; Zheng, X.; Xu, Z.; Sun, D. Nanoemulsion Formation by the Phase Inversion Temperature Method Using Polyoxypropylene Surfactants. J. Colloid Interface Sci. 2019, 540, 177–184.
- Celis, M.-T.; Garcia-Rubio, L.H. Continuous Spectroscopy Characterization of Emulsions. J. Dispers. Sci. Technol. 2002, 23, 293–299. [Google Scholar] [CrossRef]
- Celis, M.; Garcia-Rubio, L.H. Characterization of Emulsions: A Systematic Spectroscopy Study. J. Dispers. Sci. Technol. 2008, 29, 20–26. [Google Scholar] [CrossRef]
- Dinache, A.; Smarandache, A.; Andrei, I.R.; Urzica, I.; Nichita, C.; Boni, M.; Nastasa, V.; Pascu, M.L. Laser Assisted Generation of Micro/Nanosize Emulsions. Colloids Surf. Physicochem. Eng. Asp. 2019, 577, 265–273. [Google Scholar] [CrossRef]
- Dinache, A.; Tozar, T.; Smarandache, A.; Andrei, I.R.; Nistorescu, S.; Nastasa, V.; Staicu, A.; Pascu, M.-L.; Romanitan, M.O. Spectroscopic Characterization of Emulsions Generated with a New Laser-Assisted Device. Molecules 2020, 25, 1729. [Google Scholar] [CrossRef]
- Song, M.-G.; Cho, S.-H.; Kim, J.-Y.; Kim, J.-D. Novel Evaluation Method for the Water- in- Oil (W/O) Emulsion Stability by Turbidity Ratio Measurements. Korean J. Chem. Eng. 2002, 19, 425–430. [Google Scholar] [CrossRef]
- Alexandraki, S.; Leontidis, E. Towards the Systematic Design of Multilayer O/W Emulsions with Tannic Acid as an Interfacial Antioxidant. RSC Adv. 2021, 11, 23616–23626. [Google Scholar] [CrossRef]
- Shinoda, R.; Uchimura, T. Evaluating the Creaming of an Emulsion via Mass Spectrometry and UV–Vis Spectrophotometry. ACS Omega 2018, 3, 13752–13756. [Google Scholar] [CrossRef]
- França De Sá, S.; Viana, C.; Ferreira, J.L. Tracing Poly(Vinyl Acetate) Emulsions by Infrared and Raman Spectroscopies: Identification of Spectral Markers. Polymers 2021, 13, 3609. [Google Scholar] [CrossRef]
- Kiefer, J.; Frank, K.; Zehentbauer, F.; Schuchmann, H. Infrared Spectroscopy of Bilberry Extract Water-in-Oil Emulsions: Sensing the Water-Oil Interface. Biosensors 2016, 6, 13. [Google Scholar] [CrossRef]
- Kiefer, J.; Frank, K.; Schuchmann, H.P. Attenuated Total Reflection Infrared (ATR-IR) Spectroscopy of a Water-in-Oil Emulsion. Appl. Spectrosc. 2011, 65, 1024–1028. [Google Scholar] [CrossRef]
- Masmoudi, H.; Dréau, Y.L.; Piccerelle, P.; Kister, J. The Evaluation of Cosmetic and Pharmaceutical Emulsions Aging Process Using Classical Techniques and a New Method: FTIR. Int. J. Pharm. 2005, 289, 117–131. [Google Scholar] [CrossRef]
- Zhou, G.-W.; Li, G.-Z.; Chen, W.-J. Fourier Transform Infrared Investigation on Water States and the Conformations of Aerosol-OT in Reverse Microemulsions. Langmuir 2002, 18, 4566–4571. [Google Scholar] [CrossRef]
- Sechler, T.D.; DelSole, E.M.; Deák, J.C. Measuring Properties of Interfacial and Bulk Water Regions in a Reverse Micelle with IR Spectroscopy: A Volumetric Analysis of the Inhomogeneously Broadened OH Band. J. Colloid Interface Sci. 2010, 346, 391–397. [Google Scholar] [CrossRef]
- Nickolov, Z.S.; Paruchuri, V.; Shah, D.O.; Miller, J.D. FTIR–ATR Studies of Water Structure in Reverse Micelles during the Synthesis of Oxalate Precursor Nanoparticles. Colloids Surf. Physicochem. Eng. Asp. 2004, 232, 93–99. [Google Scholar] [CrossRef]
- Jorgensen, L.; Weert, M.V.D.; Vermehren, C.; Bjerregaard, S.; Frokjaer, S. Probing Structural Changes of Proteins Incorporated into Water-in-Oil Emulsions. J. Pharm. Sci. 2004, 93, 1847–1859. [Google Scholar] [CrossRef]
- Thaiphanit, S.; Anprung, P. Physicochemical and Emulsion Properties of Edible Protein Concentrate from Coconut (Cocos Nucifera L.) Processing by-Products and the Influence of Heat Treatment. Food Hydrocoll. 2016, 52, 756–765. [Google Scholar] [CrossRef]
- Whittinghill, J.M.; Norton, J.; Proctor, A. A Fourier Transform Infrared Spectroscopy Study of the Effect of Temperature on Soy Lecithin-Stabilized Emulsions. J. Am. Oil Chem. Soc. 1999, 76, 1393–1398. [Google Scholar] [CrossRef]
- Rajak, V.K.; Singh, I.; Kumar, A.; Mandal, A. Optimization of Separation of Oil from Oil-in-Water Emulsion by Demulsification Using Different Demulsifiers. Pet. Sci. Technol. 2016, 34, 1026–1032. [Google Scholar] [CrossRef]
- Marze, S.; Choimet, M.; Foucat, L. In Vitro Digestion of Emulsions: Diffusion and Particle Size Distribution Using Diffusing Wave Spectroscopy and Diffusion Using Nuclear Magnetic Resonance. Soft Matter 2012, 8, 10994. [Google Scholar] [CrossRef]
- Reufer, M.; Machado, A.H.E.; Niederquell, A.; Bohnenblust, K.; Müller, B.; Völker, A.C.; Kuentz, M. Introducing Diffusing Wave Spectroscopy as a Process Analytical Tool for Pharmaceutical Emulsion Manufacturing. J. Pharm. Sci. 2014, 103, 3902–3913. [Google Scholar] [CrossRef]
- Niederquell, A.; Machado, A.H.E.; Kuentz, M. A Diffusing Wave Spectroscopy Study of Pharmaceutical Emulsions for Physical Stability Assessment. Int. J. Pharm. 2017, 530, 213–223. [Google Scholar] [CrossRef]
- Lorusso, V.; Orsi, D.; Salerni, F.; Liggieri, L.; Ravera, F.; McMillin, R.; Ferri, J.; Cristofolini, L. Recent Developments in Emulsion Characterization: Diffusing Wave Spectroscopy beyond Average Values. Adv. Colloid Interface Sci. 2021, 288, 102341. [Google Scholar] [CrossRef]
- Kolman, M.; Boland, G.; Amin, S. Exploring the Utility of Diffusing Wave Spectroscopy (DWS) as a Novel Tool for Early Detection of Stability Issues in Cosmetic Emulsions. Cosmetics 2021, 8, 99. [Google Scholar] [CrossRef]

