 +1 credit
| Version | Summary | Created by | Modification | Content Size | Created at | Operation |
|---|---|---|---|---|---|---|
| 1 | Oke Gerke | + 1301 word(s) | 1301 | 2020-08-25 12:43:02 | | | |
| 2 | Catherine Yang | Meta information modification | 1301 | 2020-09-01 09:35:06 | | | | |
| 3 | Karina Chen | Meta information modification | 1301 | 2020-10-27 01:52:44 | | |
Video Upload Options
The assessment of agreement in method comparison and observer variability analysis of quantitative measurements is usually done by the Bland-Altman Limits of Agreement, where the paired differences are implicitly assumed to follow a normal distribution. Whenever this assumption does not hold, the 2.5% and 97.5% percentiles are obtained by quantile estimation. In the literature, empirical quantiles have been used for this purpose. In this simulation study, we applied both sample, subsampling, and kernel quantile estimators as well as other methods for quantile estimation to sample sizes between 30 and 150 and different distributions of the paired differences. The performance of 15 estimators in generating prediction intervals was measured by their respective coverage probability for one newly generated observation. Our results indicated that sample quantile estimators based on one or two order statistics outperformed all the other estimators and can be used for deriving nonparametric Limits of Agreement. For sample sizes exceeding 80 observations, more advanced quantile estimators, such as the Harrell-Davis and estimators of Sfakianakis-Verginis type, which use all the observed differences, performed likewise well, but may be considered intuitively more appealing than simple sample quantile estimators that are based on only two observations per quantile.
1. Background
The classical Bland-Altman Limits of Agreement (BA LoA) define a range within which approximately 95% of normally distributed differences between paired measurements are expected to lie[1][2][3]. In cases of non-normally distributed differences, the use of empirical quantiles has been proposed as robust alternative[2][4][5]; however, extensive research endeavors in the past have suggested the application of nonparametric quantile estimation to the assessment of 2.5% and 97.5% percentiles as nonparametric LoA. We performed a simulation study on 15 nonparametric quantile estimators to derive nonparametric prediction intervals and assessed their performance by means of the coverage probability for one newly generated observation. The aim of this study was to suggest a nonparametric and robust alternative to the classical BA LoA when the normality assumption does not hold and/or the sample sizes are small to moderate. Our findings are illustrated by an application to data from a previously published clinical study on coronary artery calcification measured by the Agatston score[6]. All methodological details as well as Supplemental Material can be found in the main paper[7].
2. Systematic review
Databases such as JSTOR (Journal Storage), ScienceDirect, the online journal platform Taylor & Francis Online, and those maintained by PubMed/Medline in the NCBI (National Center for Biotechnology Information) were searched for the following terms: quantile estimator, nonparametric quantile estimator, nonparametric kernel quantile estimator, subsampling quantile estimator, and new quantile estimator. Fifteen nonparametric quantile estimators were chosen:
- Three sample quantile estimators[8][9][10]: SQp1, SQp2, and SQIp;
- Four subsampling quantile estimators[11][12][13][14][15][16]: HDp, KLp, KCp, and BPp;
- Two kernel quantile estimators[17][18][19]: KQp1 and KQp2;
- Six other quantile estimators[20][21][22][23]: KQplc, HDplc, SVp1, SVp2, SVp3, and NOp.
Hence, we chose very different types of nonparametric quantile estimators, which use one, two, or all the observations in a sample.
3. Simulation setup
We contrasted nonparametric LoA as constructed with the 15 abovementioned quantile estimators by comparing their coverage probabilities for the next paired difference under the given distributional assumption. Here, we employed the standard normal distribution (ND), a standard normal distribution with 1%, 2%, and 5% outliers (ND 1%, ND 2%, and ND 5%, respectively), an exponential distribution (ED) with a rate of 1, and a lognormal distribution (LND) with meanlog=0 and sdlog=1. For normal distributions comprising outliers, simulated data were replaced with a probability of 1%, 2%, and 5% by data sampled from a normal distribution with a mean of 0 and a standard deviation of 3.To examine small to moderate sample sizes, the sample size was set to 30, 50, 80, 100, and 150. For each combination of distribution, sample size, and nonparametric quantile estimator, 20,000 simulated trials of size (n+1) were generated with R. Here, a seed was set in order to use the same simulated data for each combination of distribution and sample size across nonparametric quantile estimators. The first n observations in each simulated trial were used to derive nonparametric LoA, to which the last observation was compared. The coverage probability was then the proportion of cases out of the 20,000 trials where the nonparametric LoA included the last observation. All figures were generated with Stata/MP 16.1 (College Station, Texas 77845 USA).
4. Results
For n=30, none of the estimators reached the nominal coverage probability of 0.95. The coverage probability of SQp1 was closest to 0.95, ranging from 0.934 to 0.938. Note that for sample sizes of up to n=40 observations, the smallest and largest difference are used as nonparametric quantile estimates for the 2.5% and 97.5% percentiles, respectively. For SQIp, HDp, HDplc, SVp1, SVp2, and SVp3, the coverage probabilities were at least 0.921, 0.911, 0.910, 0.920, 0.914, and 0.923, respectively. Neither SQp2 nor KLp are defined for n<40.
SQp2 was the only estimator with coverage probabilities oscillating closely around 0.95 for all the investigated sample sizes n≥50; for n=50, SQp2 was the only one to do so (Figure 1).
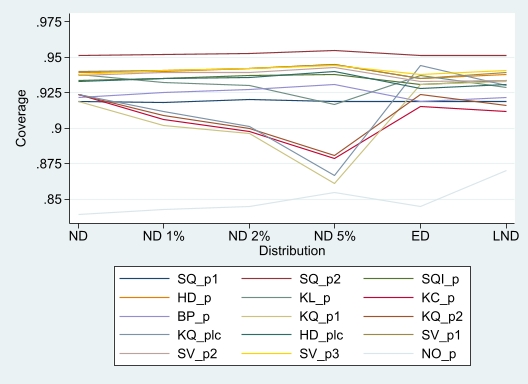
Figure 1. Lineplots of coverage probabilities across scenarios by nonparametric estimator (n=50).
For n=80, the coverage probabilities of HDp, SVp1, SVp2, and SVp3 fluctuated closely around the nominal level except for the simulations with an ED (0.94) (Figure 2). For n≥100, these estimators performed close to the 0.95 nominal level for all the investigated distributions. The coverage probabilities of the recently proposed NOp estimator varied between 0.945 and 0.950 for n=200 and were very close to 0.95 for n=250 (results not shown).
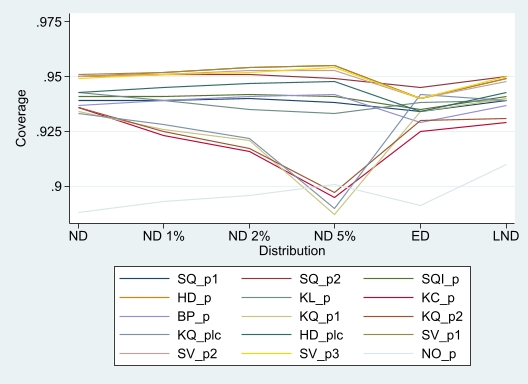
Figure 2. Lineplots of coverage probabilities across scenarios by nonparametric estimator (n=80).
5. Worked example
Diederichsen et al. [6] compared coronary artery calcification measurements using the Agatston score with the measurements using Framingham Heart Score in Danes of 50 and 60 years of age. Of 1,825 randomly sampled citizens, 1,257 consented to participation in the study, and 1,156 of them were eligible. To assess intra- and inter-rater agreement, Agatston scores were independently reanalyzed for 129 randomly chosen study participants, and the agreement measures were the proportions of agreement and the kappa statistics for dichotomized calcification status (absence vs. presence). In the following, the intra-rater differences are used for exemplification purposes.
Approximately half of the 129 participants had an Agatston score of 0. The paired intra-rater differences ranged from -683 to 130, with a first, second, and third quartile being equal to 0; the 5th, 10th, 90th and 95th percentiles were -23, -12, 1.1, and 5, respectively. The empirical distribution of the paired differences was, therefore, characterized by its denseness around 0 and a single, comparatively extreme outlier, clearly indicating the inappropriateness of the normality assumption in this setting (Figure 3).
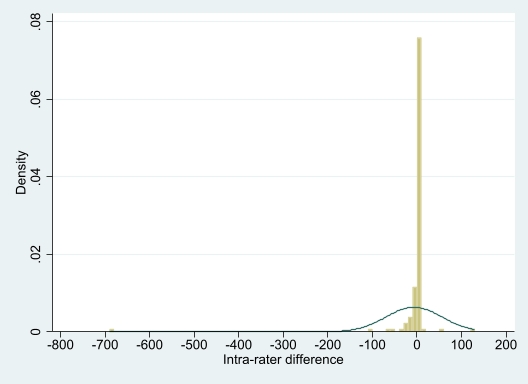
Figure 3. Histogram for the data of the worked example, including an approximating normal distribution.
Using SQp2, HDp, and SVp1, the nonparametric, asymmetric, and robust LoA are -61.5, 12.8; -96.2, 26.7; and -122.1, 30.6, respectively, whereas the symmetric BA LoA of -129.8, 116.1 are equidistant from the estimated mean difference of -6.9 (Figure 4). The upper LoA for HDp and SVp1 are similar, but the respective lower LoA are differently affected by the single outlier (3942.5, -683). SQp2 appears to be most robust to few outliers due to its definition.
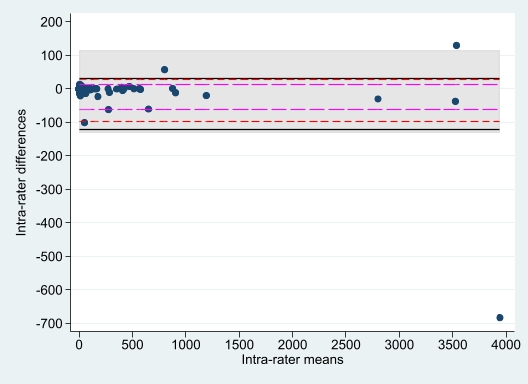
Figure 4. SQp2 (magenta, long dashes), HDp (red, short dashes) and SVp1 (black, solid lines) contrasted with classical BA LoA (shaded area).
The sensitivity of the classical BA LoA to outliers becomes crystal-clear when excluding the single outlier here. Then, the symmetric BA LoA are -37.4 and 34.3, and the estimated mean difference reduces to -1.6. In practice, outliers are, though, kept in the analysis dataset if there is no reasonable explanation for an exclusion. This underlines the importance of robust alternatives to the BA LoA.
6. Conclusions
The simple sample quantile estimators based on one and two order statistics performed closest to the nominal level in terms of the coverage probability for the next observation across six distributional scenarios for n=30 and n=50, 80, 100, 150. The Harrell-Davis subsampling estimator and estimators of the Sfakianakis-Verginis type followed closely for sample sizes of at least n=80 and may be considered intuitively more appealing as they use the entire sample, whereas more simple and outlier-robust sample quantile estimators are based on only a few observations from the sample.
References
- J. Martin Bland; Douglas G. Altman; STATISTICAL METHODS FOR ASSESSING AGREEMENT BETWEEN TWO METHODS OF CLINICAL MEASUREMENT. The Lancet 1986, 327, 307-310, 10.1016/s0140-6736(86)90837-8.
- Martin Bland; D.G. Altman; Measuring agreement in method comparison studies. Statistical Methods in Medical Research 1999, 8, 135-160, 10.1191/096228099673819272.
- Rosner, B.. Fundamentals of Biostatistics, 8th ed.; Cengage Learning: Boston, MA, 2015; pp. 122.
- Sabine Schmitz; Frank Krummenauer; Sebastian Henn; H. Burkhard Dick; Comparison of three different technologies for pupil diameter measurement. Graefe's Archive for Clinical and Experimental Ophthalmology 2003, 241, 472-477, 10.1007/s00417-003-0669-x.
- Patrick J. Twomey; How to use difference plots in quantitative method comparison studies. Annals of Clinical Biochemistry 2006, 43, 124-129, 10.1258/000456306776021616.
- Axel C. P. Diederichsen; Niels P. Sand; Bjarne L. Nørgaard; Jess Lambrechtsen; Jesper M. Jensen; Henrik Munkholm; et al.; Discrepancy between coronary artery calcium score and HeartScore in middle-aged Danes: the DanRisk study. European Journal of Preventive Cardiology 2011, 19, 558-564, 10.1177/1741826711409172.
- Frey, M. E.; Petersen, H. C.; Gerke, O.; Nonparametric Limits of Agreement for Small to Moderate Sample Sizes: a Simulation Study. Stats 2020, 3, 343–355, 10.3390/stats3030022.
- Terry Dielman; Cynthia Lowry; Roger Pfaffenberger; A comparison of quantile estimators. Communications in Statistics - Simulation and Computation 1994, 23, 355-371, 10.1080/03610919408813175.
- Rudolph S. Parrish; Comparison of Quantile Estimators in Normal Sampling. Biometrics 1990, 46, 247, 10.2307/2531649.
- Rob J. Hyndman; Yanan Fan; Sample Quantiles in Statistical Packages. The American Statistician 1996, 50, 361-365, 10.1080/00031305.1996.10473566.
- Frank E. Harrell; C. E. Davis; A new distribution-free quantile estimator. Biometrika 1982, 69, 635-640, 10.1093/biomet/69.3.635.
- Seth M. Steinberg; C. E. Davis; Comparison of nonparametric point estimators for interquantile differences in moderate sized samples. Communications in Statistics - Theory and Methods 1987, 16, 1607-1616, 10.1080/03610928708829457.
- W.D. Kalgh; Peter A. Lachenbruch; A generalized quantile estimator. Communications in Statistics - Theory and Methods 1982, 11, 2217-2238, 10.1080/03610926208828383.
- W. D. Kaigh; Quantile interval estimation. Communications in Statistics - Theory and Methods 1983, 12, 2427-2443, 10.1080/03610928308828610.
- W.D. Kaigh; Cheng Cheng; Subsampling quantile estimators and uniformity criteria. Communications in Statistics - Theory and Methods 1991, 20, 539-560, 10.1080/03610929108830514.
- Cheng Cheng; The Bernstein polynomial estimator of a smooth quantile function. Statistics & Probability Letters 1995, 24, 321-330, 10.1016/0167-7152(94)00190-j.
- Shie-Shien Yang; A Smooth Nonparametric Estimator of a Quantile Function. Journal of the American Statistical Association 1985, 80, 1004-1011, 10.1080/01621459.1985.10478217.
- Simon J. Sheather; J. S. Marron; Kernel Quantile Estimators. Journal of the American Statistical Association 1990, 85, 410-416, 10.1080/01621459.1990.10476214.
- Daniel Zelterman; Smooth nonparametric estimation of the quantile function. Journal of Statistical Planning and Inference 1990, 26, 339-352, 10.1016/0378-3758(90)90136-i.
- Mei Ling Huang; Percy Brill; A level crossing quantile estimation method. Statistics & Probability Letters 1999, 45, 111-119, 10.1016/s0167-7152(99)00049-8.
- Mei Ling Huang; On a distribution-free quantile estimator. Computational Statistics & Data Analysis 2001, 37, 477-486, 10.1016/s0167-9473(01)00020-2.
- Michael E. Sfakianakis; Dimitris G. Verginis; A New Family of Nonparametric Quantile Estimators. Communications in Statistics - Simulation and Computation 2008, 37, 337-345, 10.1080/03610910701790491.
- Gözde Navruz; A. Fırat Özdemir; A new quantile estimator with weights based on a subsampling approach. British Journal of Mathematical and Statistical Psychology 2020, 73, ePub ahead of Print, 10.1111/bmsp.12198.

