Fresh apples are a commonly consumed and widely available product in food markets around the world.
1. Introduction
Apples as a horticultural consumer good are comprised of various product attributes, some of which may have varying levels of importance for consumers. Relevant consumer attributes possessed by fresh apples include the colour of the skin, shape, aroma, apple variety, texture and the length of their shelf life [1][2][3][4]. This latter attribute is particularly important, as even though apples have good storing qualities, they are ultimately perishable [5][6][7]. Colour and appearance are crucial in retail situations as they attract the consumer’s attention. Colour often serves as a cue for fruit quality; consumers commonly attempt to estimate the texture of apples as this gives them an indication of the taste [8]. Extant literature in this area classifies consumers into two main categories: those who prefer firmness, juiciness, and bit of acidity in apples, and those that who like sweeter, but less firm apples [9]. In addition to these product attributes which are inherent to the apple (intrinsic attributes), consumers are also interested in commercial attributes, such as price, packaging, branding, country of origin, and sustainability [10][11][12]. These are linked to the production, distribution, and presentation of apples (extrinsic attributes) [13][14][15][16][17]. Although early studies on horticultural and agricultural products have emphasised the importance of intrinsic attributes for consumers, more recent studies show that for agricultural and horticultural products external attributes are equally important for consumers [18][19][20][21][22]. Consumer choices regarding apple attributes, as well as the willingness to pay for fresh or processed apple products has been intensively studied in the US [23][24][25]; Consumer choice relies on a trade off between bundles of intrinsic and extrinsic product attribute; these include aspects of consumers personal backgrounds, including their sensory preferences and attitudes [26]. However, key-factors which lead to the determination of apple preferences are not as widely studied. In the following sub sections these factors are explained in more detail as they underpin the conceptual framework for this study. US consumers’ objective and subjective knowledge, as well as their sociodemographic backgrounds, their discernment as a buyer and their attitudes towards apple growers are likely to be key factors in determining the importance that US consumers place on physical and commercial apple attributes.
2. Apple Buyer Discernment
For the US food retail industry, as well as for the horticultural industry, it is important to know consumer preferences for new and existing varieties, as well as their ability to distinguish varieties
[27]. This allows businesses to offer products that consumers need and want, and enables marketers to differentiate their products from existing ones. Very few studies have focused on the perception of apple varieties and the ability of consumers to distinguish them
[27]. Studies which have shown that consumers are necessarily able to distinguish apple varieties have found that mostly neophobia or neophilia determines preference or aversion towards new apple varieties
[23][27]. In the US, new varieties are often termed as club varieties
[23]. Club varieties are subject to patent-protection. Growers who are part of the club have exclusive rights to produce and market the club variety as stipulated by a licensing contract. This includes both fruit quality and quantity
[28]. Common examples of club varieties on the US market are ‘Jazz™’, ‘SnowSweet
®’, ‘Sweet Sixteen’, ‘SweeTango
®’, ‘Zestar!™’, and ‘Pink Lady
®’
[23]. Examples of more traditional varieties are ‘Red’ and ‘Golden Delicious’, ‘Granny Smith’, ‘Fuji’, ‘Honeycrisp’, ‘McIntosh’, ‘Cripps Pink’
[29]. Given that the majority of consumers do not possess a good varietal knowledge, marketing promotions, such as tasting experiences which offer free samples coupled with promotional materials regarding varietals are crucial to improve the ability of consumers to distinguish amongst different varieties
[28].
3. Current Insight on Apple Attribute Preferences of US Consumers
The descriptive statistics of the sample are displayed in Table 1. The median respondent was aged between 25 and 34 years, had obtained a bachelor degree, and earned an annual pre-tax income ranging between USD 25,000 to USD 50,000 per year. Additionally, the other scale measured in the model was the objective apple knowledge score, which had a mean of 1.02, a range of between −4 to +5, and a standard deviation of 1.834.
Table 1. Sample description.
| |
Freq |
% |
Median |
StDev |
| Age |
|
|
|
|
| Under 21 |
2 |
0.5 |
|
|
| 21–24 |
16 |
4.2 |
|
|
| 25–34 |
215 |
56.1 |
✓ |
0.940 |
| 35–44 |
104 |
27.2 |
|
|
| 45–54 |
27 |
7.0 |
|
|
| 55–64 |
14 |
3.7 |
|
|
| 65+ |
5 |
1.3 |
|
|
| Total |
383 |
100 |
|
|
| Education |
|
|
|
|
| Did not finish high school |
6 |
1.6 |
|
|
| Finished high school |
46 |
12.0 |
|
|
| Attended University |
40 |
10.4 |
|
|
| Bachelors Degree |
223 |
58.2 |
✓ |
0.927 |
| Postgraduate Degree |
68 |
17.8 |
|
|
| Total |
383 |
100 |
|
|
| Household Annual Income |
|
|
|
|
| USD 0 to 24,999 |
80 |
20.9 |
|
|
| USD 25,000 to 49,999 |
117 |
30.5 |
✓ |
1.141 |
| USD 50,000 to 74,999 |
119 |
31.1 |
|
|
| USD 75,000 to 99,999 |
40 |
10.4 |
|
|
| USD 100,000 or higher |
27 |
7.0 |
|
|
| Total |
383 |
100 |
|
|
| Gender |
|
|
|
|
| Male |
196 |
51.2 |
✓ |
0.501 |
| Female |
187 |
48.8 |
|
|
| Total |
383 |
100 |
|
|
| US Geographical Distribution |
|
|
|
| North-East |
83 |
21.7 |
|
|
| Mid-West |
133 |
34.8 |
|
|
| South |
90 |
23.5 |
|
|
| West |
77 |
20.1 |
|
|
| Total |
383 |
100 |
|
The measurement model assessment included the use of reliability to test the model constructs, as well as the use convergent and discriminant validity to conduct further checks. All items achieved a factor loading of well above the minimum of 0.4, indicating their suitable contribution to the scale (see
Table 2). Reliability was confirmed by both the Cronbach Alpha and composite reliability scores being above 0.6. Convergent validity was also indicated by AVE scores being higher than 0.5 for all the scales. Given that all indicators were within acceptable ranges, the requirements of construct reliability and validity were considered satisfactory
[30].
Table 2. Scale loadings, reliabilities, and convergent validity.
| Scales and Items |
Factor Loadings |
Cronbach’s Alpha |
Composite Reliability |
Average Variance Extracted |
| Discerning Apple Buyer |
|
0.836 |
0.877 |
0.504 |
| How similar are Pink Lady and Cosmic Crisp |
0.741 |
|
|
|
| How similar are Granny Smith and Royal Gala |
0.731 |
|
|
|
| How similar are Pink Lady and Cripps Pink |
0.706 |
|
|
|
| How similar are McIntosh and Braeburn |
0.749 |
|
|
|
| How similar are Zestar! and Sweet Tango |
0.718 |
|
|
|
| How similar are Fuji and Red Delicious |
0.639 |
|
|
|
| How similar are Red Delicious and Golden Delicious |
0.680 |
|
|
|
| Importance of Apple Commercial Attributes |
|
0.701 |
0.817 |
0.527 |
| Importance of—Price |
0.702 |
|
|
|
| Importance of—Labelled as sustainable |
0.719 |
|
|
|
| Importance of—Labelled as traditional varieties such as Royal Gala, Braeburn, Granny Smith |
0.735 |
|
|
|
| Importance of—Labelled as club apples such as Pink lady or Cosmic Crisp |
0.747 |
|
|
|
| Importance of Apple Physical Attributes |
|
0.723 |
0.825 |
0.543 |
| Importance of—Colour of the skin is true to variety |
0.773 |
|
|
|
| Importance of—Smell is appealing |
0.700 |
|
|
|
| Importance of—Texture is soft |
0.793 |
|
|
|
| Importance of—Skin is free of visual blemishes |
0.673 |
|
|
|
| My Attitudes towards US Apple Growers |
|
0.836 |
0.880 |
0.552 |
| I think that US growers have a longstanding tradition and lots of experience in growing sustainable apples. |
0.728 |
|
|
|
| I think that US apple growers contribute to the care and maintenance of the landscape |
0.678 |
|
|
|
| I think that US apple growers make active contributions to preserve biodiversity |
0.841 |
|
|
|
| I think that US apple growers treat land resources responsible |
0.707 |
|
|
|
| I think that social pressure on apple growers should be increased as they are main agents of climate change. |
0.665 |
|
|
|
| I think that US apple growers are environmental conscious |
0.821 |
|
|
|
| Subjective Apple Knowledge |
|
0.860 |
0.905 |
0.704 |
| I understand a lot about apples |
0.821 |
|
|
|
| I am confident in my knowledge of apples |
0.810 |
|
|
|
| Among my friends I am the apple expert |
0.882 |
|
|
|
| I know more about apples than others do |
0.841 |
|
|
Both the Fornell–Larker criterion and Heterotrait–Monotrait (HTMT) ratios were utilized to test discriminant validity, with the requirements for discriminant validity being met for all of the variable constructs (see
Table 3). The square root of each constructs’ AVE was found to be higher than its correlation with other constructs. HTMT ratios are all less than 0.90, with the exception of the HTMT ratio between the importance placed on physical apple attributes and the importance placed on commercial apple attributes (1), which is a higher ratio than that which is recommended. However, this does not represent a problem because the two constructs both measure the apple attribute importance, with one construct being intrinsic and the other extrinsic to the product. Additionally, the largest VIF was 1.338 and the average VIF was 1.158, indicating that there were no problems with multicollinearity
[31].
Table 3. Scale discriminant validity.
| Fornell–Larcker Criterion |
Discerning Apple Buyer |
Importance of Apple Commercial Attributes |
Importance of Apple Physical Attributes |
Attitudes towards US Apple Growers |
Subjective Apple Knowledge |
| Discerning Apple Buyer |
0.710 |
|
|
|
|
| Importance of Apple Commercial Attributes |
0.638 |
0.726 |
|
|
|
| Importance of Apple Physical Attributes |
0.571 |
0.719 |
0.737 |
|
|
| Attitudes towards US Apple Growers |
0.503 |
0.476 |
0.501 |
0.743 |
|
| Subjective Apple Knowledge |
0.484 |
0.426 |
0.360 |
0.548 |
0.839 |
| Heterotrait–Monotrait Ratio |
|
|
|
|
|
| Discerning Apple Buyer |
|
|
|
|
|
| Importance of Apple Commercial Attributes |
0.831 |
|
|
|
|
| Importance of Apple Physical Attributes |
0.713 |
1 |
|
|
|
| Attitudes towards US Apple Growers |
0.588 |
0.614 |
0.618 |
|
|
| Subjective Apple Knowledge |
0.566 |
0.546 |
0.417 |
0.635 |
|
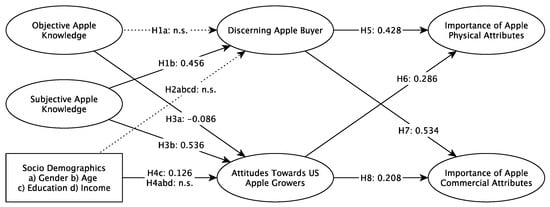
The conceptual framework and its overall structure was tested, resulting in a Goodness of Fit of 0.43 and a Normed Fit Index of 0.676. A Standardised Root Mean Square Residual of 0.074 was also achieved, and this indicated that adequacy of the overall model fit. The explanatory and predictive power of the conceptual model was also tested, and this resulted in average R2/Q2 values of 0.349/0.293, which indicates that the model has overall weak/moderate explanatory power and moderate predictive relevance. However, some parts of the model were found to be stronger than other parts. The R2/Q2 scores of 0.248/0.336 for discerning apple buyers would be considered weak in their explanatory power and moderate in their predictive relevance, but the score of 0.440/0.216 for importance placed on commercial apple attributes, and 0.388/0.247 for importance placed on physical apple attributes indicate weak/moderate levels of explanatory power and small predictive relevance. The score of 0.321/0.372 for attitudes towards US growers would be considered to have moderate explanatory power and medium predictive relevance. The structure of the model was confirmed to be fit for hypothesis testing due to the adequate model fit, the weak to moderate explanatory power, and the weak to medium predictive accuracy. Table 4 and Figure 1 show the results of the hypothesis testing.
Figure 1. Results of the conceptual model.
Table 4. Path coefficients and hypothesis testing results.
| Hypothesised Relationship |
Coefficient |
T Stat |
p Value |
| H1a: Objective Apple Knowledge -> Discerning Apple Buyer |
−0.008 |
0.191 |
0.848 |
| H1b: Subjective Apple Knowledge -> Discerning Apple Buyer |
0.456 |
11.929 |
0.000 |
| H2a: Gender -> Discerning Apple Buyer |
−0.027 |
0.627 |
0.530 |
| H2b: Age -> Discerning Apple Buyer |
−0.077 |
1.773 |
0.076 |
| H2c: Education -> Discerning Apple Buyer |
0.068 |
1.511 |
0.131 |
| H2d: Income -> Discerning Apple Buyer |
−0.054 |
1.206 |
0.228 |
| H3a: Objective Apple Knowledge -> My Attitudes towards US Apple Growers |
−0.086 |
2.133 |
0.033 |
| H3b: Subjective Apple Knowledge -> My Attitudes towards US Apple Growers |
0.536 |
10.553 |
0.000 |
| H4a: Gender -> My Attitudes towards US Apple Growers |
−0.006 |
0.129 |
0.898 |
| H4b: Age -> My Attitudes towards US Apple Growers |
0.031 |
0.729 |
0.466 |
| H4c: Education -> My Attitudes towards US Apple Growers |
0.126 |
2.134 |
0.033 |
| H4d: Income -> My Attitudes towards US Apple Growers |
0.005 |
0.140 |
0.889 |
| H5: Discerning Apple Buyer -> Importance of Apple Physical Attributes |
0.428 |
7.142 |
0.000 |
| H6: My Attitudes towards US Apple Growers -> Importance of Apple Physical Attributes |
0.286 |
4.776 |
0.000 |
| H7: Discerning Apple Buyer -> Importance of Apple Commercial Attributes |
0.534 |
9.267 |
0.000 |
| H8: My Attitudes towards US Apple Growers -> Importance of Apple Commercial Attributes |
0.208 |
3.586 |
0.000 |
Bold = p < 0.05.
The subjective knowledge was the most important factor determining the discernment of buyers and attitudes towards US growers. Objective knowledge was not found to have any impact, while only education as a sociodemographic factor had impact. The discernment as a buyer and the ability to distinguish apple varieties had the greatest impact on the importance that US consumers placed on apple attributes. Additionally, attitudes towards growers impacted the importance consumers placed on intrinsic and extrinsic apple attributes.
 +1 credit